
EB Daily Market Report - Monday, August 8, 2022
Top 10 Stock Picks - Sneak Preview Event:
At 4:30pm ET, we'll be hosting our quarterly Sneak Preview of the Top 10 Stock Picks (Portfolio DRAFT). We'll be making a few key strategy changes, so you may want to tune in for that! If you cannot attend live, we'll record the event and make it available later this evening or tomorrow.
ChartLists
There have been TONS of earnings reports out over the past two weeks, but I've just about caught up with all of them. I expect to have the following ChartLists done tomorrow and available for download:
- Strong Earnings ChartList (SECL)
- Strong Future Earnings ChartList (SFECL)
Executive Market Summary
- Futures were higher overnight and our major indices gapped up
- Rotation has been a little defensive for a second straight day, especially as it relates to discretionary (XLY, +0.68%) vs. staples (XLP, -0.07%); the XLY:XLP ratio has been declining all day - just like Friday
- The S&P 500 hit 4186.62, eclipsing the early-June high of 4177.51; a possible neckline has now been established
- A possible selloff to the 20-day EMA now has higher odds, though I wouldn't necessarily bank on it
- NVIDIA (NVDA, -8.11%) issued a warning, which is having a very negative impact on semiconductors ($DJUSSC, -3.34%)
- Technology (XLK, -1.16%), understandably, is today's weakest sector
- Energy (XLE, +0.92%) is showing relative strength as crude oil ($WTIC, +1.42%) rebounds to $90 per barrel
- NVDA and other semiconductors are littering the list of worst-performing S&P 500 companies
Market Outlook
Let's take another look at the S&P 500 and the XLY:XLP ratio, because I think it could still be flashing a short-term warning sign:
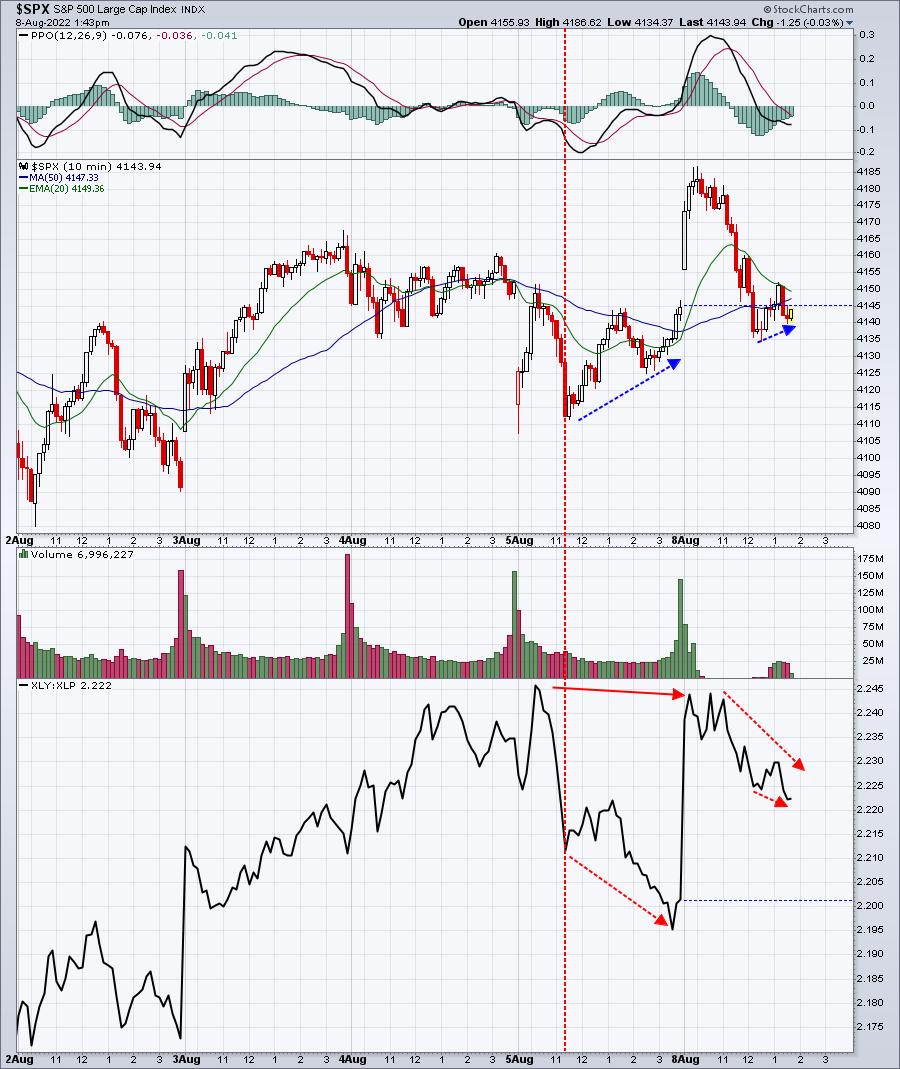
I didn't like Friday's behavior in this XLY:XLP ratio as it was not really confirming the intraday recovering in the S&P 500. Then today, we saw the big gap higher and early morning strength in the S&P 500 to clear a very important hurdle - the 4176 high in early June. But for the second straight session, money is rotating away from the XLY and into the XLP. This definitely makes me a bit more nervous in the very near-term. I want to stress the VERY NEAR-TERM. The daily chart of the XLY:XLP is very bullish. This could be nothing more than a little repositioning ahead of Wednesday's July CPI report, which will be released at 8:30am ET.
If I was only concerned about where we are in 6 months or a year, I'd remain fully invested on the long side. So the above chart is only concerning if you actively trade the market and are trying to make money every day. This behavior makes me pause and completely IGNORE the prospects of leveraged ETFs like the QLD. I don't want leverage when short-term risks grow. Instead, I lighten the load on the long side and hold much more cash, waiting out the market to see if we might get a 20-day EMA test (where I would consider leverage again) or see if we can breakout again. Many times, bull markets wait for NO ONE. That's why 1-year returns off cyclical bear market bottoms are so strong. We see little weakness and constantly rising prices. I will not be afraid to jump in again 100% if the S&P 500 clears 4180-4200 on a closing basis. I don't care how much higher we are off the bottom, nor do I worry about overbought conditions.
Sector/Industry Focus
Transportation stocks are doing "okay". If the S&P 500 is in a new uptrend, that would portend of improving economic conditions in the months ahead. That, in turn, should result in a strengthening transportation group ($TRAN). The group is "going along for the ride", but not showing leadership. Here's the current technical outlook for the group:
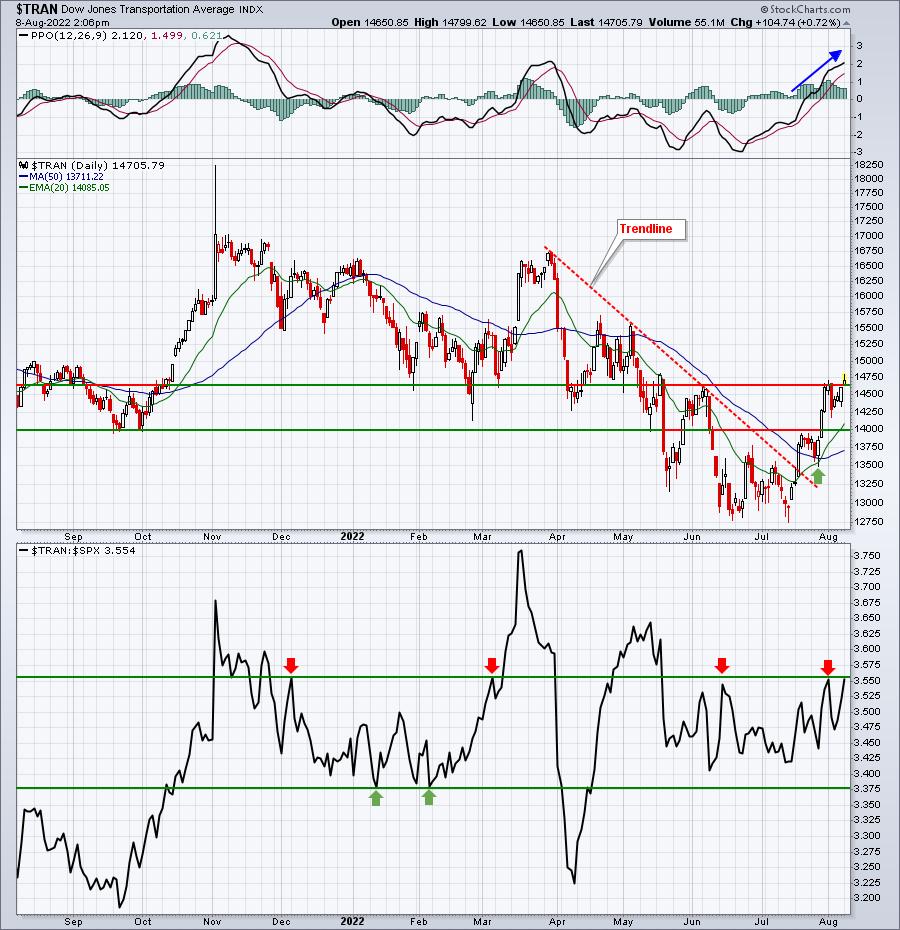
The relative strength has been range-bound for the past few months, meaning that transports are simply riding along with the S&P 500 - and that's not a bad thing. But if we begin to see relative improvement, it would be one sign that Wall Street is anticipating further economic improvement ahead.
ChartLists/Strategies
Holding any stock into an earnings report is a MAJOR gamble. I've seen it all. Great earnings reports and HUGE upside moves. Great earnings reports and HUGE declines. Big misses and massive rallies. Big misses and huge declines. Honestly, anything is possible. For me, the only thing I can say with certainty, based on the charts, is whether Wall Street believes in a company or not. That's the best I can do. I expect a VERY solid report IF a company is trending higher, shows a strengthening AD line, and has excellent relative strength vs. its peers and the S&P 500. But let me be clear. Even all of those things, combined with an excellent report, don't guarantee that the stock will move higher. The stock market is very inefficient in the short-term and that's EXACTLY what provides great trading opportunities. We want to be on the side of market makers as often as possible. When they trigger selling during early morning action, we want to be ready to buy solid stocks at lower prices. When they rally, whether it be over a couple hours, days, weeks, or months, we should be ready to capture our profits and look for other opportunities.
If you're looking at the stock market from an investing perspective, instead of trading, then I favor being long now and holding. Obviously, be prepared for ups and downs as you would during any market, but my research tells me that we're going higher over time and that the cyclical bear market has ended at the mid-June market bottom.
Our Strong AD ChartList (SADCL) features companies that show strong AD lines. Strong AD lines occur when a stock, over time, tends to finish in the upper half of trading ranges. So, one solid trading strategy on this ChartList, is to consider buying stocks that are struggling in the first 60-90 minutes of the trading day, expecting to see recovery to some degree by the end of the day. I traded DBX last week after it reported quarterly results. It's a portfolio stock and is on our Strong AD ChartList. DBX beat both revenue and EPS estimates, but sold off after earnings. Early on Friday morning, I noticed the stock was down nearly 5% and that low coincided with a 20-day EMA test. Look what transpired after that initial move lower:
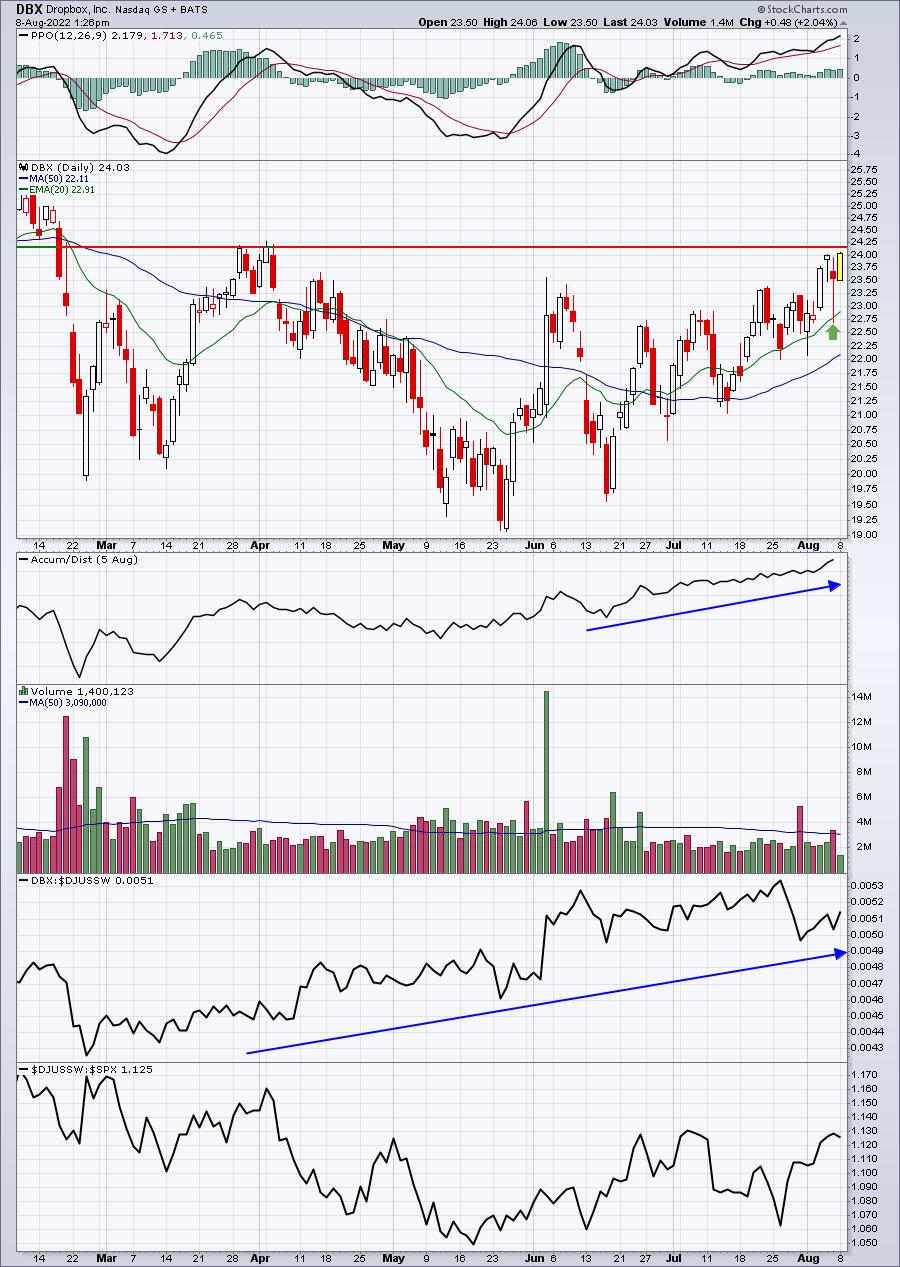
I took the intraday profit on Friday, so I didn't benefit from today's rally at all. But a profit is a profit. I say this all the time - I just want to make money. I try not to be greedy. I assess my risk, take my positions, and let the chips fall where they may.
If this type of strategy is of interest to you, consider this. Run a scan that looks at our SADCL and the upcoming earnings ChartList for whatever day you're looking at. See which stocks are on both ChartLists. Then, just after the opening bell, or maybe even closer to 10am ET, look at the results to your scan in Summary form and see which companies are down in early morning trading. These are potential trade candidates. So for today, here's the scan I would have run in MY StockCharts.com account (you can't use the same syntax that I used, because the ChartLists in your StockCharts.com account will be different numbers. StockCharts cannot recognize my ChartLists in your account):

After running this scan, I got the following results:

First, there weren't many results, because there weren't many companies reporting this morning. The number of results will likely pick up throughout the week. Looking at the three companies above, I'd probably toss both D and KOS as I'm not overly interested in utilities and energy stocks right now. I'm also not a huge fan of consumer staples, either, but I like the group more than utilities and energy.
Here's a 5-day, 10-minute chart of TSN. Check out the early morning weakness and the subsequent recovery:
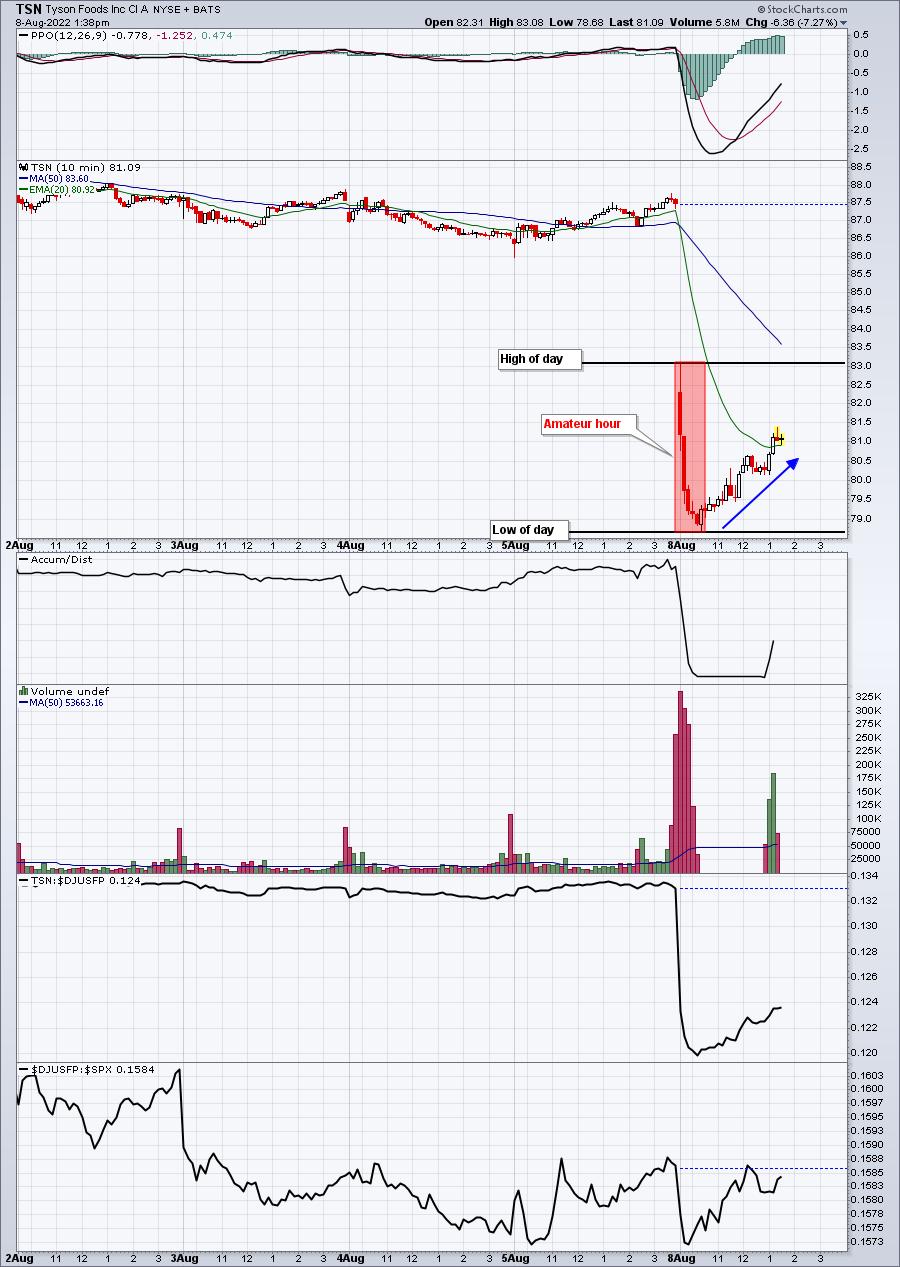
I didn't trade TSN today, but I see this type of intraday behavior over and over and over again. Sometimes, that early morning weakness continues throughout the day, but usually most, if not all, of the weakness is in the morning. By the way, TSN beat consensus estimates as to both revenues and EPS.
Earnings Reports
Here are the key earnings reports for the next two days, featuring stocks with market caps of more than $10 billion. I also include several companies with market caps below $10 billion. Finally, any portfolio stocks that will be reporting results are highlighted in BOLD. If you decide to hold a stock into earnings, please understand the significant short-term risk that you are taking. Please be sure to check for earnings dates for any companies you own or are considering owning.
Monday, August 8:
D, BNTX, AIG, IFF, TSN, GOLD, OKE, PLTR, PFG, TTWO, AZPN, VTRS, DINO, NWSA, ACM, SWCH, AVLR, QLYS, DOCN, TXG, NVAX, TGNA, ICUI, CARG, UPST, TASK, APPS, ENR, LMND
Tuesday, August 9:
EMR, SYY, WELL, TDG, GFS, RBLX, TTD, COIN, WMG, AKAM, PLUG, U, XP, DAR, BSY, OLPX, CLVT, ARMK, MASI, CELH, DLB, WYNN, PLNT, CPRI, RL, IAC, HRB, REYN, SAIL, PRGO, NCLH, HGV, LPX, RRR, ONTO, GO, BE, ZD, WK, ALRM, TTEC, SMCI, ANGI, SAVE, ARRY, EVGO, LRN, BHC, CRCT, NEO, EVBG, CRNC, MGNI
Economic Reports
None
Happy trading!
Tom