
EB Daily Market Report - Tuesday, August 9, 2022
ChartLists Updated
I was able to complete the additions of companies onto our Strong Earnings ChartList (SECL), however, the additions have not been annotated yet. I should have that done by tomorrow and I'll let you know. In the meantime, you can now run scans against the updated ChartList. By adding these charts - even without the annotations - it allowed me to update the Strong Future Earnings ChartList (SFECL) as well. You should be able to view/download these ChartLists from our website very shortly.
Executive Market Summary
- Futures were lower and our major indices gapped down at the opening bell
- Most of the selling, however, was concentrated in the morning session
- Cryptocurrencies are struggling today, with etherium ($ETHUSD) down more than 5%
- Crude oil ($WTIC) is flat on the session after trading higher earlier
- The 10-year treasury yield ($TNX) is up 3 basis points to 2.79%, resting just beneath the 20-day EMA as the July CPI report is to be released (tomorrow morning 8:30am ET)
- Energy (XLE, +1.72%) and utilities (XLU,+1.25%) are leading today's action, while consumer discretionary (XLY, -1.70%) is showing relative weakness
- Recreational services ($DJUSRQ, -5.07%) is the weakest part of discretionary today
- Norwegian Cruise Line Holdings (NCLH, -11.42%) is the worst-performing stock on the S&P 500, contributing to the weakness in the DJUSRQ
Market Outlook
From what I recall, inflation numbers are based upon the change in crude oil prices from the 12th of one month to the 12th of the next. So for July 2022, that would be change from June 12th to July 12th. Here's a short-term chart, showing approximately how much crude oil fell during that period:
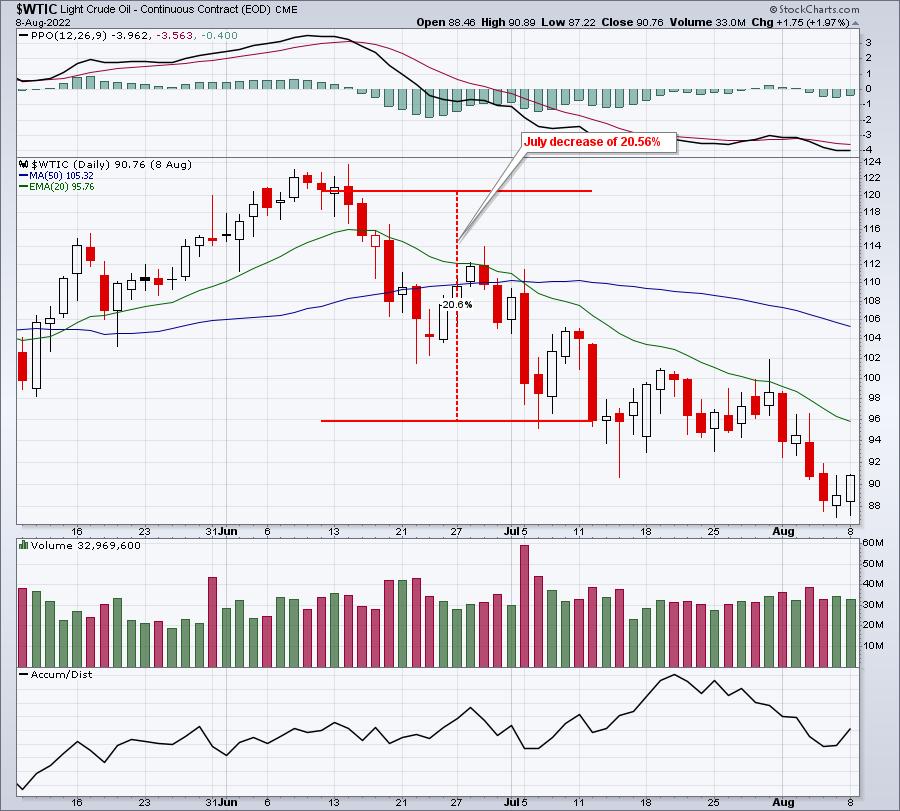
Has a drop of this magnitude been built into estimates and assumptions? How will the stock market react if CPI and/or PPI headline numbers are negative? Stay tuned for the answer over the next two trading days.
Sector/Industry Focus
The 10-year treasury yield ($TNX) is right up against its declining 20-day EMA, as we prepare for our next round of key inflationary reports. The July CPI will be released tomorrow morning at 8:30am ET, while the July PPI will be released Thursday morning at 8:30am ET. I'm expecting the headline number for both of these reports to come in well below expectations. Here are the current expectations:
- July CPI (headline): +0.2%
- July Core CPI: +0.5%
- July PPI (headline): +0.3%
- July Core PPI: +0.4%
The market is already looking for the headline numbers to come down quite a bit, but I think they could be negative. Our major indices will likely need a catalyst in order to break above key price resistance (think 4176 on the S&P 500). Lower-than-expected inflation could do the trick. We'll soon find out. If it doesn't, then the chances for further consolidation and selling increase, in my opinion.
ChartLists/Strategies
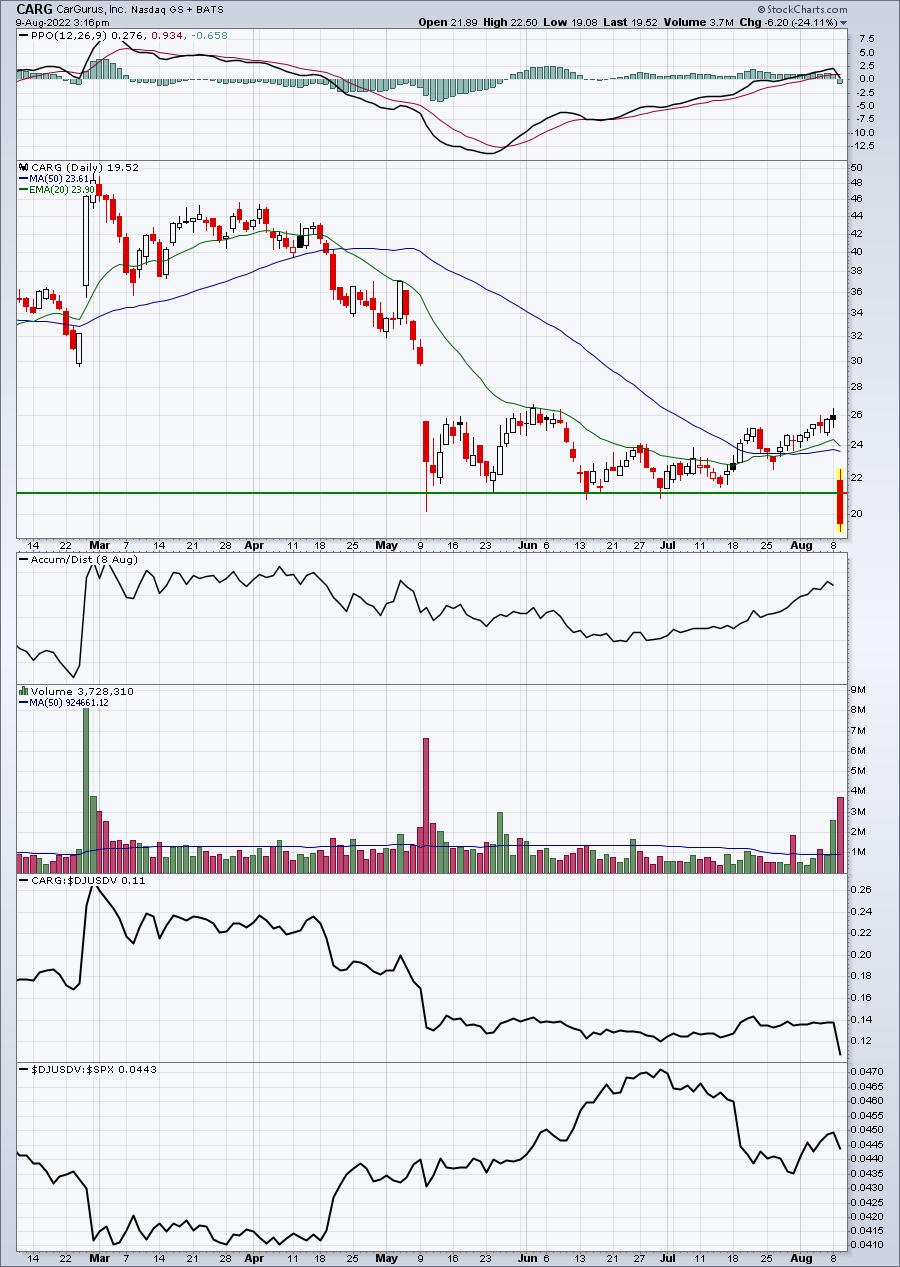
I placed a couple trades today, so thought I'd lay them out here for review. The first was a long trade on CARG, banking on a reversal to hold key closing price support at 21.20. While it gapped significantly lower, it opened at 21.89, which was above that key closing support. Many times I've found that to be a decent indicator that the close will also finish above support. So early in the day, CARG fell to 19.44 and started to rally after printing a doji on the 10-minute chart. I bought about 1.5% off the low and set my intraday stop beneath 19.44 as I didn't want to get caught in a huge drop with a possible breakdown. My stop triggered this afternoon and I took a small loss. It may still hold 21.20 support, but it's got some work to do:
Another trade that I placed that's working out so far is ON, one of our portfolio stocks. I liked the selling this morning down to the 20-day EMA. I bought almost squarely on it, expecting a rally given the strong AD line and its excellent relative strength:
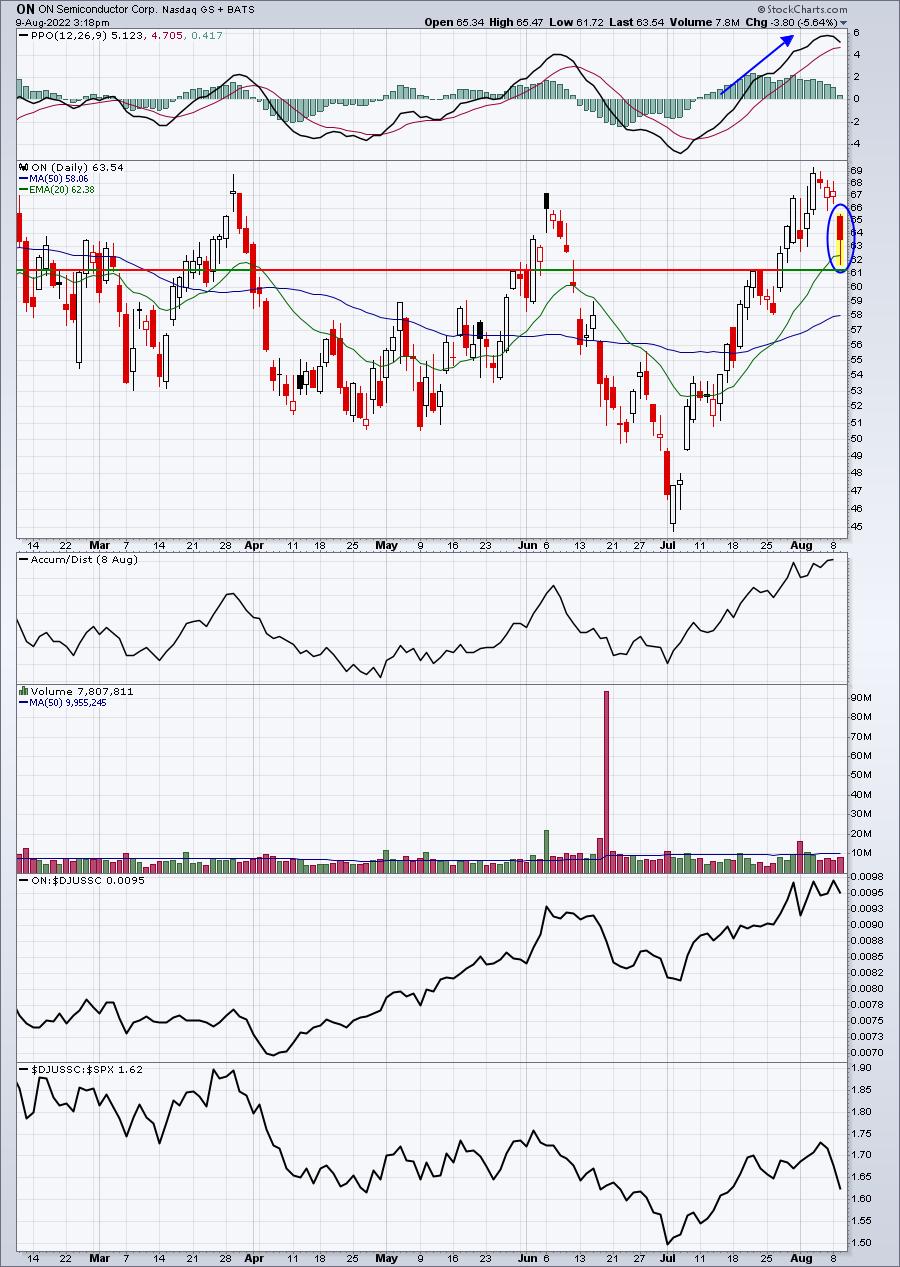
In an uptrending market, this is quite typical of the trades I look for. ON is a very healthy stock whose PPO was very strong at the most recent price high. These types of stocks typically bounce off 20-day EMA tests, and so that's what I'm looking for here. So far, so good.
Earnings Reports
Here are the key earnings reports for the next two days, featuring stocks with market caps of more than $10 billion. I also include several companies with market caps below $10 billion. Finally, any portfolio stocks that will be reporting results are highlighted in BOLD. If you decide to hold a stock into earnings, please understand the significant short-term risk that you are taking. Please be sure to check for earnings dates for any companies you own or are considering owning.
Tuesday, August 9:
EMR, SYY, WELL, TDG, GFS, RBLX, TTD, COIN, WMG, AKAM, PLUG, U, XP, DAR, BSY, OLPX, CLVT, ARMK, MASI, CELH, DLB, WYNN, PLNT, CPRI, RL, IAC, HRB, REYN, SAIL, PRGO, NCLH, HGV, LPX, RRR, ONTO, GO, BE, ZD, WK, ALRM, TTEC, SMCI, ANGI, SAVE, ARRY, EVGO, LRN, BHC, CRCT, NEO, EVBG, CRNC, MGNI
Wednesday, August 10:
DIS, MFC, CPNG, FNV, FOXA, FOX, APP, CAE, CACI, MQ, CYBR, BMBL, AVT, WEN, STAA, NOMD, SONO, BLDP, JACK, AOSL, RSKD
Economic Reports
Q2 productivity: -4.6% (actual) vs. -4.5% (estimate)
Happy trading!
Tom