
EB Daily Market Report - Wednesday, August 10, 2022
Executive Market Summary
- Futures were higher, but then really took off after the July CPI came in below expectations
- The 10-year treasury yield ($TNX) also tumbled as money initially poured into both the bond and stock market
- Cryptocurrencies are also soaring as bitcoin ($BTCUSD) surges nearly 1000 points and etherium ($ETHUSD) jumps more than 9%
- Crude oil ($WTIC, -0.52%) is subdued, as are most commodities
- While several commodities are marginally higher, materials (XLB, +2.94%) are actually leading today's action
- The other aggressive sectors, including communication services (XLC, +2.87%), are also doing quite well
- All 11 sectors are higher, but utilities (XLU, +0.25%) and energy (XLE, +0.51%) are lagging badly
- The discretionary (XLY, +2.72%) vs. staples (XLP, +0.74%) ratio has been strong since the opening bell
- Recreational services ($DJUSRQ, +6.70%), one of yesterday's worst industries, is soaring today as cruise lines like NCLH, CCL, and RCL take the top 3 spots on the S&P 500 leaderboard
- Trade Desk (TTD, +34.77%) is soaring after reporting its latest quarterly earnings report - despite coming up a penny short on its EPS
Market Outlook
Well, the first inflation report for July is in the books and we saw pretty much what I expected. Both headline CPI and Core CPI came in 0.2% below expectations. The initial reaction has been one of buying BOTH bonds and stocks. More and more money is coming off the sidelines and we're seeing it move into both markets. Here's a short-term 5-day, 10-minute chart to illustrate this:
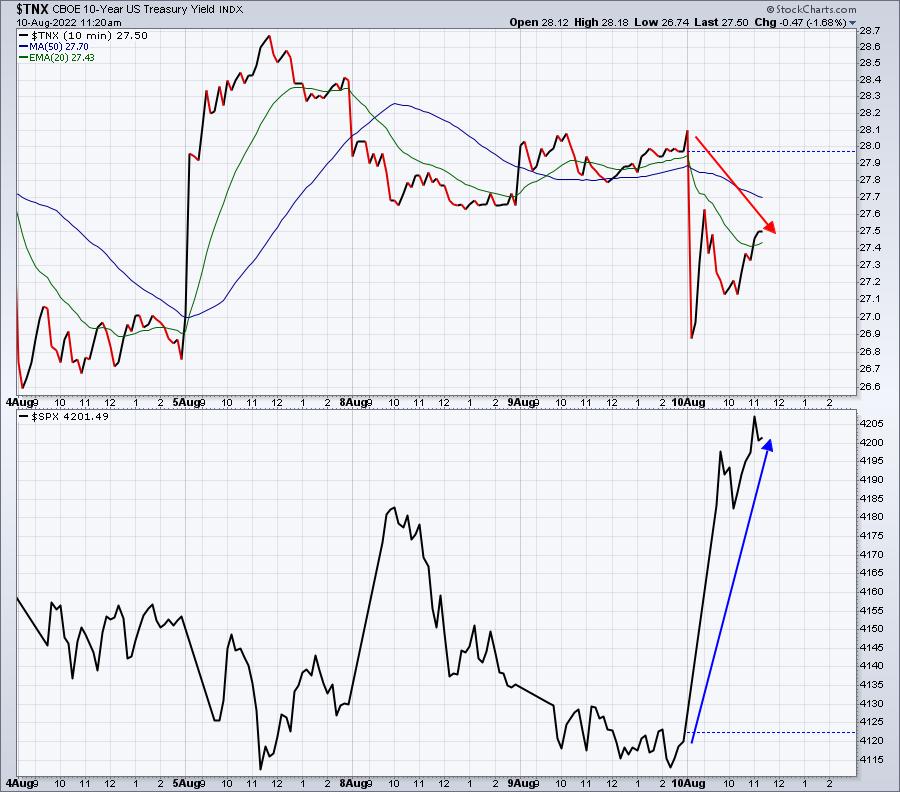
Keep in mind that treasury yields move opposite treasury prices. So the move lower in the TNX means that bond prices are up. This is just a couple hours reaction and we still have another key inflation report - July PPI - due out at 8:30am ET on Thursday. I expect the headline number here could be a real shocker to the downside given the huge decrease in crude oil prices ($WTIC) over the measurement period (June 12th to July 12th).
Sector/Industry Focus
It's always great to get positive news and I definitely view the July CPI as a very bullish report. But it always comes down to the reaction to the report. For that, I like to follow my sustainability ratios. Here's another 5-day, 10-minute chart, this time focusing on how those ratios are performing INTRADAY vs. the benchmark S&P 500:
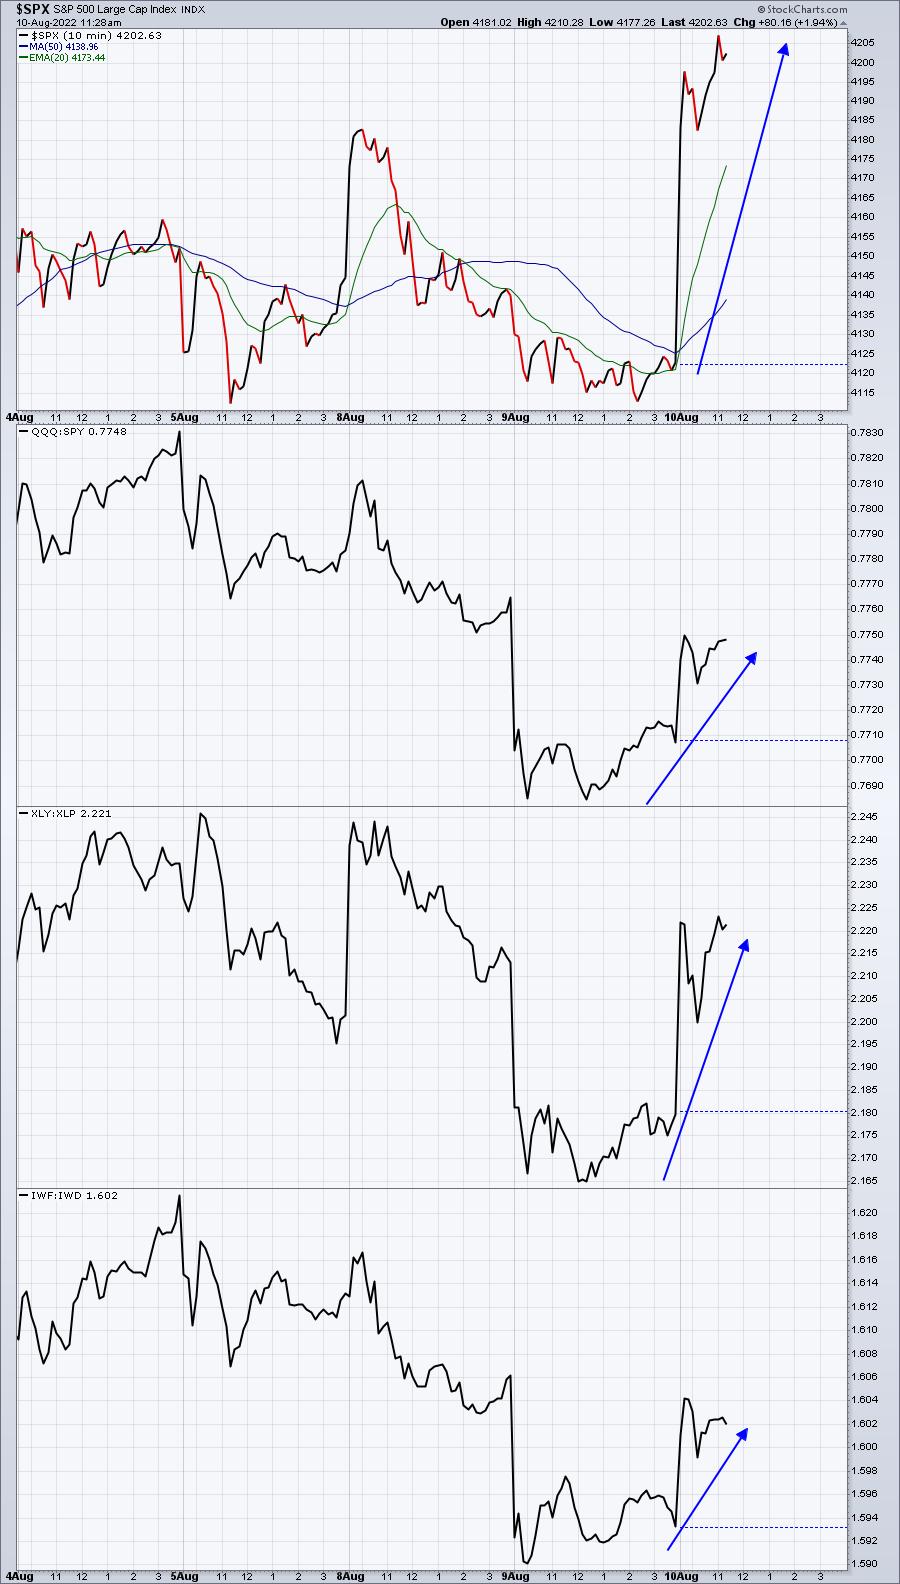
I can look at this chart and talk about the positive, which is that the S&P 500 is breaking out and our ratios are all moving up with it. Or I can look at the S&P 500's breakout NOT being confirmed by new highs in the ratios. I really try to avoid the minutia and focus on the big picture, which is one of absolute confirmation by these ratios. This short-term lack of breakout would keep me from being overly aggressive and trading leveraged ETFs, but I have no problems whatsoever being long. I'm continuing to look for long trade candidates and I own the QQQ. Aggressive traders can own the QLD, which tracks the NASDAQ 100 at a 2 to 1 clip, but just understand the risks are a bit elevated until we see breakouts on the sustainability ratios as well.
ChartLists/Strategies
Here are two more trades I've made this morning - again, just to give you examples of what I look for:
LRN:
LRN crushed both revenue and EPS estimates, but it was a "buy on the rumor, sell on the news" candidate and SELL IT DID! I think the selling is an opportunity, so I watched this morning until price stabilized a bit, then entered. I have an intraday stop beneath today's low, but I'm hoping we'll see the type of reversal we saw with MEDP recently. Here's the current chart of LRN:
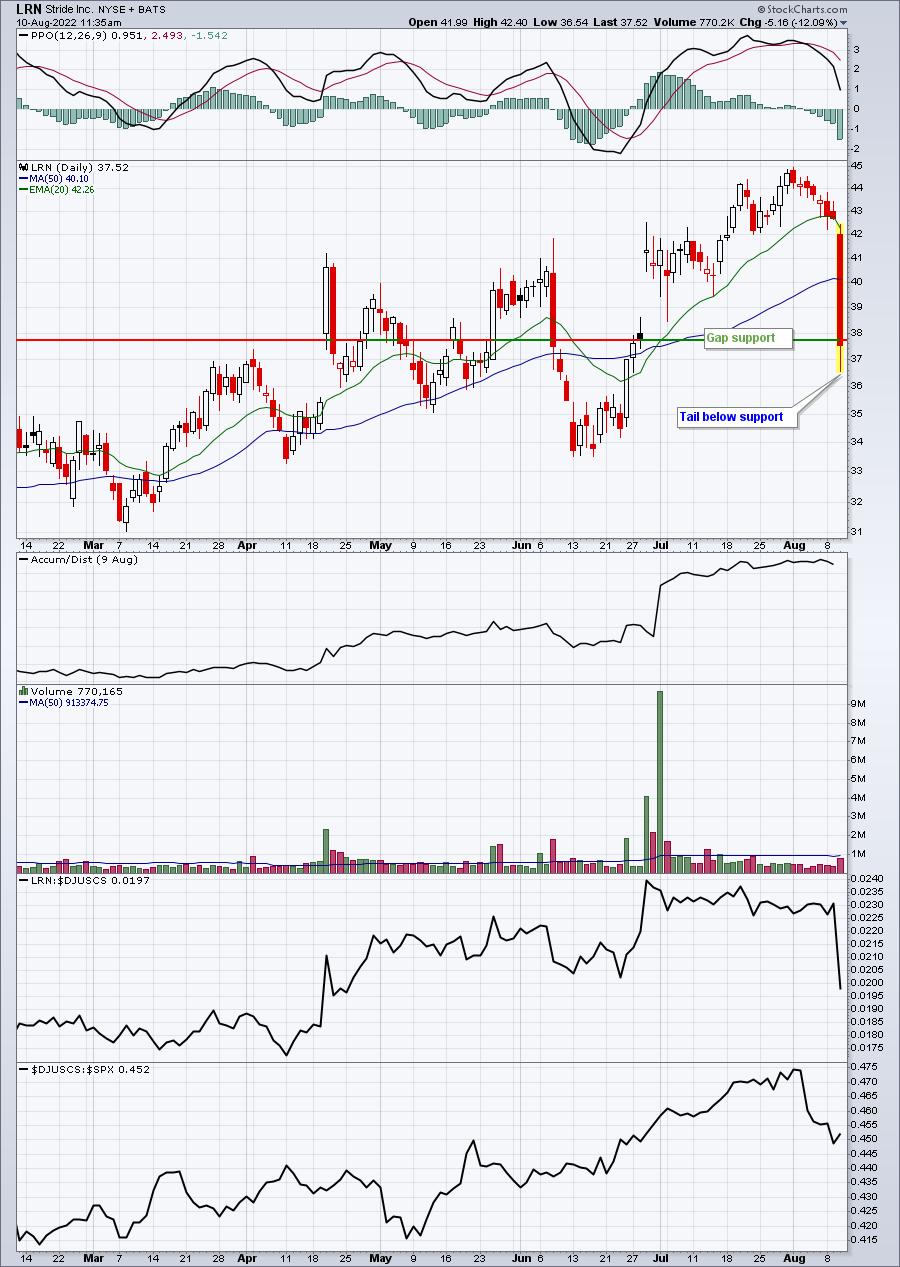
This has the potential to be a 10-12% winner in a hurry. But I also might get stopped out by the time you read this. My risk is defined and I've seen enough of these types of setups that I'm comfortable with that risk relative to my potential reward. Also, the risk can be managed by position size. 100 shares = $100 risk. 200 shares = $200 risk. And so on.
PDD:
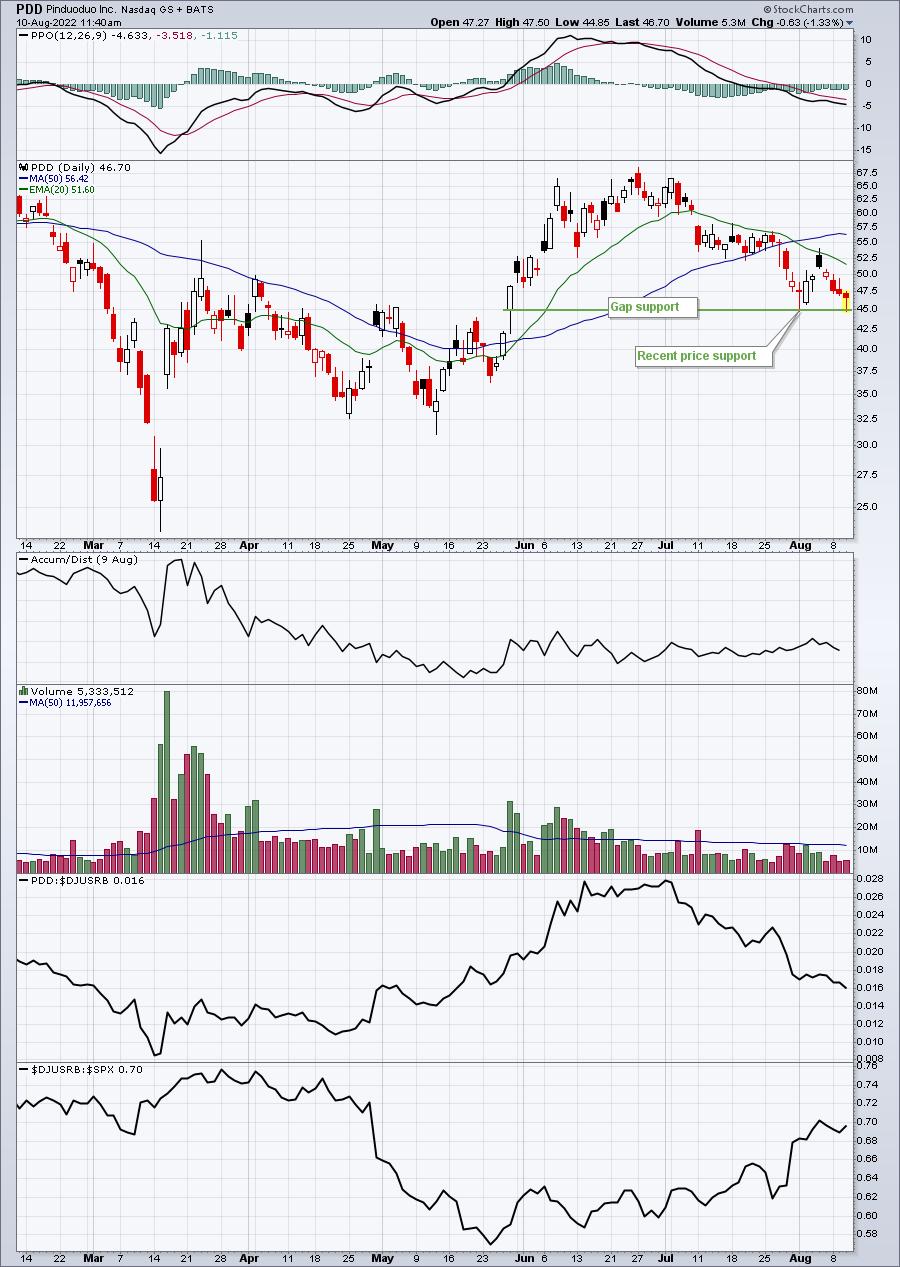
This was an annotated chart in our Strong Earnings ChartList (SECL). PDD hit key price/gap support this morning and I bought with the idea that a bounce would occur from here. If it doesn't and sells off this afternoon, I'll exit. Otherwise, I'm looking for a trip back to the 51-52 area:
Earnings Reports
Here are the key earnings reports for the next two days, featuring stocks with market caps of more than $10 billion. I also include several companies with market caps below $10 billion. Finally, any portfolio stocks that will be reporting results are highlighted in BOLD. If you decide to hold a stock into earnings, please understand the significant short-term risk that you are taking. Please be sure to check for earnings dates for any companies you own or are considering owning.
Wednesday, August 10:
DIS, MFC, CPNG, FNV, FOXA, FOX, APP, CAE, CACI, MQ, CYBR, BMBL, AVT, WEN, STAA, NOMD, SONO, BLDP, JACK, AOSL, RSKD
Thursday, August 11:
BAM, ILMN, RMD, RIVN, EDR, CAH, WPM, RYAN, AER, FLO, HBI, VET, VIAV, UTZ, GLNG, GOOS, SIX, SWIR
Economic Reports
July CPI: +0.0% (actual) vs. +0.2% (estimate)
July Core CPI: +0.3% (actual) vs. +0.5% (estimate)
Happy trading!
Tom