
EB Daily Market Report - Monday, August 15, 2022
ChartLists Updated
I spent a lot of time over the weekend updating nearly every ChartList that we have. These ChartLists were updated over the weekend:
- Strong Earnings ChartList (SECL)
- Strong Future Earnings ChartList (SFECL)
- Raised Guidance ChartList (RGCL)
- Short Squeeze ChartList (SSCL)
- All Upcoming Earnings ChartLists
- Upcoming Earnings - Relative Strength ChartList
All of these ChartLists were posted to our website and are available for viewing/downloading. Today, I updated two more ChartLists:
- Strong AD ChartList (SADCL)
- Bullish Trifecta ChartList (BTCL)
These two ChartLists should also be updated on our website. If they haven't, they will be by the end of the day. I wanted to make sure all of our ChartLists were current as we headed into the "draft" after the closing bell this Thursday.
Max Pain
Erin Webber updated max pain for a large number of companies over the weekend and sent out a report last night. This information is VITAL for short-term traders, not so much those holding for the long-term. She did the max pain calculations for ALL 50 of our portfolio stocks, the 30 Dow Jones stocks, and the 100 NASDAQ 100 stocks. The report lists these companies in order of highest net in-the-money call premium (I'd expect market makers to have financial incentive to manipulate prices lower) to highest net in-the-money put premium (I'd expect market makers to have financial incentive to manipulate prices higher).
You'll notice that the SPY and QQQ, along with most individual stocks, show a tremendous amount of net in-the-money call premium as a result of the steadily rising stock market off the June market bottom. These calculations guarantee us NOTHING. I use them as directional clues, no different than signals provided by the PPO, AD lines, RSI, seasonality, etc. Historically, we know that the calendar dates during options expiration and into the week following options expiration have had bearish tendencies, so simply keep all of this in mind - if you're a short-term trader.
And as a reminder, our August Max Pain webinar will be held tomorrow afternoon at 4:30pm ET. I'll provide you an update at that time.
Executive Market Summary
- Futures were lower overnight and our major indices did gap lower at the opening bell
- The action quickly turned bullish and there's been a bid under the market throughout the session - similar to Friday's action
- Small cap ($SML, -0.04%) and mid cap ($MID, -0.09%) have lagged a bit, but also remain in uptrends
- There remains significant bullish rotation, despite my sustainability ratios not completely supporting this latest advance - more on this below
Market Outlook
Earlier in 2022, when key sustainability ratios fell, the entire market sold off hard. That's no longer the case. As the S&P 500 moves up over the past couple weeks, it's left these ratios in the dust, but this time the overall market isn't selling off. Instead, areas that haven't been keeping up with the S&P 500 are having their turn to shine. That's secular bull market behavior. Let me show you the latest with these ratios:
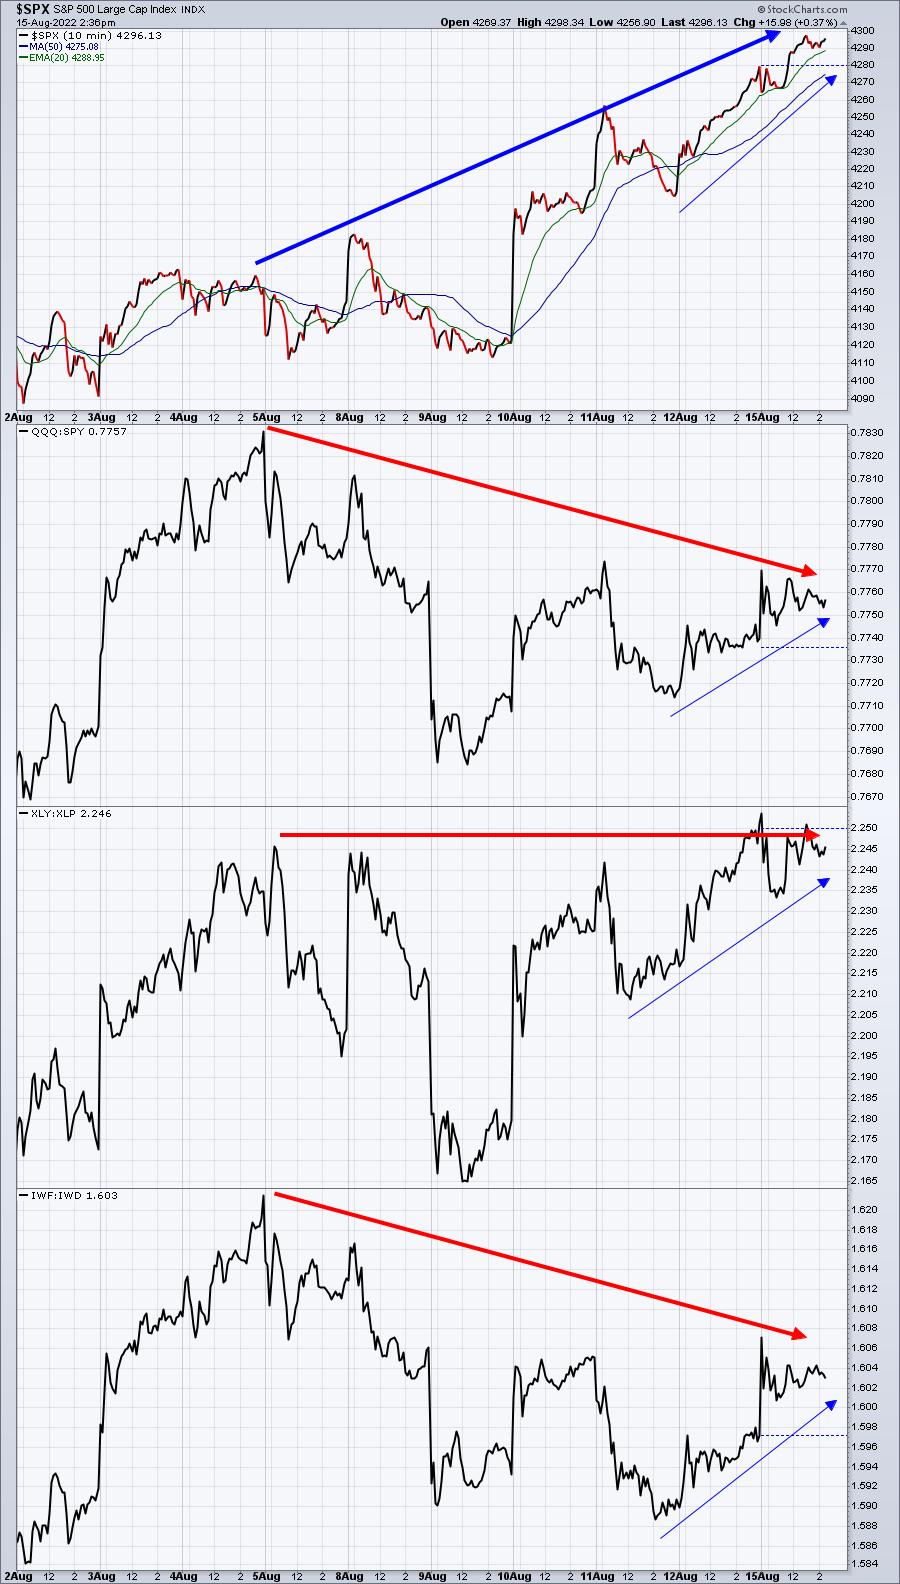
The thin blue directional lines show that my key sustainability ratios are rising along with the S&P 500 over the past 2-3 days. However, the big push higher in the S&P 500 over the past two weeks is NOT seeing support from key areas as these ratios are not breaking out. In the past, this has led to a very weak stock market as the cyclical bear market gained steam. But that's no longer the case as money is finding a home in other areas.
Looking at a candlestick chart, I'd follow the current trend higher in the SPY, unless this trendline breaks:
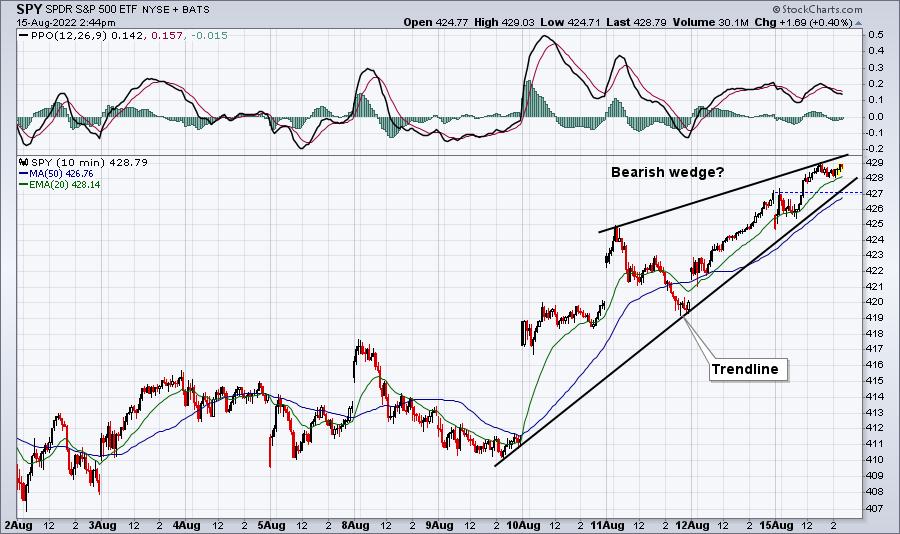
The breaking of the trendline would be more bearish to me, because of (a) the breakdown of a bearish wedge, and (2) the fact that we have many other warning signs, including the potential impact of max pain being so much lower than current price.
Sector/Industry Focus
What could trigger a bit of selling? Well, as I look at the economic calendar for this week, July retail sales kinda stand out and they'll be released on Wednesday morning. Consensus estimates expect retail sales to be primarily flat for July. An actual number that veers too far from this flat expectation could trigger fears - either a weak report that triggers further recessionary concerns OR a strong report that could ignite the inflation fire temporarily. The widely-diversified retail ETF is the XRT and here's the current technical outlook:
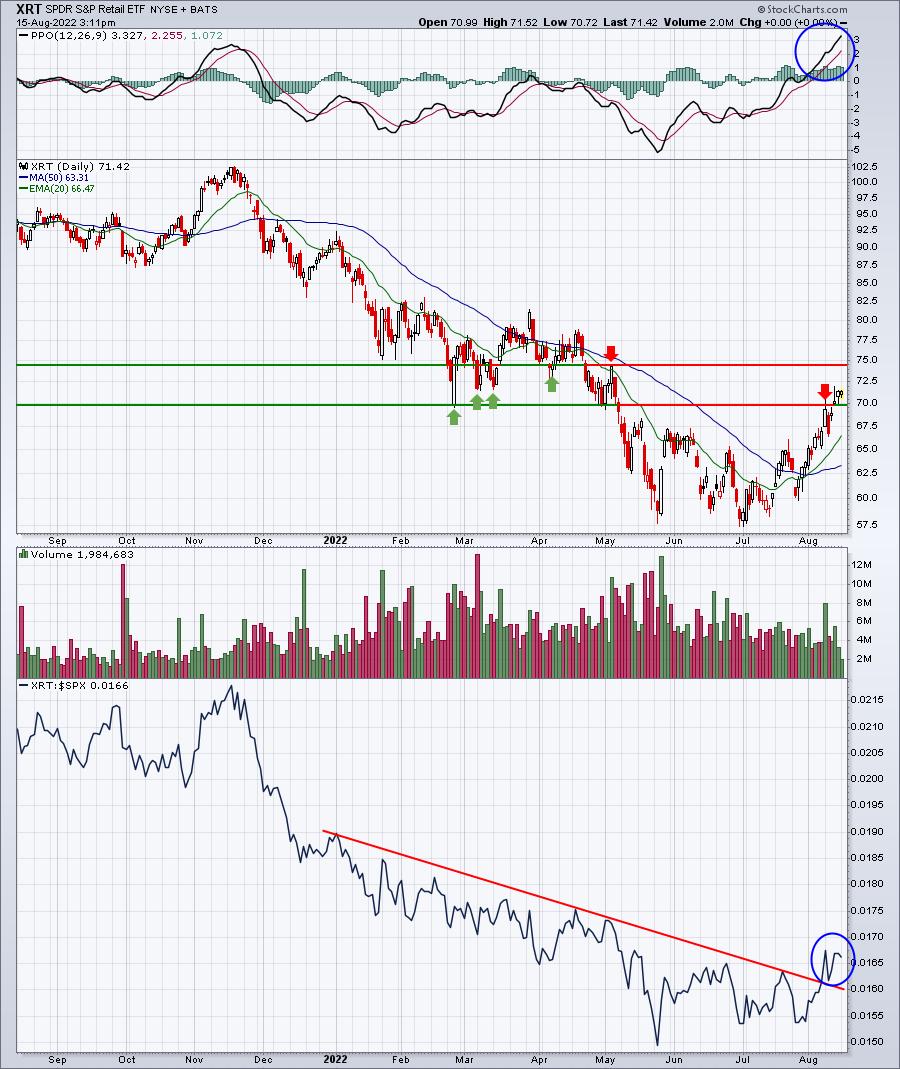
The XRT has definitely improved over the past 2-3 months, breaking its relative downtrend and seeing its PPO soar above centerline resistance. Momentum is now bullish. However, retail remains one of the weaker areas of the market and with a big report due out on Wednesday, perhaps THIS is the report that will help the bears regain control of the action - even if only temporarily? This is pure speculation. Again, as I mentioned above, I'd be careful being too aggressive on the short side until the bearish wedge breaks and a short-term downtrend begins.
ChartLists/Strategies
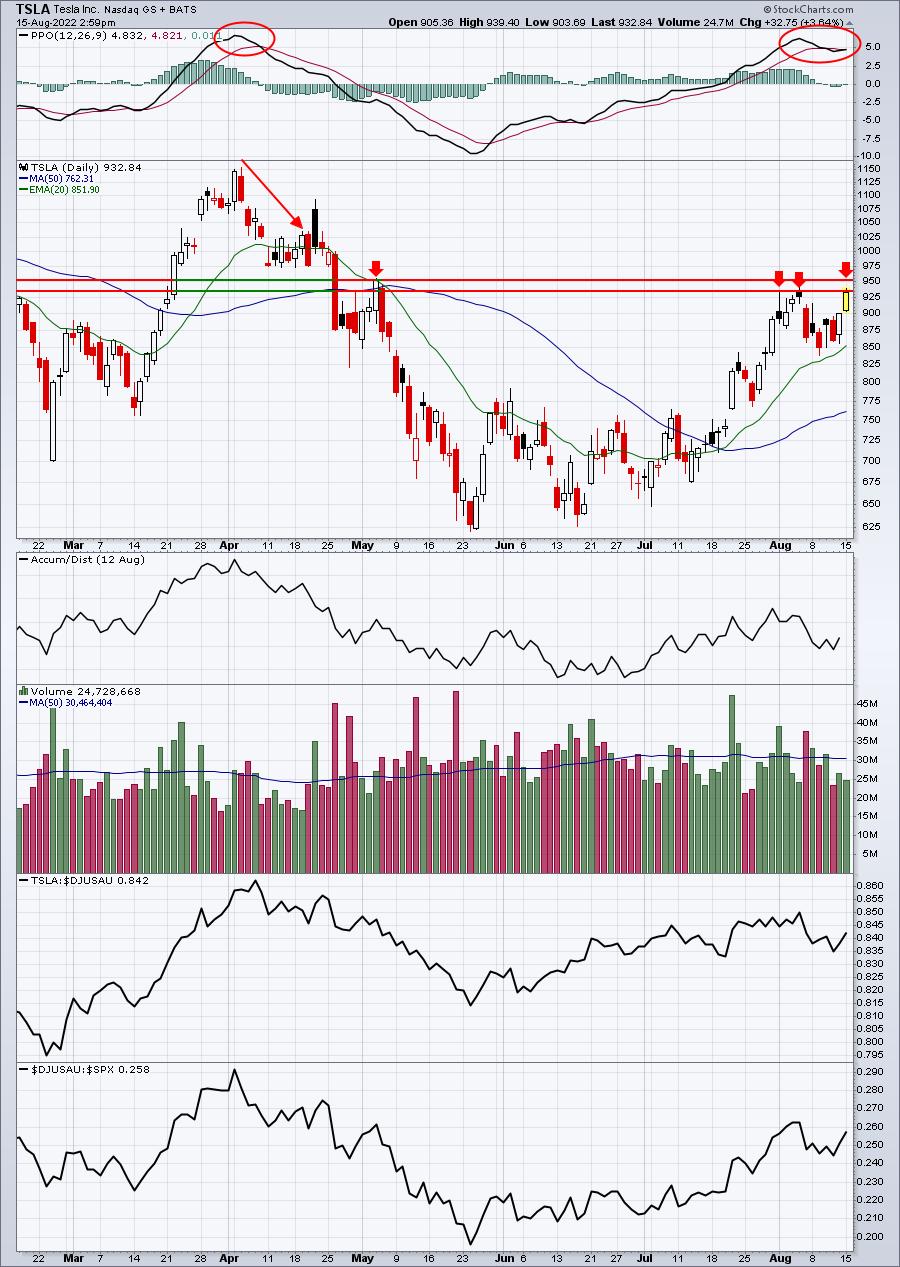
Looking at the list of max pain short candidates (stocks with lots of net in-the-money call premium), here are a few I'd be very, very careful of if I owned them on the long side. Again, I'm discussing this from a SHORT-TERM TRADER's perspective, not as a long-term investment. Check out these two stocks:
TSLA:
ENPH:
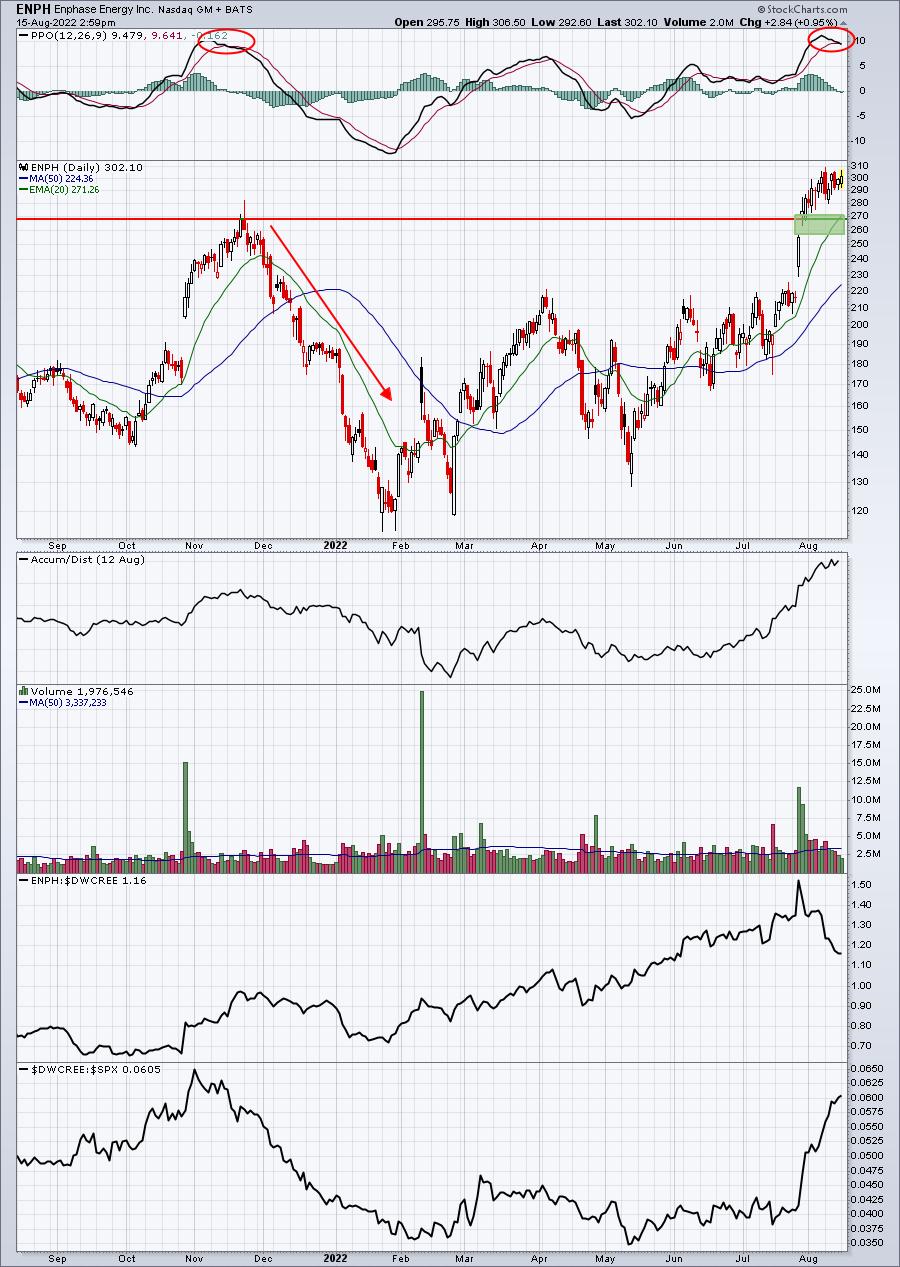
I love both of these stocks for the long-term, but I don't trust either of them short-term. There is nearly $1 billion of net in-the-money call premium on TSLA and its max pain is 813, roughly 15% below current price. TSLA is up another 30 bucks today and is approaching key price resistance in the 940-950 zone. TSLA and ENPH are both seeing their PPOs begin to weaken, so don't be surprised if selling begins rather abruptly at some point this week. ENPH saw its PPO roll over back in November and that was the beginning of a lengthy downtrend. While I don't expect anything of that magnitude, it wouldn't surprise me to see an upcoming 20-day EMA test. Max pain on ENPH is close to 25% below its current price.
I'm not saying that these two stocks cannot move higher. Secular bull market advances can be ruthless, not allowing bears to find entry. But the key is that RISK is extremely high, given the options environment this week.
Earnings Reports
Here are the key earnings reports for the next two days, featuring stocks with market caps of more than $10 billion. I also include several companies with market caps below $10 billion. Finally, any portfolio stocks that will be reporting results are highlighted in BOLD. If you decide to hold a stock into earnings, please understand the significant short-term risk that you are taking. Please be sure to check for earnings dates for any companies you own or are considering owning.
Monday, August 15:
LI, WEBR
Tuesday, August 16:
WMT, HD, SE, A, JKHY, ONON, LITE, PINC
Economic Reports
August empire state manufacturing index: -31.3 (actual) vs. +5.0 (estimate)
August housing market index: 49 (actual) vs. 55 (estimate)
Happy trading!
Tom