
EB Daily Market Report - Tuesday, August 16, 2022
Max Pain Event
At 4:30pm ET, we'll review August max pain as monthly options expire in just 3 days. It should be a VERY timely event, given the HUGE amount of net in-the-money call premium on the table for market makers. I'd expect some sort of selling event within the next week with so much money on the table, but I guess we'll see.
The event will be recorded in the event you cannot join me live.
Executive Market Summary
- Futures were slightly lower and we did see a bit of morning weakness across our major indices
- After that, however, it was business as usual as the bulls dominated throughout much of the session
- As I am writing this, we're seeing a bit of afternoon selling with the NASDAQ turning red
- A weak finish could lead to further selling ahead, especially given the options environment
- Crude oil ($WTIC, -3.55%) is down to $86 per barrel, as energy (XLE, -0.45%) retreats
- Technology (XLK, -0.72%) is the worst-performing sector today, while consumer stocks are strongest
- Consumer staples (XLP, +0.98%) and consumer discretionary (XLY, +0.96%) are the clear leaders
- The 10-year treasury yield ($TNX) is up 4 basis points as the back-and-forth action continues in the bond market; today's rise in yields accompanies mixed economic data
- Walmart (WMT, +5.41%) reported better-than-expected results and is leading the Dow Jones higher
Market Outlook
The stock market action that we've seen the past week or two helps to explain why long-term investors should not try to time the markets' ups and downs. There are a handful of reasons why this bull market should stop and pause and yet it's having none of it. We had 60-minute negative divergences. We have overbought conditions. It's max pain week and nearly every stock of any significance (in terms of market cap) has deep net in-the-money call premium. A few of my key sustainability ratios are not keeping up with the S&P 500 gains. Sentiment is now the most bullish since much earlier in the year. The list goes on and on.
But still here we are, with another solid market day at hand. Rallies off of major market bottoms tend to wait for NO ONE. Those that have remained completely on the sidelines, or worse yet, continue to short, are now coming up with every excuse on the planet why the stock market shouldn't move higher. They've missed the boat and their preconceived biases won't allow them to believe we're in the next phase of the secular bull market. It was painful on the way down and now it's doubly painful on the way back up.
Sentiment - in the form of the 5-day moving average of the equity-only put call ratio ($CPCE) - has reached its most bullish level since the March market rally. When we get a confirmed bottom there, then the probability of a more defined selloff would increase. Check this out:
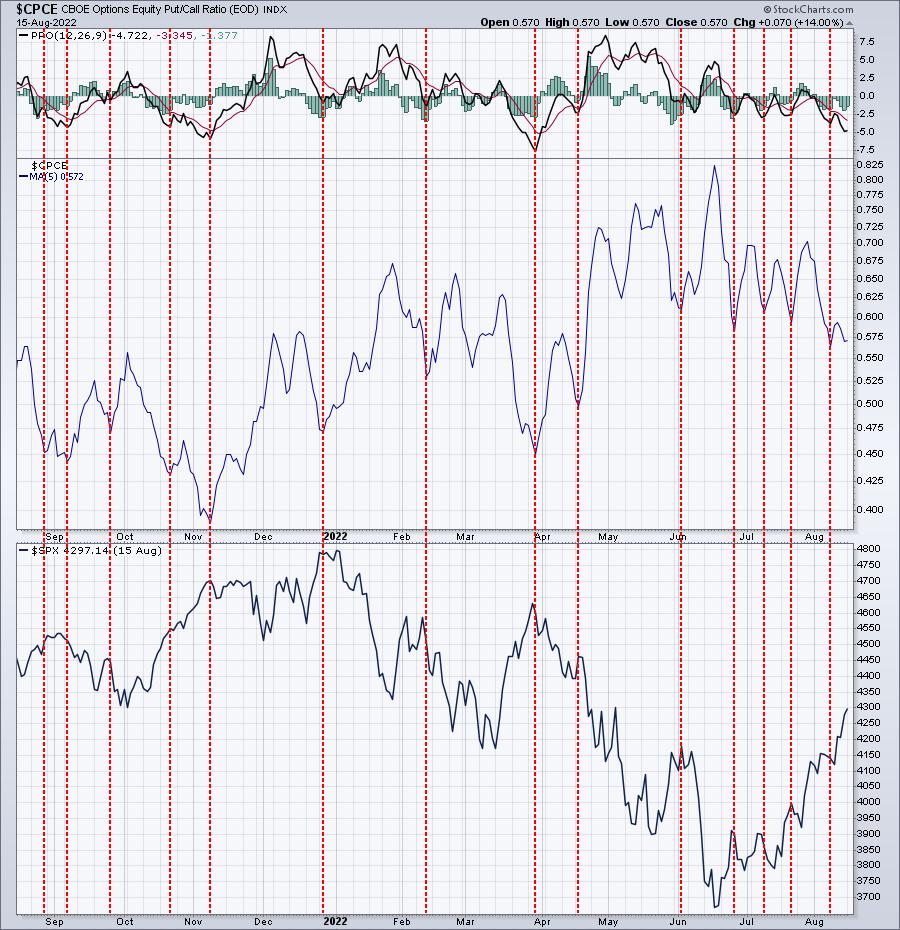
The red-dotted vertical lines mark periods where the 5-day moving average of the CPCE bottomed AND the PPO was below 0. I count 14 times over the past year. I also count 9 times where this signal marked a fairly significant short-term top in the S&P 500. 3 signals saw mostly sideways action in the S&P 500, while only 2 of these 14 signals failed badly. The first bad signal occurred in October 2021, when the S&P 500 ignored the warning and cruised another 3-4% higher. The second bad signal just occurred during this market rally in August. However, this is a short-term sentiment signal that is at least worth paying attention to as its history of predicting a short-term market decline is fairly solid. Given that this is options expiration week makes it even more important, in my view. If the current rally can spur just a bit more optimism and resulting complacency, perhaps we'll get a much-needed pullback. But it is SO hard to bet against a secular bull market advance.
There is one technical positive, however, if you're hoping for a pullback. The intraday trendline that I featured (yesterday?) on the S&P 500 was lost with the morning's weakness. So closing at or near today's lows should be viewed as short-term bearish.
Sector/Industry Focus
Yesterday, the housing market index came in way below expectations (49 actual vs. 55 estimate) and today housing starts fell abysmally shy of expectations - 1.45 mil units (actual) vs. 1.54 mil units (estimate). Yet the Dow Jones U.S. Home Construction Index ($DJUSHB) is 30% above its June low and continues to trend above its 20-day EMA and 20-week EMA. What gives? Well, you have to understand how the stock market works. The DJUSHB was near 1750 at the end of 2021. It fell over 40% to that mid-June low, which crept slightly beneath 1000. Wall Street priced in the weakness in housing that we're now seeing - ahead of time. The stock market ALWAYS looks ahead. Currently, Wall Street believes the weakness in housing is temporary and the group is now trending higher in anticipation of better news down the road.
On the weekly chart, the DJUSHB shows a false breakdown at that June low and now the group is trading back above its 20-week EMA:
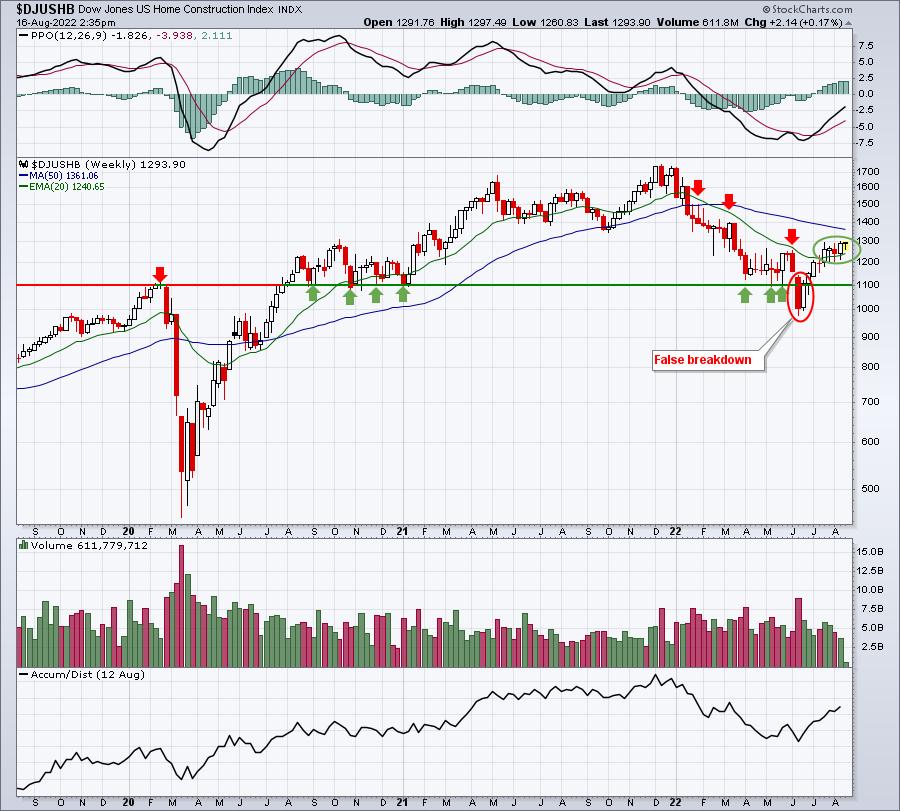
Even areas with seemingly awful news are now trending higher in bullish fashion.
ChartLists/Strategies
I'm as bullish as they come, and I'm sure many of you realize that. But, in good conscience, I cannot add to trading positions ahead of options expiration Friday. I've seen the other side, where long positions are crushed in a moment's notice. As I look ahead to the balance of the week, earnings reports are rather slow - though there will be a few big companies reporting including Cisco Systems (CSCO), Lowe's Companies (LOW), and Applied Materials (AMAT) - though I wouldn't expect any earth-shattering developments from these companies to take the entire stock market lower. In terms of economic reports, the one report that could surprise would be July retail sales, which will be out in the morning at 8:30am ET.
I'm thinking we've moved into a "good news is good news and bad news is good news" environment, so I'm not really sure what might trigger a big selloff - a big miss or a big beat. My "guess" would be that if retail sales are stronger than expected, it could rekindle short-term inflationary concerns and send the treasury yields higher. Would that be enough to spook the stock market for a few days to a week? I'm not sure.
Anyhow, at this time, because of all the uncertainty with options expiration on Friday, I'm going to refrain from suggesting any additional short-term trades. I'll discuss potential max-pain-related trades at our webinar this afternoon. I hope you can join me.
Earnings Reports
Here are the key earnings reports for the next two days, featuring stocks with market caps of more than $10 billion. I also include several companies with market caps below $10 billion. Finally, any portfolio stocks that will be reporting results are highlighted in BOLD. If you decide to hold a stock into earnings, please understand the significant short-term risk that you are taking. Please be sure to check for earnings dates for any companies you own or are considering owning.
Tuesday, August 16:
WMT, HD, SE, A, JKHY, ONON, LITE, PINC
Wednesday, August 17:
CSCO, LOW, ADI, TGT, TJX, SNPS, KEYS, AMCR, ZTO, WOLF, BBWI, PFGC, DNUT
Economic Reports
July housing starts: 1,446,000 (actual) vs. 1,540,000 (estimate)
July building permits: 1,674,000 (actual) vs. 1,650,000 (estimate)
July industrial production: +0.6% (actual) vs. +0.3% (estimate)
July capacity utilization: 80.3% (actual) vs. 80.1% (estimate)
Happy trading!
Tom