
EB Daily Market Report - Monday, August 22, 2022
Weekly Portfolio Report
This report continues to be delayed as I had a family emergency this morning. All is good now, but it was a distraction earlier in the day. I am still planning to publish it later today.
Executive Market Summary
- Futures were very weak overnight and we saw sizable gaps lower at the opening bell
- Today is the Monday after options-expiration Friday and has been the WORST trading day of the month since 1950
- Risk-on assets have been under pressure with most key cryptocurrencies lower
- Crude oil ($WTIC, -0.11%) is flat near $90 per barrel, but energy (XLE, -0.24%) is today's best-performing sector
- All 11 sectors are lower, led by communication services (XLC, -2.89%), technology (XLK, -2.73%), and consumer discretionary (XLY, -2.72%)
- Semiconductors ($DJUSSC, -3.81%) remain weak, pressuring technology stocks
- Intel (INTC, -4.31%) is breaking to another 5-year low and is the worst-performing Dow component stock
- All 30 Dow component stocks are lower on the session
Market Outlook
The streak of weak opens continued this morning, which, quite honestly, was no shocker. Personally, I've begun to use this weakness to accumulate a position in the QQQ once again. I do believe there's a chance we see the max pain level reached on SPY (402.81) and QQQ (306.89), but let's keep in mind those calculations were made on Tuesday. By the end of the week, those max pain levels should have risen at least a few bucks. So today's price level could be nearing the actual max pain by Friday's close. In any event, I think the selling is temporary, so I'm comfortable building a position in the NASDAQ 100 ETF.
Here's a 3-month hourly chart of the QQQ, with a few thoughts about possible support levels based on price, gaps, channels, etc:
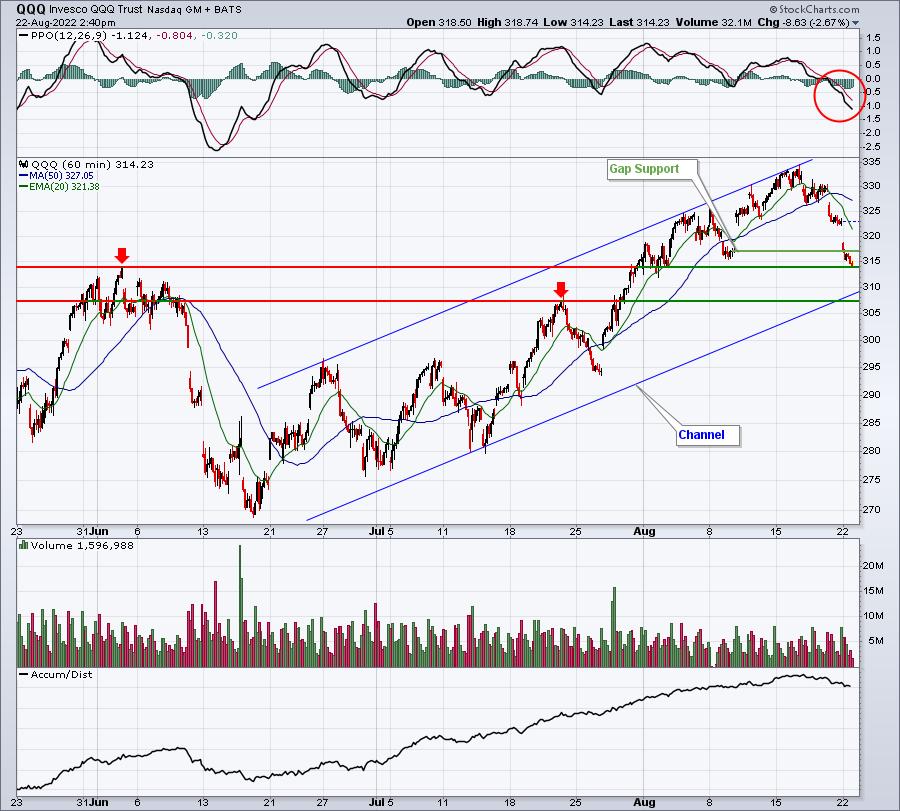
If we use the key highs over the past month to establish a top channel line, then drag that same sloped line down to connect the July low, you'll see that the current price point to intersect the lower channel line is roughly 309. I would definitely be watching this area if today's selling continues into the close and/or tomorrow's open. Next up are the two price support/resistance horizontal lines that run across at 314.00 and 307.50, respectively. There's also gap support just above 317. We opened above that 317 level today, so a big rally late this afternoon would likely print a bottom. Barring that big reversal, however, the door remains open to 307.50-309.00.
My strategy is to use any of that weakness to fill out a position in the QQQ, which I initiated this morning.
Sector/Industry Focus
The sectors that have been hit the hardest today are those where market makers stand to make a lot more money, because of options exercised on Friday. We saw this very same thing happen back in March, except it was the three aggressive sectors - technology (XLK), consumer discretionary (XLY), and communication services (XLC) - that led the rally back then. I would expect that much of the options-related selling would be over by tomorrow. I'll be much more interested to see how these sectors perform on a relative basis once options are in our rear view mirror. Currently, here's how they are performing on a relative basis since mid-June:
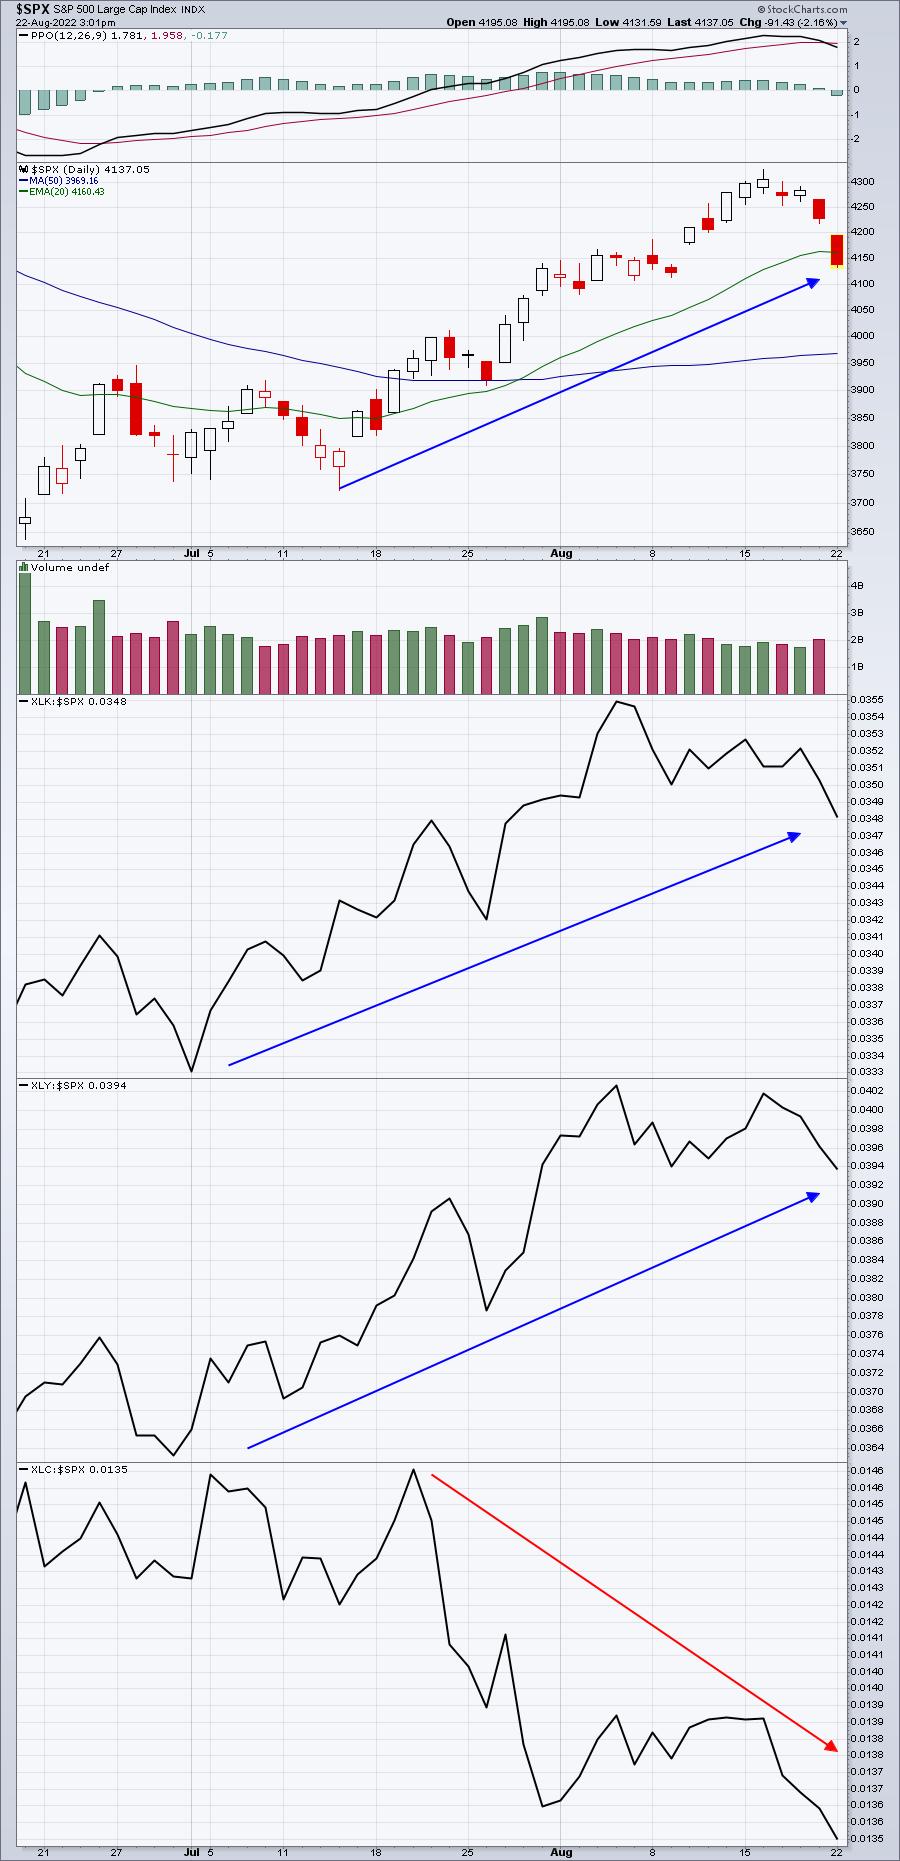
Communication services remains extremely weak and I'd continue to stay mostly away from this area until relative strength returns to some degree. I do like technology and consumer discretionary, however. The key to the next leg higher might very well be semiconductors ($DJUSSC). We really want to make sure the DJUSSC:$SPX ratio remains above the early-July relative low.
ChartLists/Strategies
As I mentioned earlier, I'm using weakness to build back a position in the QQQ. If a reversal occurs at what I consider to be major price or channel support, I may also decide to get more aggressive with the leveraged QLD, keeping a fairly tight stop in place.
As for individual stocks, I did trade 3 stocks earlier today from our Strong AD ChartList (SADCL). I look for early morning weakness on stocks that show solid AD lines, with the expectation these stocks will recover later in the trading day. That's how AD lines rise in the first place. Here were the 3 stocks I traded:
JKS:
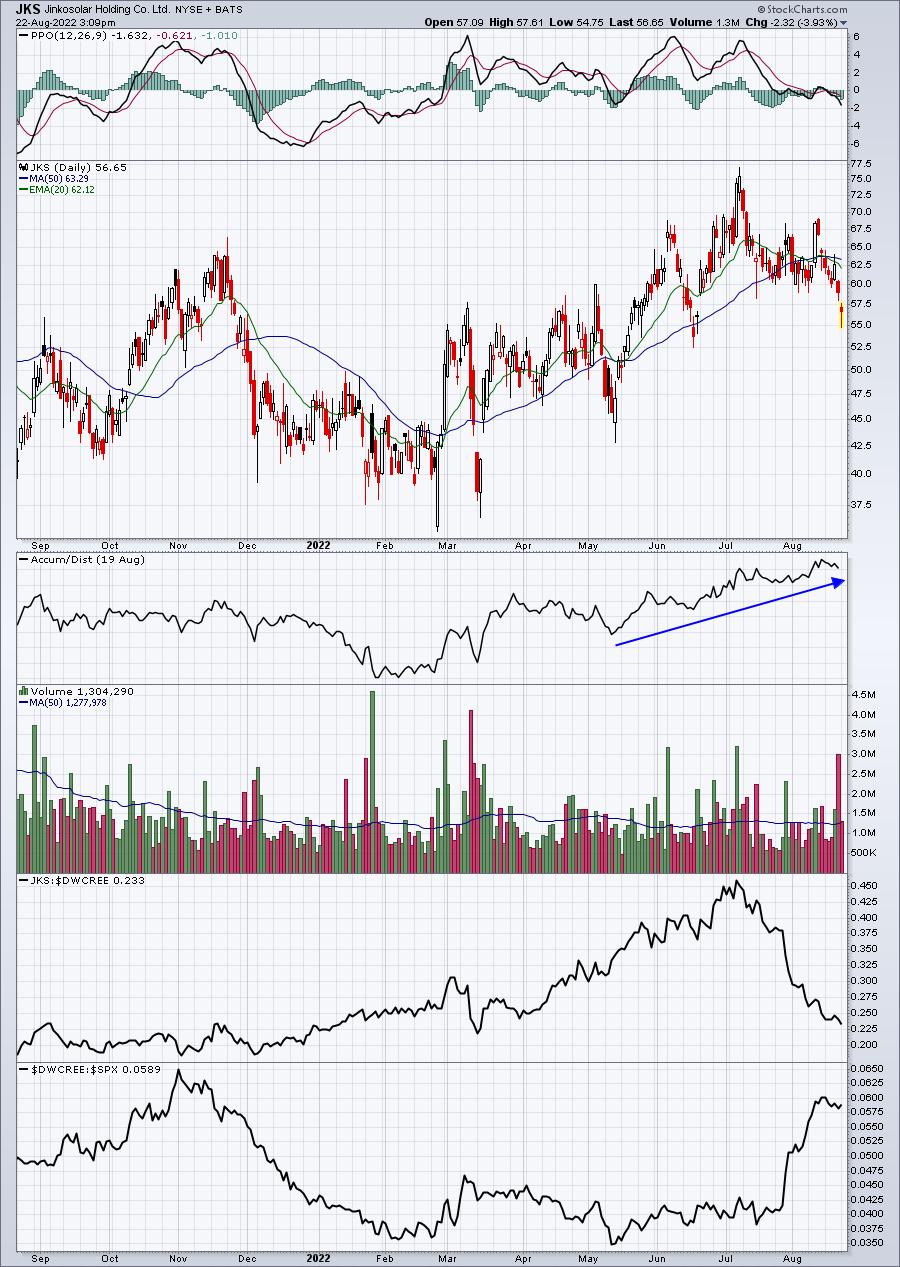
I love the renewable energy space ($DWCREE) and I believe much weakness in the group was caused by options expiration. I suspect several companies in this area will be back to new highs soon. JKS has a very strong AD line that's been consistently rising, so when I saw it was down at 10am ET this morning, I took a short on the long side:
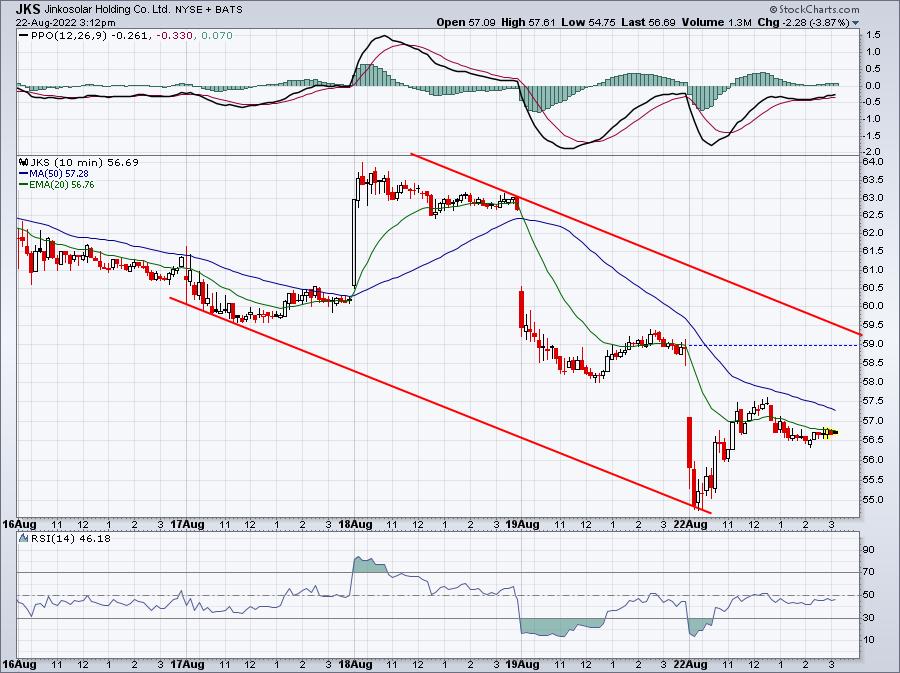
That sudden four dollar drop in the first 30 minutes, I felt, presented an opportunity for a quick trade. When it rebounded an hour later to near 57, I took a 3% profit and moved back to cash. JKS appears to be downtrending, so I didn't want to take any further risk.
MAXN:
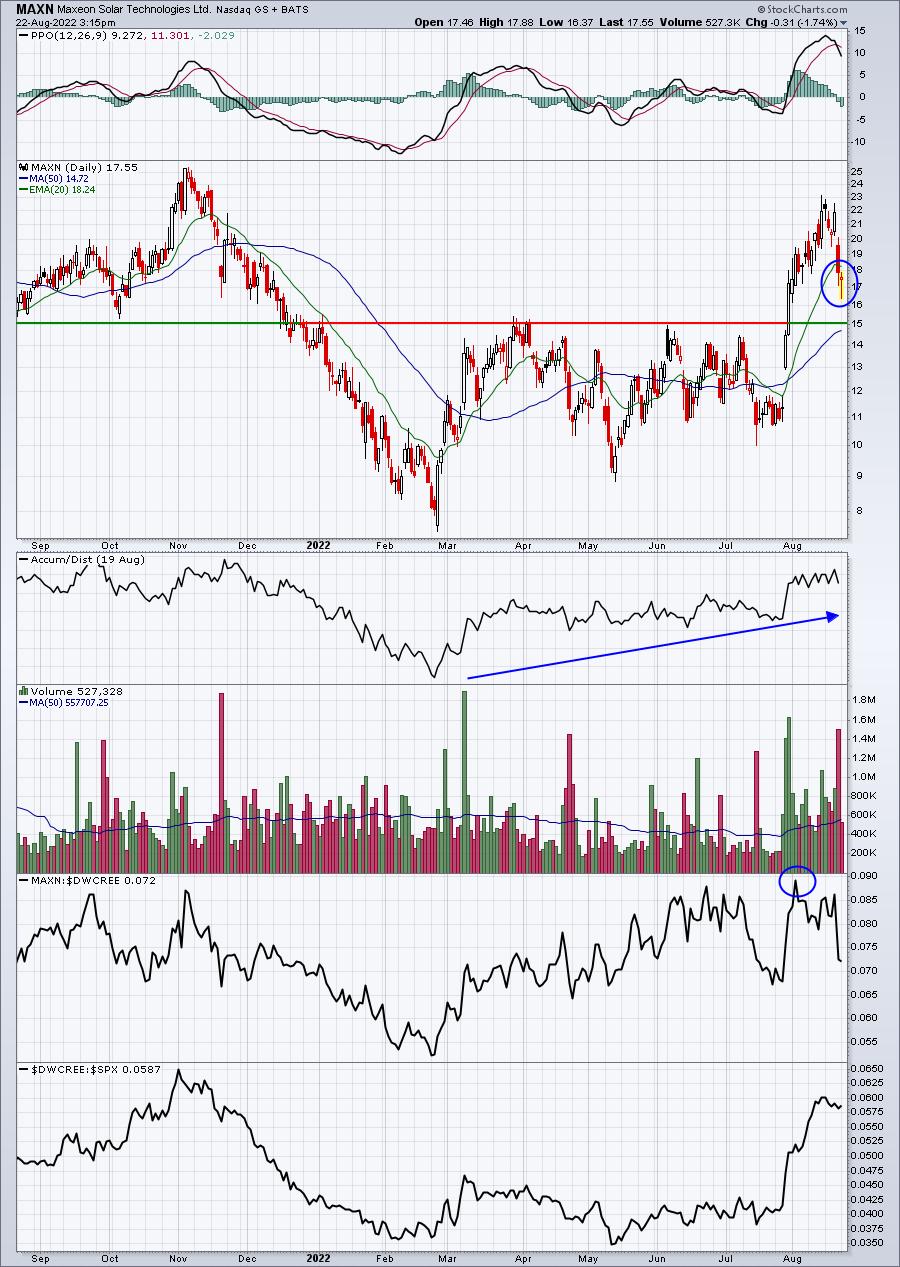
Here's another renewable energy stock. MAXN recently hit a 52-week high vs. its industry peers and hasn't seen much selling of late. I actually took a 1/2 position, with the idea that I'd buy the other half closer to 15 if it got there. Here's the intraday chart:
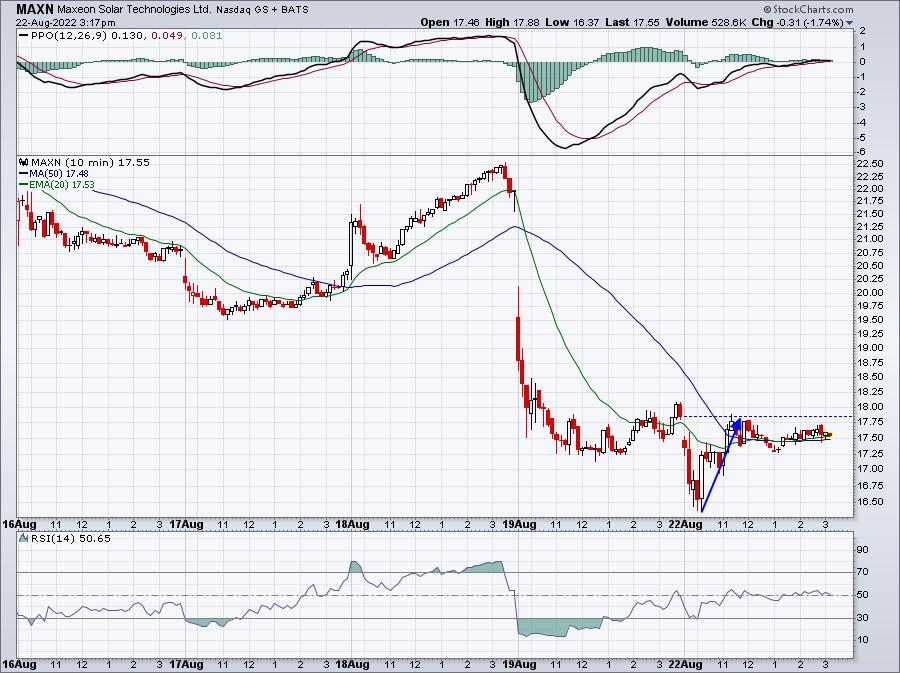
Instead of falling further and buying more, MAXN actually recovered very quickly this morning, so I took profits on the 1/2 position.
SKYT:
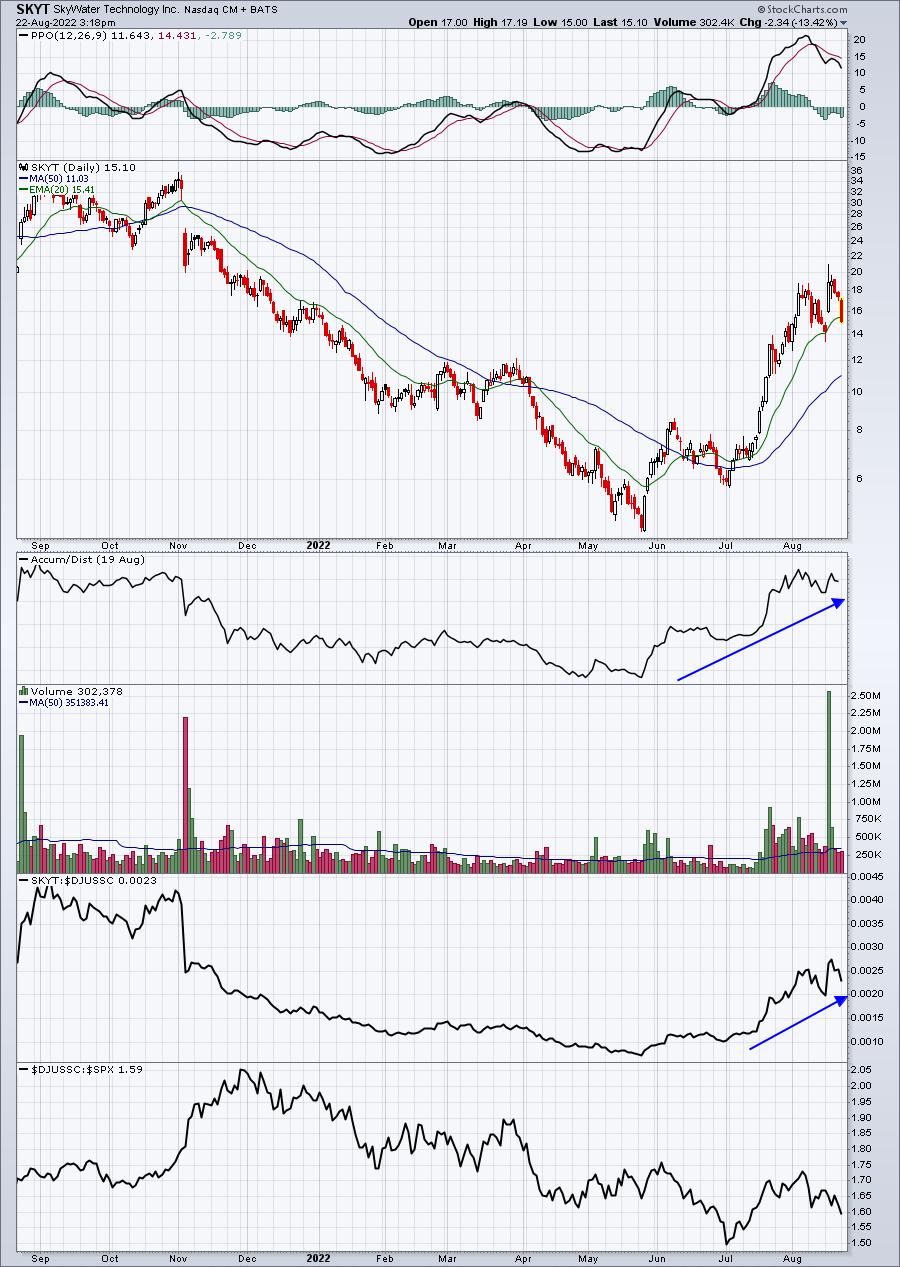
Recently, SKYT has soared relative to its semiconductor peers. Its AD line has also been very strong and volume trends have been superb as well. So I was delighted to see this one down to 16 early to test gap support:
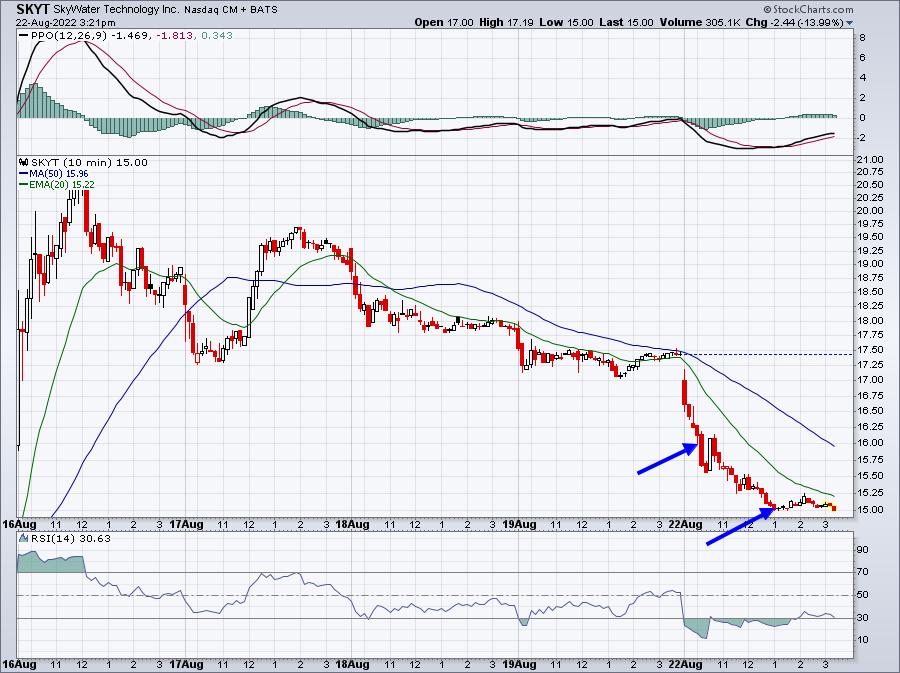
I considered the same strategy with SKYT as I did with MAXN. I was thinking two entries - first at 16.00 gap support (top) and next at 14.25 gap support (bottom). SKYT nearly hit 21 just four days ago, so this is a very volatile stock that can move very quickly. It's a fairly small position and I'm still sitting in it - with a loss. I'm planning to stick with my strategy to buy the other half at the bottom of gap support. We'll see how this trade develops.
I also bought TSLA today just beneath its 20-day EMA test. I have a second entry planned at 840, should it get there.
Earnings Reports
Here are the key earnings reports for the next two days, featuring stocks with market caps of more than $10 billion. I also include several companies with market caps below $10 billion. Finally, any portfolio stocks that will be reporting results are highlighted in BOLD. If you decide to hold a stock into earnings, please understand the significant short-term risk that you are taking. Please be sure to check for earnings dates for any companies you own or are considering owning.
Monday, August 22:
PANW, ZM, NDSN, DLO
Tuesday, August 23:
INTU, MDT, BNS, JD, BEKE, XPEV, SJM, AAP, DKS, TOL, M, JWN, URBN, LZB, CAL
Economic Reports
None
Happy trading!
Tom