
EB Daily Market Report - Tuesday, August 23, 2022
Executive Market Summary
- Futures were relatively flat overnight before our major indices gapped slightly lower at the opening bell
- New home sales were well below expectations and that seemed to quiet the initial rally after the first 30 minutes
- Crude oil ($WTIC, +3.63%) has surged back above $93 per barrel, clearing its 20-day EMA for the first time since the stock market bottomed
- Energy stocks (XLE, +3.57%) are primary beneficiaries from the jump in crude prices
- Cryptocurrencies are enjoying a nice session, with etherium ($ETHUSD, +5.80%) performing extremely well
- Meanwhile, the 10-year treasury yield ($TNX) is up to 3.05%
- Two defensive groups - real estate (XLRE, -1.23%) and health care (XLV, -1.16%) - are the worst-performing sectors today
- Zoom (ZM, -15.58%) is getting crushed after missing its revenue estimate and lower future revenue guidance
- Palo Alto Networks (PANW, +12.19%) is soaring after posting better-than-expected results
Market Outlook
I'm not sure if the recent weakness has ended as we certainly could see additional selling. But I'm comfortable jumping back in, so I've filled my positions once again on the long side. I do have a position in the QLD, but most of my NASDAQ 100-related money is in the QQQ. One thing that I have noticed today is the outperformance of the NASDAQ 100 (QQQ is the ETF that tracks this index) vs. the S&P 500 (SPY is the ETF that tracks this index). When this ratio (QQQ:SPY) turns back up, it's had a solid history off the June bottom of signaling that the worst of the selling is behind us. This might be premature, but it does look like a QQQ:SPY relative bottom has occurred:
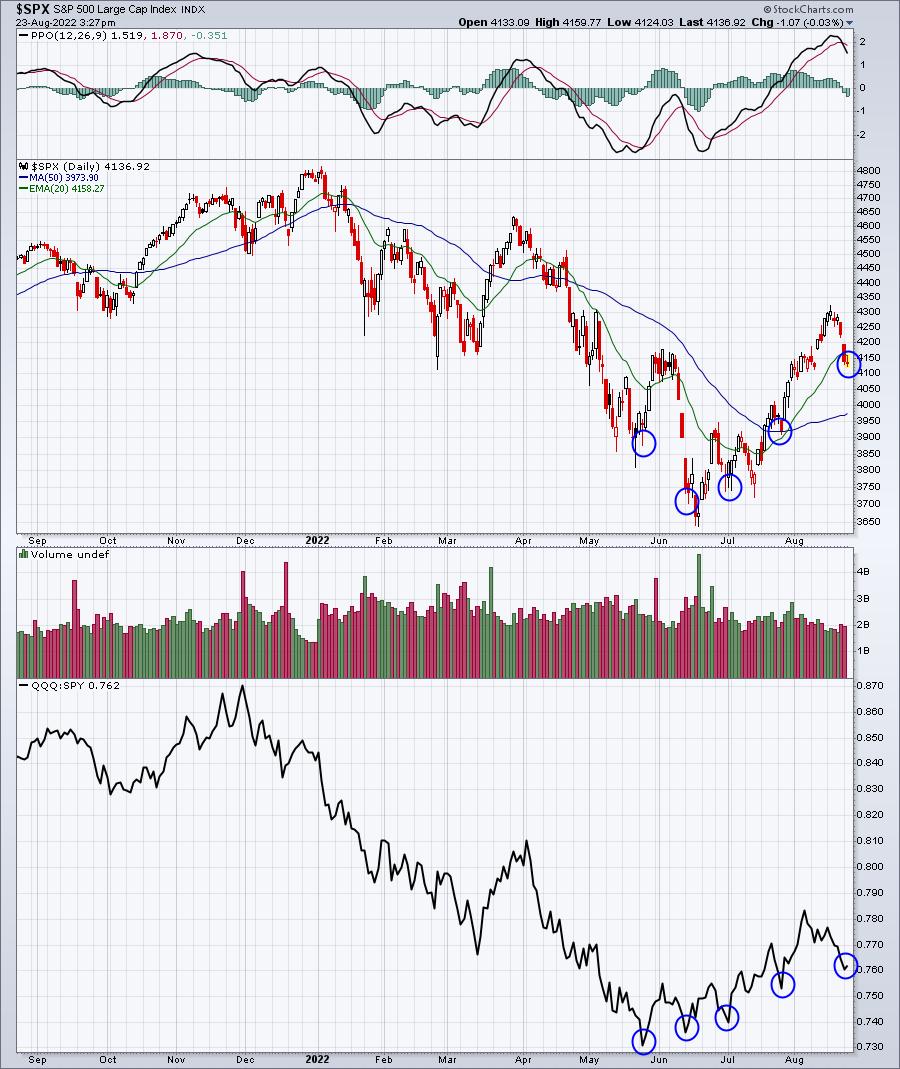
Those blue circles on the bottom relative price panel highlight the "V" bottom that's taken place each time since May. If you look above at the S&P 500, those signals appeared to work almost exactly on cue 3 of the 4 previous times and the 4th signal wasn't that bad as the S&P 500 only fell another day or two before rallying.
I don't know if this possible reversal marks the S&P 500 low in the current bout of selling, but I thought I'd at least point it out.
Sector/Industry Focus
Home construction ($DJUSHB) is performing relatively well today, given the disappointing new home sales report for July. It was nowhere near expectations and the recent rise in the 10-year treasury yield ($TNX) can't be considered bullish tailwinds for the group. Yet, the group as a whole, is higher on the session. Here's how the DJUSHB looks technically:
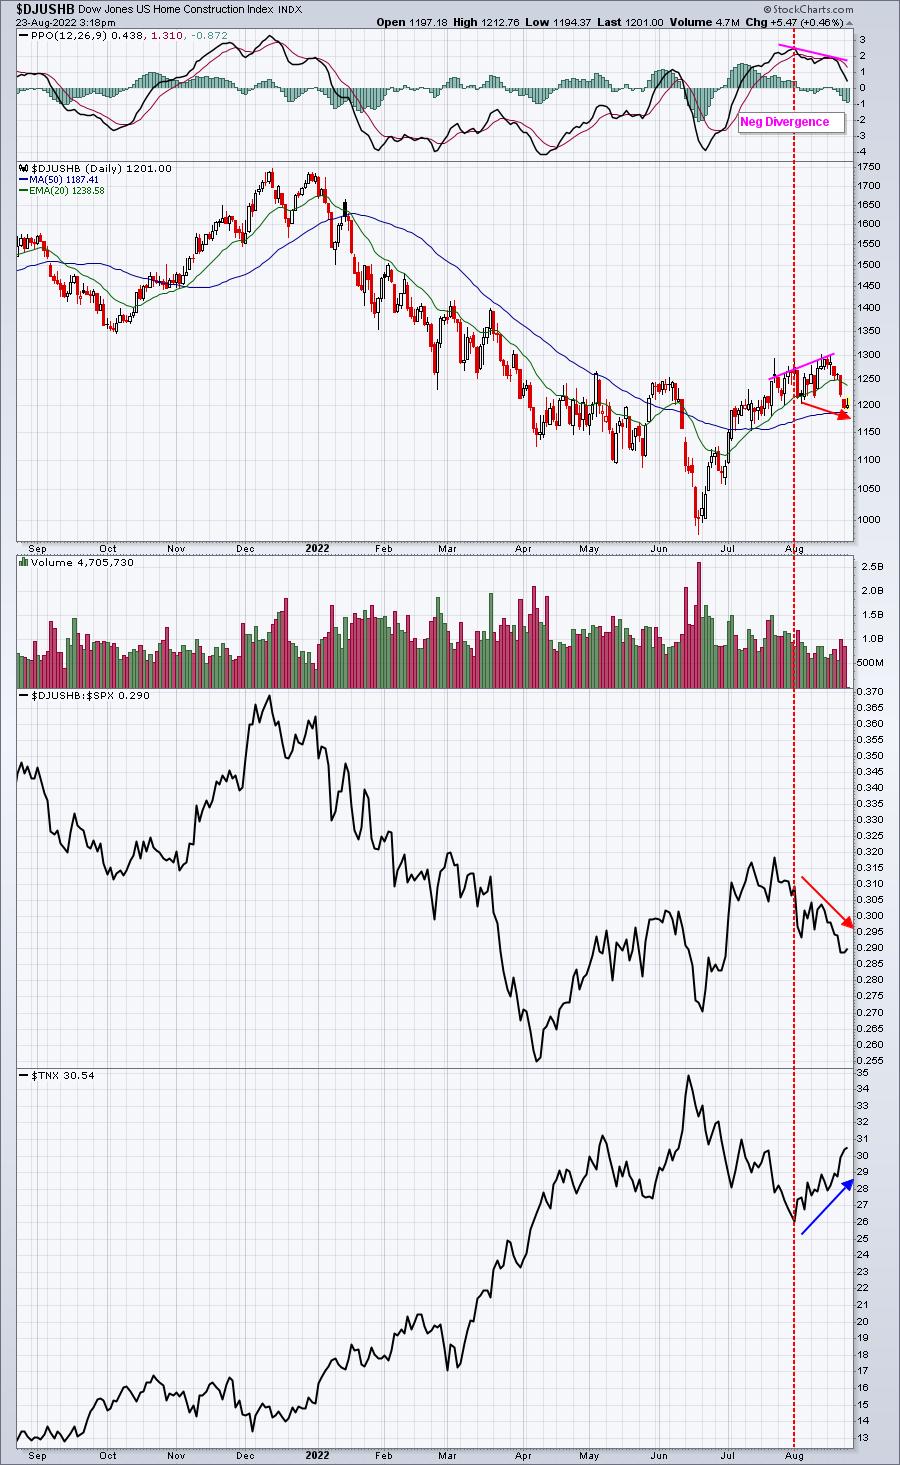
The TNX has been rising throughout the month of August, but the DJUSHB and its relative performance vs. the S&P 500 ($DJUSHB:$SPX) held up well initially, before rolling over during options expiration week. But much of this selling could relate to the negative divergence shown above as well. A 50-day SMA test would help to reset that momentum oscillator, allowing the DJUSHB to move higher once again. We'll see.
ChartLists/Strategies
I included 4 trade setups in the EB Weekly Portfolio Report, which was published this morning. After running our 20-day EMA scan against our Strong Earnings ChartList (SECL), here were the 24 stocks returned:
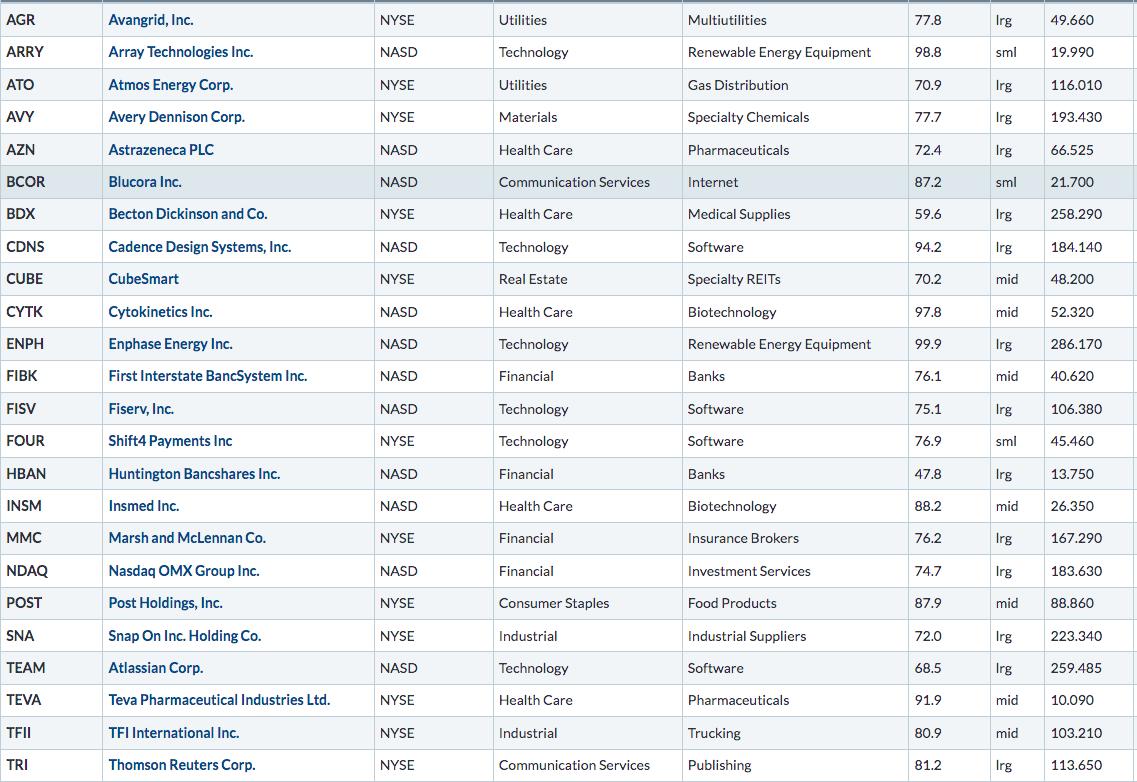
Here are two interesting charts from this list:
CYTK:
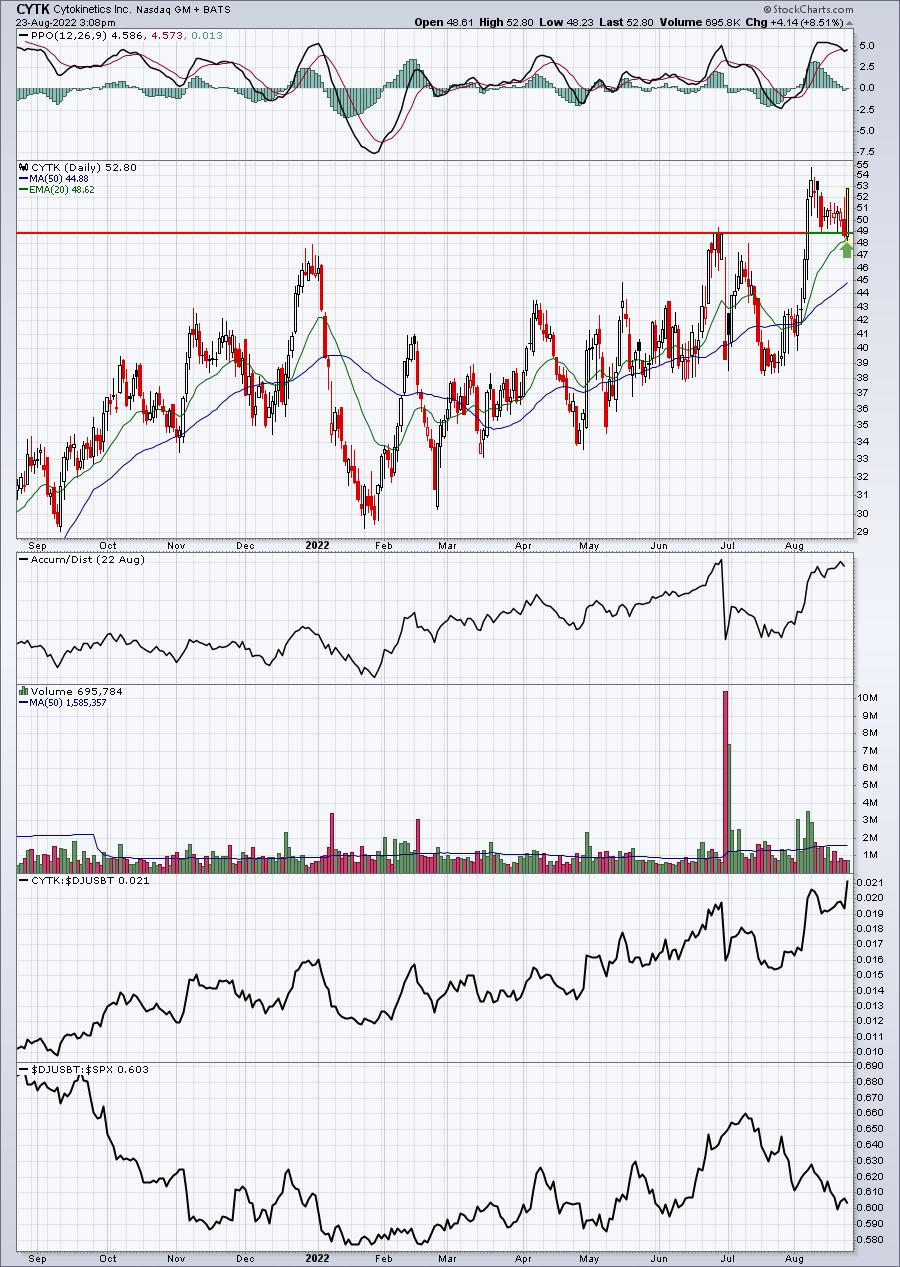
CYTK has already made a huge bounce, but these are the types of trades I'd look for. It had moved just a tad below price support and testing its 20-day EMA for the first time since its explosive move higher in early August.
TFII:
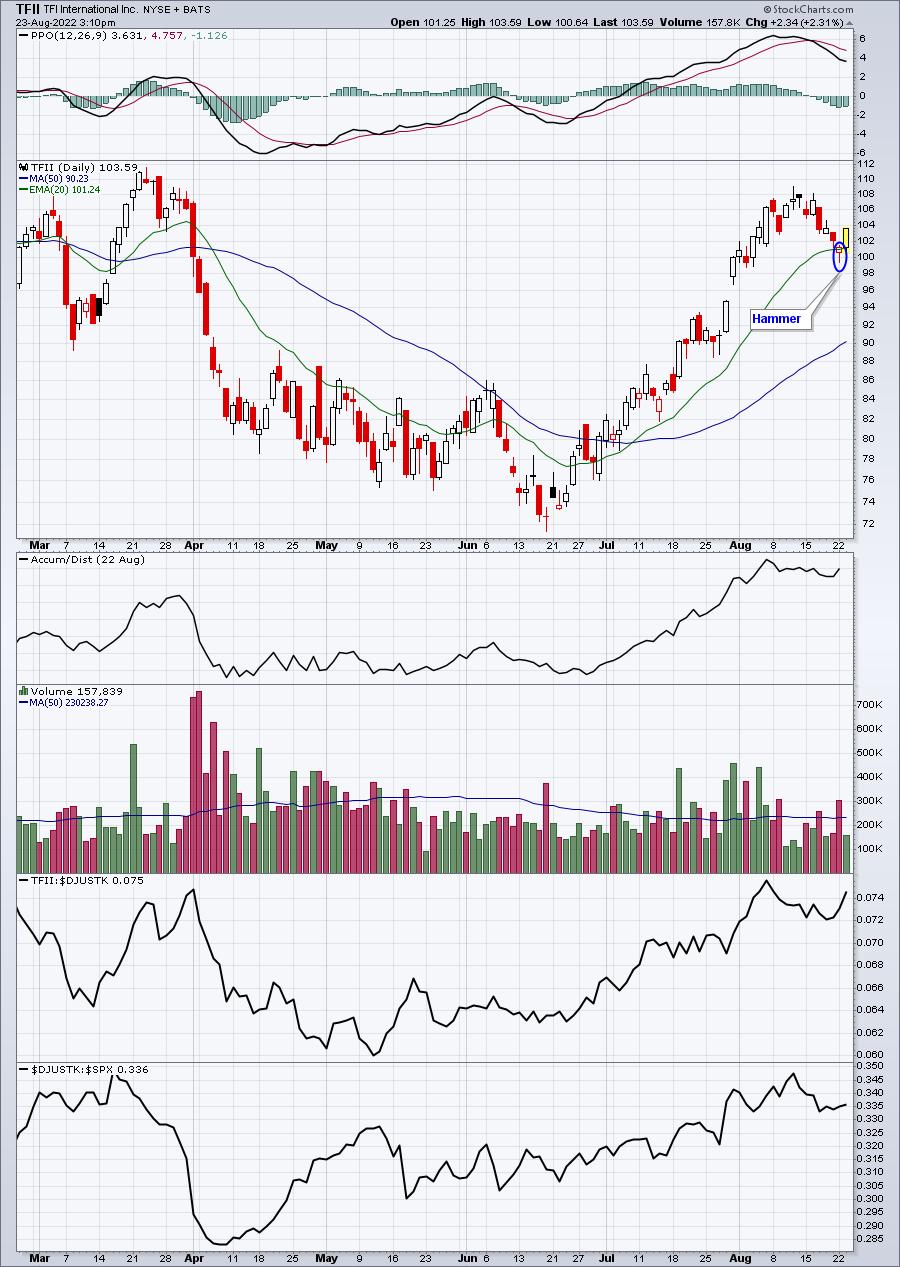
TFII is also bouncing nicely, but this time it was on the heels of a nice reversing hammer candlestick. It's always best if you can find two or more corroborating reasons why a trade makes sense.
Earnings Reports
Here are the key earnings reports for the next two days, featuring stocks with market caps of more than $10 billion. I also include several companies with market caps below $10 billion. Finally, any portfolio stocks that will be reporting results are highlighted in BOLD. If you decide to hold a stock into earnings, please understand the significant short-term risk that you are taking. Please be sure to check for earnings dates for any companies you own or are considering owning.
Tuesday, August 23:
INTU, MDT, BNS, JD, BEKE, XPEV, SJM, AAP, DKS, TOL, M, JWN, URBN, LZB, CAL
Wednesday, August 24:
NVDA, CRM, RY, AMC, ADSK, SPLK, NTAP, WSM, IIVI, BOX, WOOF, DY, VSCO, EAT, GES, ZUO
Economic Reports
August PMI composite: 45.0 (actual) vs. 49.2 (estimate)
July new home sales: 511,000 (actual) vs. 575,000 (estimate)
Happy trading!
Tom