
EB Daily Market Report - Monday, August 29, 2022
Webinar Special Ends TODAY!
In connection with our Saturday webinar, we are offering members to extend their membership for 12 months for $997. However, we will add TWO BONUS MONTHS so that you receive 14 months instead of 12. If you have remaining time left on your membership and you'd like to extend, we will add the 14 months to the end of your current expiration date.
If interested, you need to act NOW! This special ends at midnight tonight. If you're interested, be sure to reach out to customer service at "[email protected]".
Thanks for your support!
Executive Market Summary
- Futures were very weak overnight and that wasn't good considering how we finished on Friday
- Crude oil prices ($WTIC, +4.08%) are solidly higher and that's contributing to a very strong energy sector (XLE, +2.11%) today - more on energy and its outlook below
- Bitcoin ($BTCUSD, +0.59%) briefly traded back beneath $20000, but has since recovered
- There were no key economic or earnings reports today, so most of the trading is based on technical trading
- Technology shares (XLK, -0.87%) are notably weak as semiconductors ($DJUSSC, -1.39%) remain under considerable pressure
- Despite the warning from Fed Chair Powell on Friday, gold ($GOLD) is flat today and showing little signs of strength, particularly relative strength vs. the S&P 500
- Friday weakness in 3M (MMM, -2.14%) is continuing today as that component stock is the weakest in the Dow Jones
- The 10-year treasury yield ($TNX) is up 8 basis points to 3.11%; I believe the 3.25% and 3.48% are the two critical upside levels to watch here
Market Outlook
While Friday saw selling ALL DAY LONG, today has clearly been different. If you recall, I did a recent show that highlighted the manipulation in the stock market. We were seeing lots of gap downs to open trading, followed up by selling until the 10:00-11:00am time frame. From there, we would see buying as Wall Street capitalized on early weakness by accumulating stocks later in the day. I want you to look at how the trading today on the S&P 500 is unfolding:
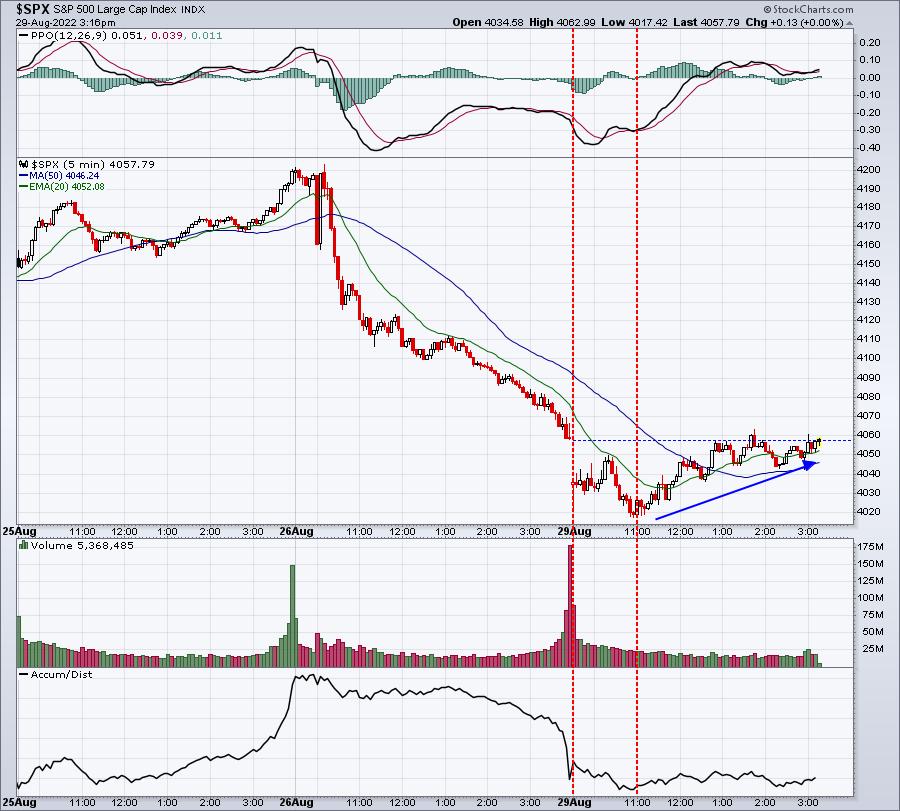
This is a 3-day 5-minute chart. Again, you can see the intense selling pressure from Friday rather clearly. But one thing I'm watching very intently right now is how the S&P 500 trades in the afternoon hours over the next few days to few weeks. I believe that will dictate, to a large degree, whether we're going to resume the secular bull market advance, or potentially head back towards the mid-June low for a double bottom.
Sector/Industry Focus
Energy (XLE) is showing leadership again - at least for now. There's a very strong positive correlation between the direction of crude oil prices ($WTIC) and the relative direction of the XLE (vs. the S&P 500). Check this out:
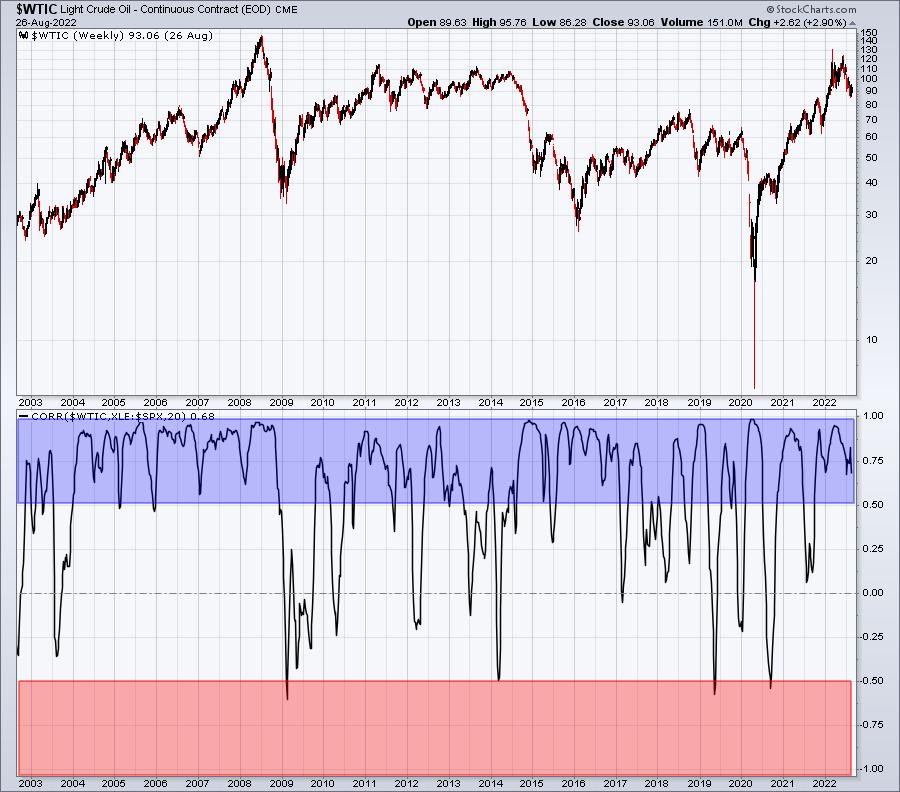
The blue-shaded area tells us that the positive correlation here is undeniable. So if you're looking to trade energy stocks, you MUST keep an eye on crude oil prices. They've been struggling of late, trading mostly beneath their key 20-day EMA and 50-day SMA:
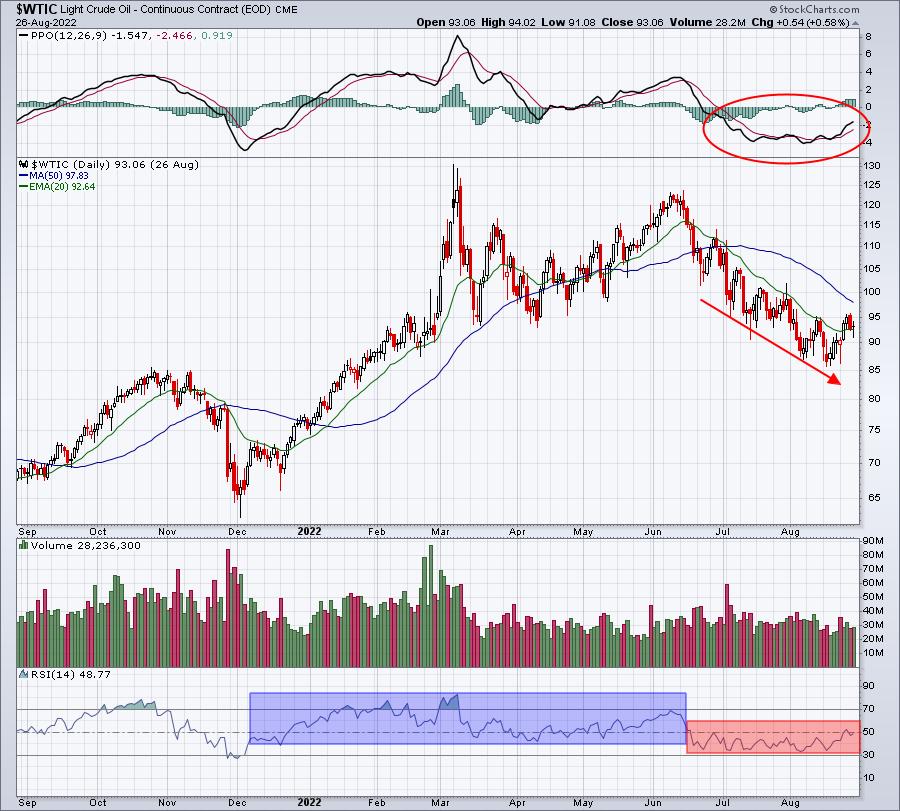
The RSI is stuck in the 30-60 range, which is evidence of a downtrend. For me to feel more bullish about energy stocks and to have more confidence trading them, I'd like to see crude oil price break above $100 per barrel and the RSI to jump beyond 60. Until that occurs, I believe the risk of trading energy stocks is on the high side.
ChartLists/Strategies
Trading any stocks right now on the long side is a bit risky, because the overall market environment has become more challenging as a result of last Friday's big selloff. That means that you have to be willing to take on more risk to trade. I would definitely make sure I keep my stops in place in the event that the recent selling continues to escalate. Having said this, here are 3 stocks on the Strong Earnings ChartList (SECL) that are testing their respective 20-day EMAs that could provide very solid returns if the stock market does strengthen. These represent the Model Trades for this week:
DECK (from Model Portfolio and SECL):
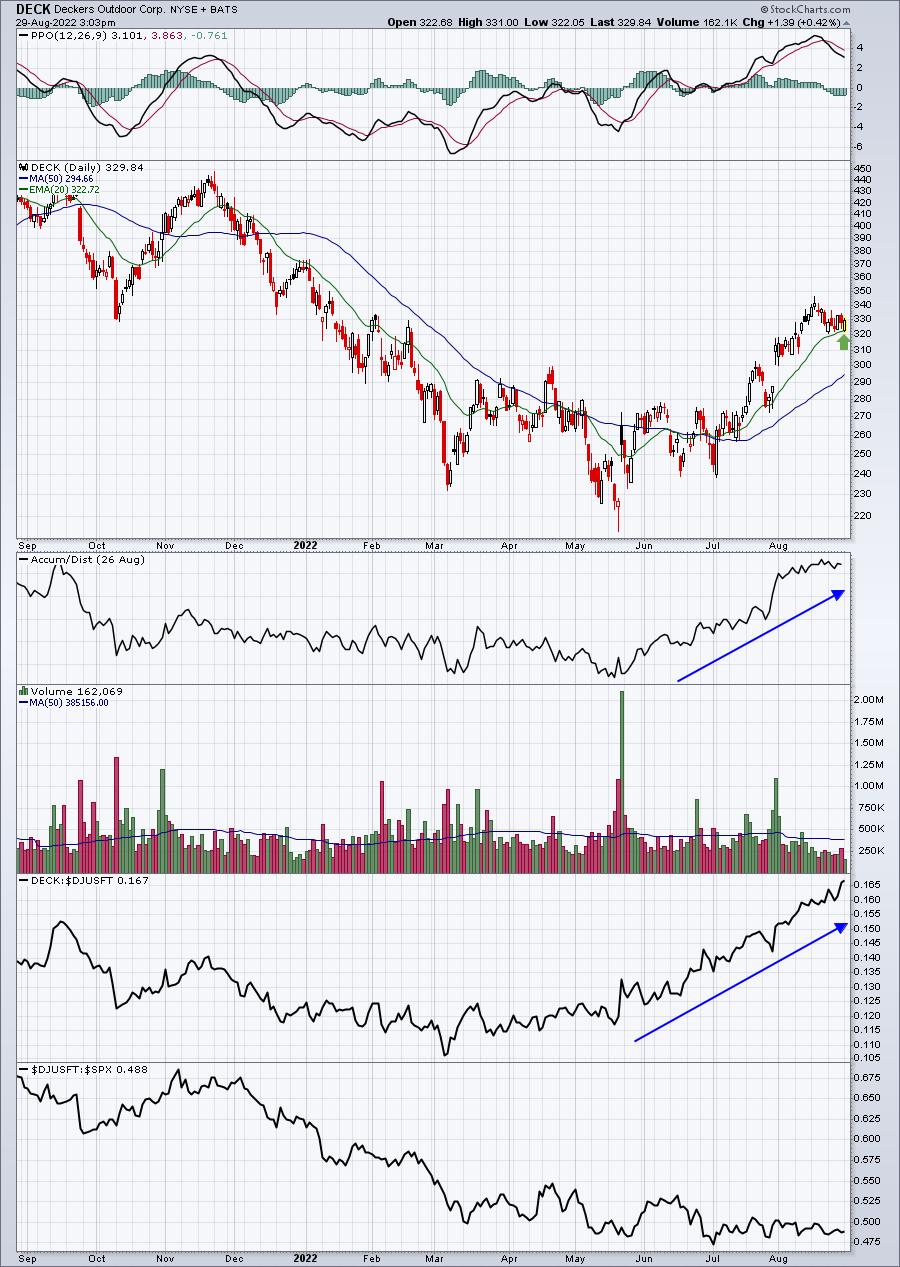
DECK is a part of our Model Portfolio and is a big leader in the footwear space ($DJUSFT). Today's low tested not only the rising 20-day EMA, but also tested the most recent gap support close to 322. A close beneath 322 would spook me, but otherwise I'm looking for new highs ahead for DECK.
RUN (from SECL):
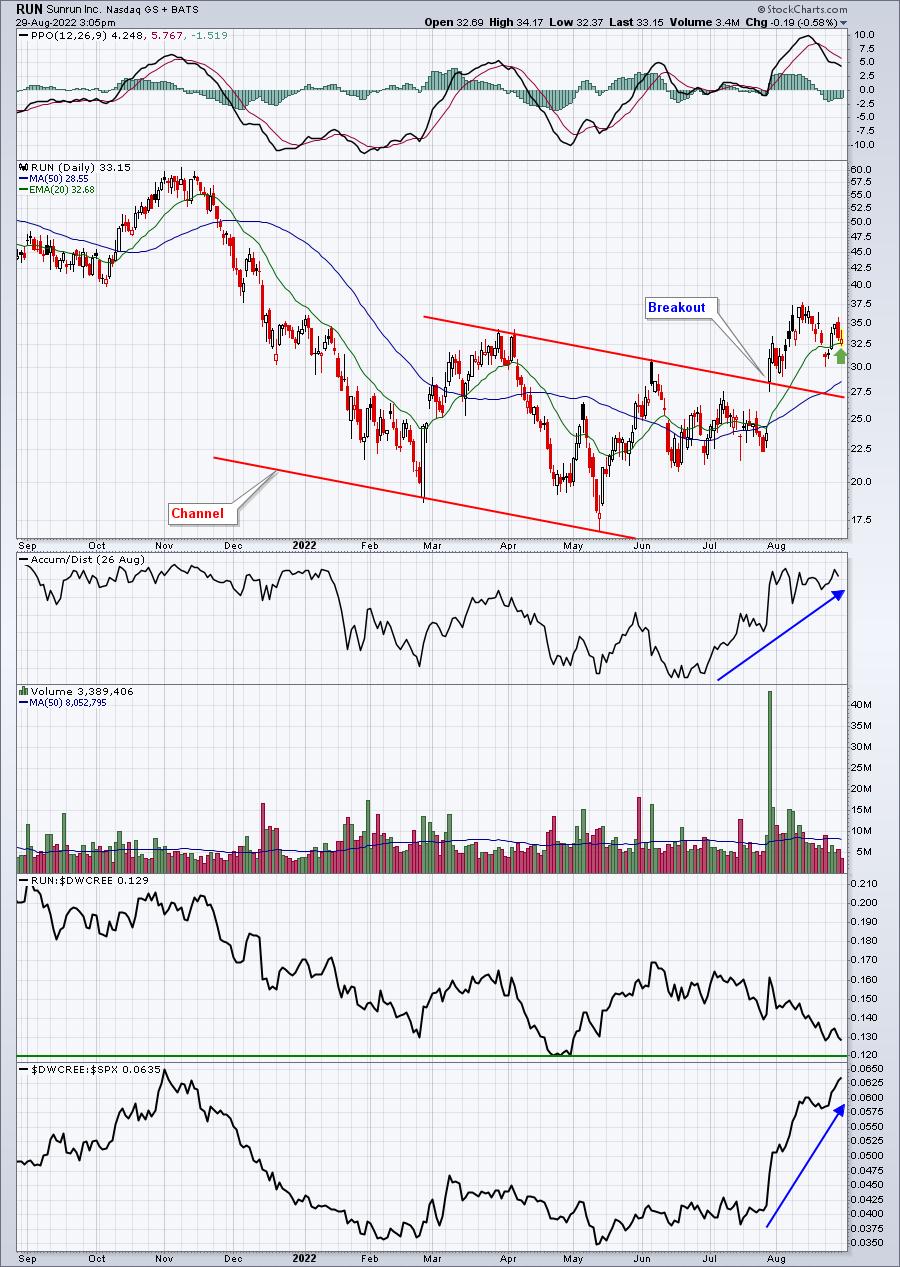
RUN is part of a very strong renewable energy group ($DWCREE). While it's not the best performer within the group, I do love the MASSIVE volume that accompanied its recent channel breakout. Pulling back to the 20-day EMA presents an opportunity. RUN is quite aggressive, so buying at the 20-day EMA and again on any weakness down to 30.00 would be a possible strategy. Any close beneath the 50-day SMA and I'd exit.
LSI (from SECL):
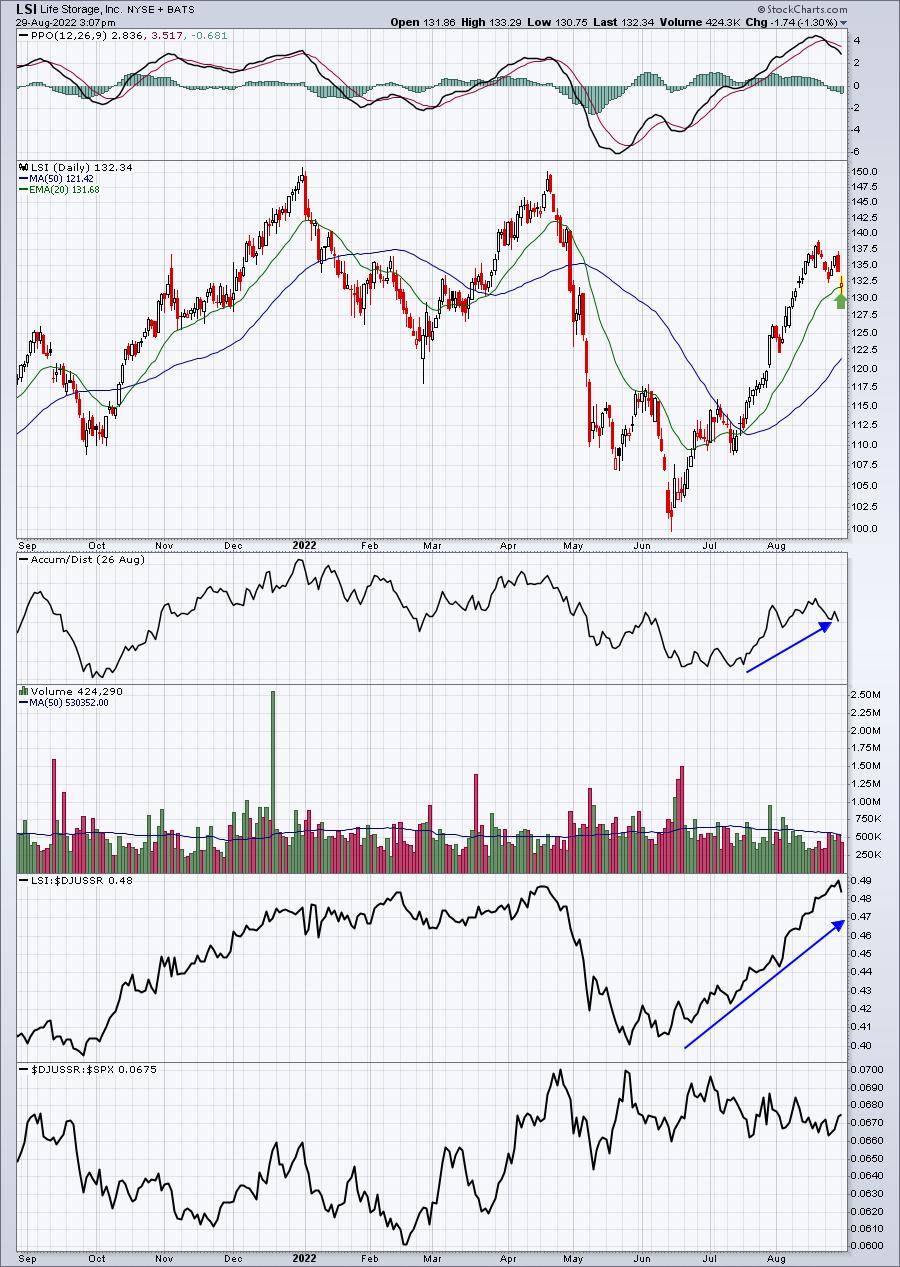
This one is in the real estate space, so it's a bit more of a defensive trade. Still, I'd keep a tight closing stop beneath the 20-day EMA.
Earnings Reports
Here are the key earnings reports for the next two days, featuring stocks with market caps of more than $10 billion. I also include several companies with market caps below $10 billion. Finally, any portfolio stocks that will be reporting results are highlighted in BOLD. If you decide to hold a stock into earnings, please understand the significant short-term risk that you are taking. Please be sure to check for earnings dates for any companies you own or are considering owning.
Monday, August 29:
PDD, HEI, CTLT, SSL, HTHT
Tuesday, August 30:
BMO, BIDU, CRWD, HPQ, HPE, BBY, CHWY, CHPT, PVH, AMBA, IQ, PLAB
Economic Reports
None
Happy trading!
Tom