
EB Daily Market Report - Tuesday, August 30, 2022
ChartLists Updated
I've updated the following ChartLists, and they should be available for viewing/downloading on our website later today:
- Strong Earnings ChartList (SECL)
- Strong Future Earnings ChartList (SFECL)
I will be looking to update the Raised Guidance ChartList (RGCL), Short Squeeze ChartList (SSCL), and the September Seasonality ChartList over the next day or two.
Executive Market Summary
- Futures were higher overnight and we saw an opening gap higher across our major indices
- Selling quickly resumed, however, setting an intraday low just before 11:00am ET
- Consumer confidence soared for August, jumping from 95.3 to 103.2, well ahead of expectations
- Seasonality very much favors a reversal today or very soon - more on this below
- The 10-year treasury yield ($TNX) is flat on the session
- Crude oil ($WTIC, -5.62%), one day after seeing a huge gain, is tumbling today back beneath $92 per barrel
- All 11 sectors are lower today with energy (XLE, -3.72%) lagging badly, due primarily to the big drop in crude
- Aggressive areas are not performing well either, with consumer discretionary (XLY, -1.83%) dropping back to approach its now-rising 50-day SMA
- Best Buy Co (BBY, +2.10%) is the best performer on the S&P 500 today after reporting solid quarterly results, but it's well off its intraday high
Market Outlook
I don't like to buy when a stock or key index is breaking beneath its 50-day SMA and HOPE that it recovers. However, if later in the day, it actually does recover to print a reversing candle (eg, hammer, bullish engulfing, etc), I do get more bullish, expecting the intraday low on the reversing candle to hold as price support. Today, we're seeing the S&P 500 trade beneath its 50-day SMA on an intraday basis, but how do we finish today? That'll be the key, in my opinion:
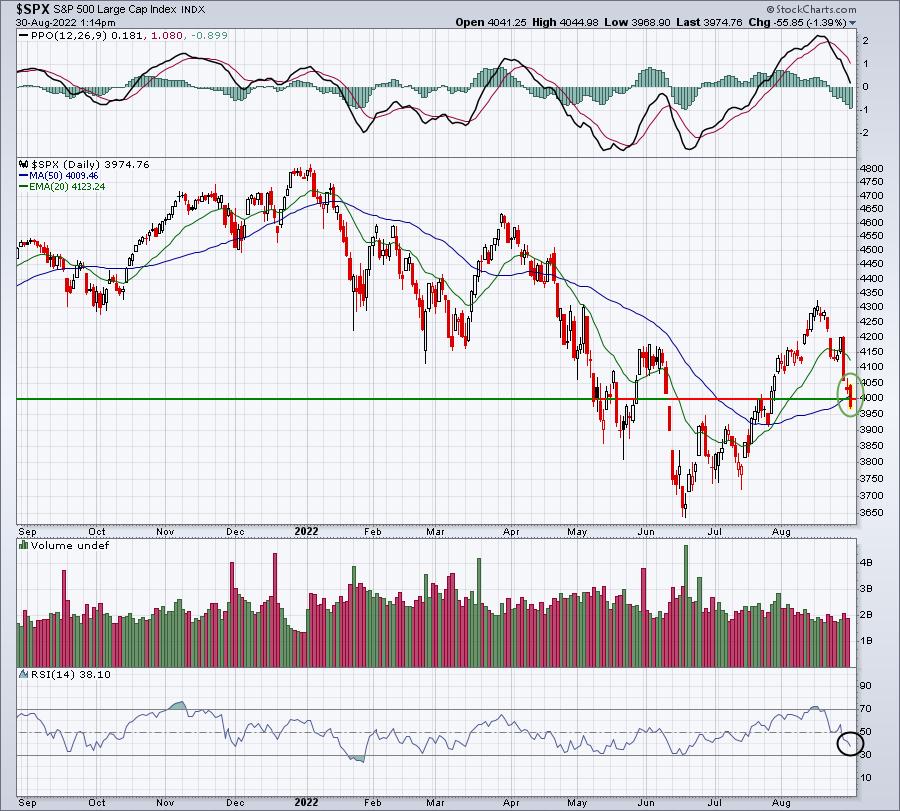
Quite honestly, this is a VERY CRITICAL short-term test for the S&P 500. The argument that we will continue to move higher into and throughout September really doesn't look nearly as solid if we finish weak today. Consider these key technical points:
- The 50-day SMA is at 4010 and closing beneath it would be bearish
- Psychological price support is at the even number of 4000
- RSI tends to bottom out on pullbacks in the 40-50 range - you can see we're currently at 38
- Uptrends usually see PPOs remain in positive territory and we're rapidly moving down to test that centerline (zero) support
If you're SUPER aggressive, you could trade the 2x leveraged ETF (SSO) on the S&P 500, but if we don't see that afternoon reversal, the odds of a gap lower in the morning increase. While the stock market can rebound at any time under any circumstance, the risk of a further decline would increase significantly if market action is weak into the close today.
Sector/Industry Focus
We do typically see strength from the close on the 30th of the calendar month through the close on the 2nd calendar day of the following month. During our Saturday event, "Where Does The Market Go From Here?", I discussed a few key historical statistics. One of those was the best days of the calendar month on the S&P 500 since 1950. Here they are, in order of performance:
- 1st: +45.45%
- 2nd: +41.18%
- 16th: +29.69%
- 5th: +28.50%
- 31st: 26.43%
You can see that the 1st and 2nd (Thursday and Friday of this week) are clearly THE best calendar days to be invested in U.S. equities. The S&P 500's average annual return since 1950 is roughly 9%. So the 1st has produced gains at 5 times the rate of the average day. This data does NOT suggest a guarantee that we'll see higher prices between now and Friday's close. However, it does suggest that the odds are in our favor. I try to minimize risk and use historical probabilities in my favor. Again, I cannot assure anyone that this historical tendency plays out again over the next few days, but I wouldn't be at all surprised to see strength appear very soon.
A strong finish today, however, would be much more bullish, given what we know about history and the performance of the upcoming three calendar days.
ChartLists/Strategies
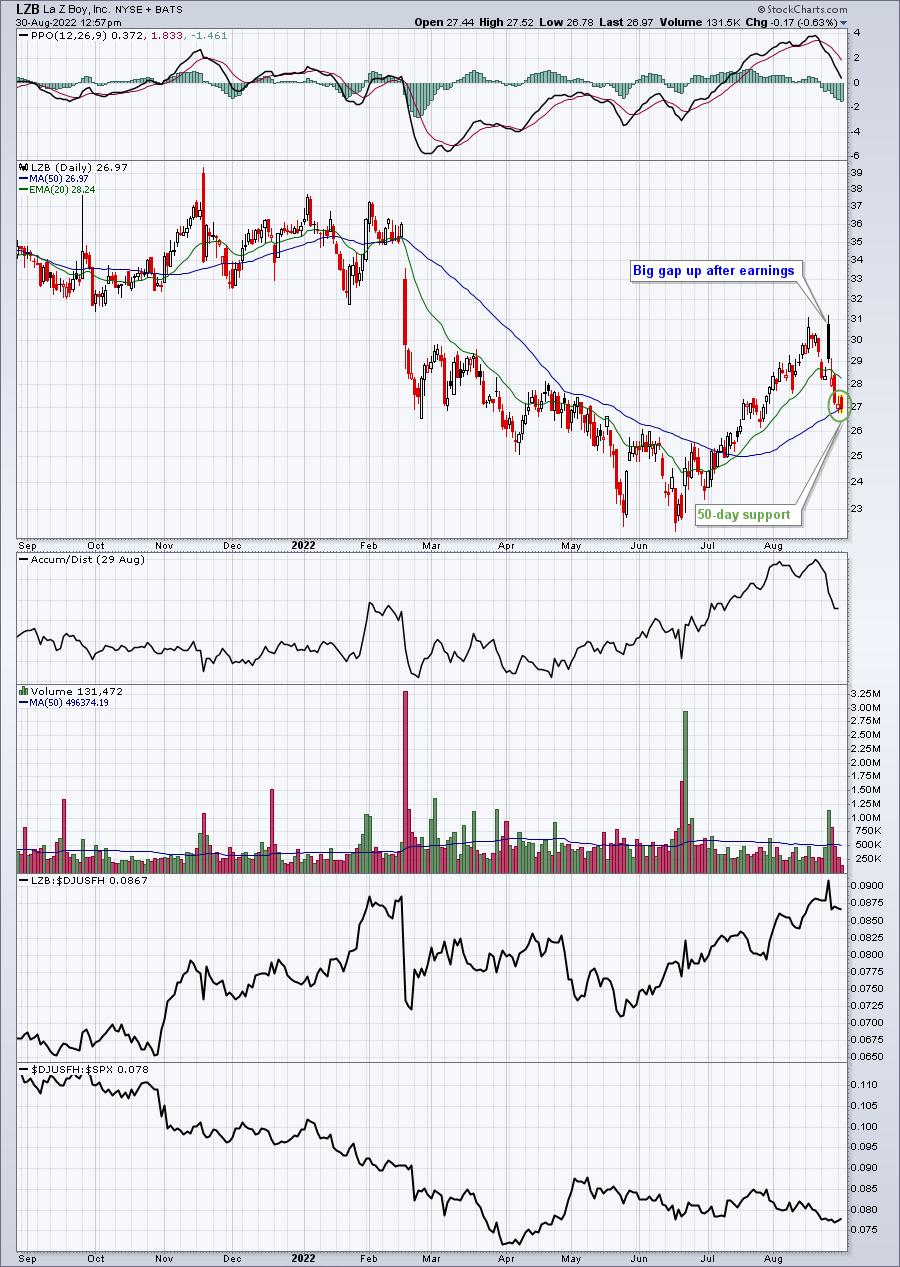
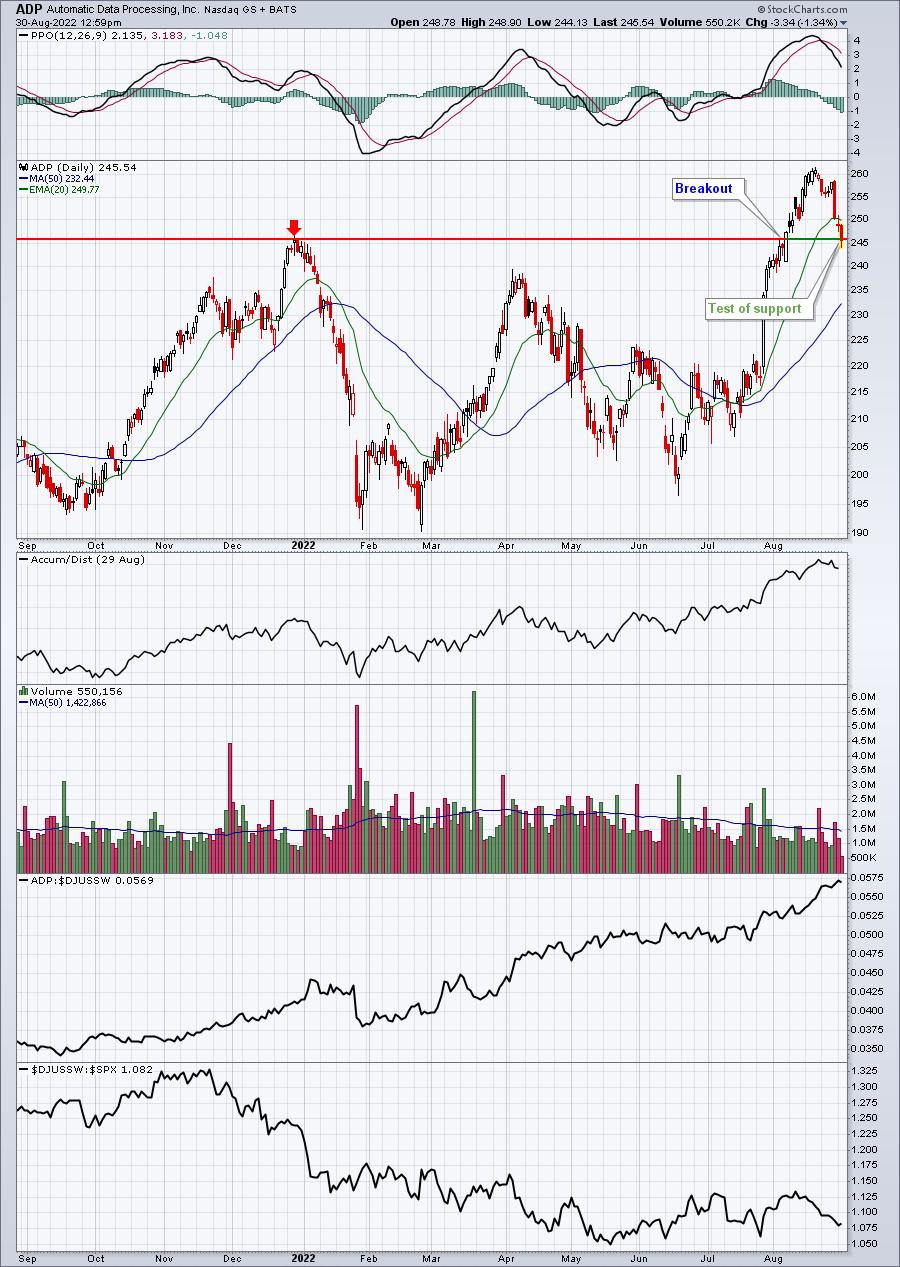
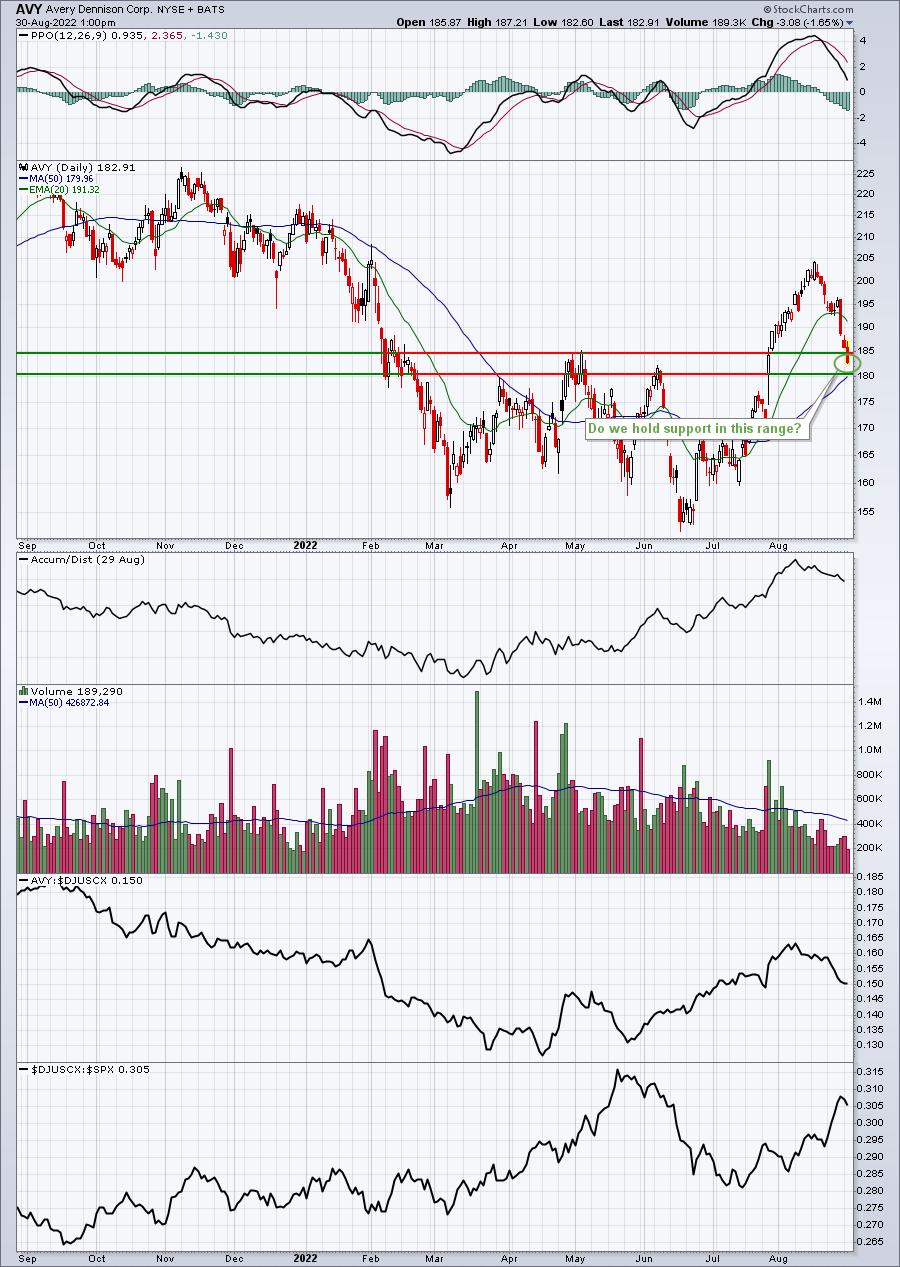
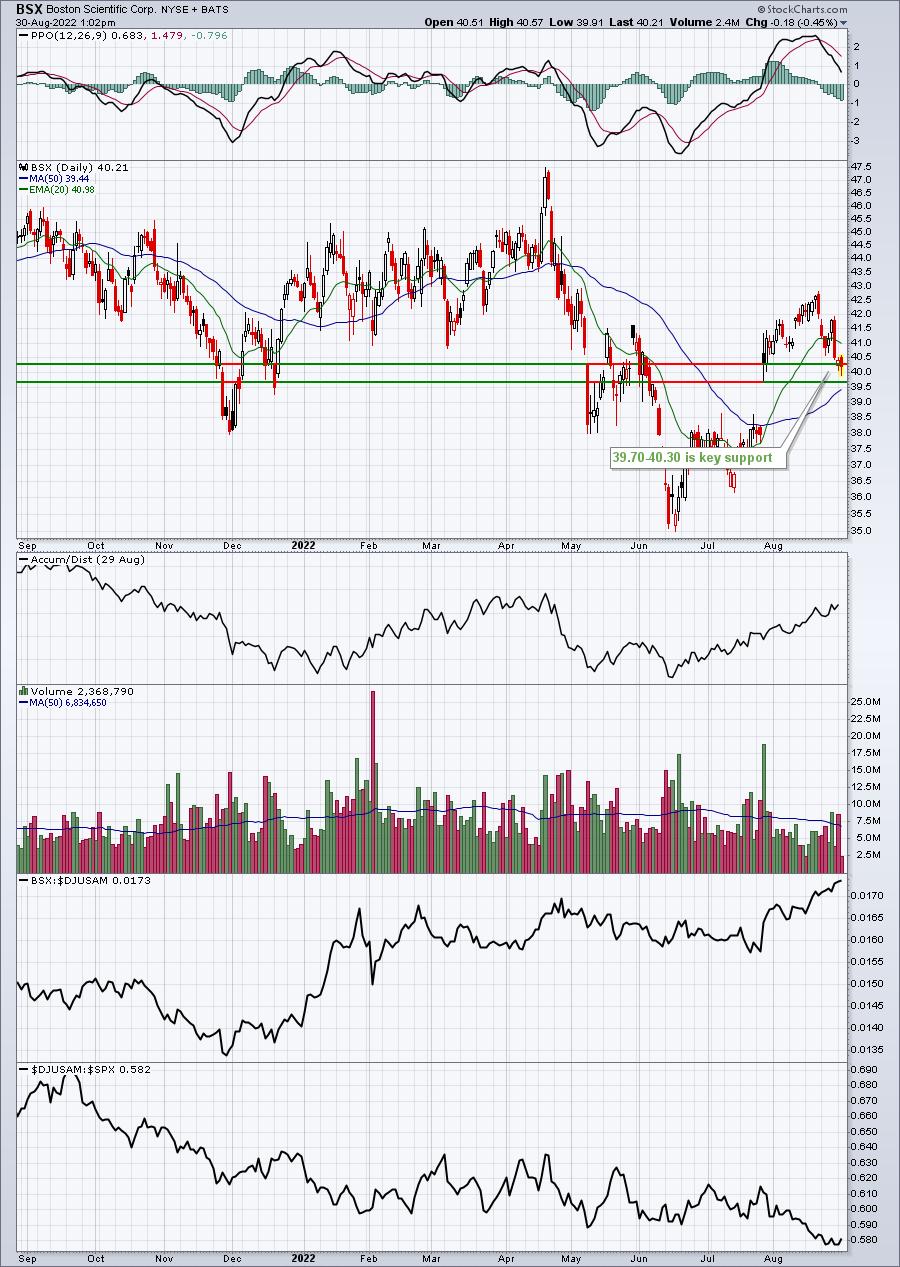
If we see strength this afternoon and a decent finish, here are a handful of stocks that I believe could be poised to benefit by reversing off the support shown:
LZB:
ADP:
AVY:
BSX:
DRVN:
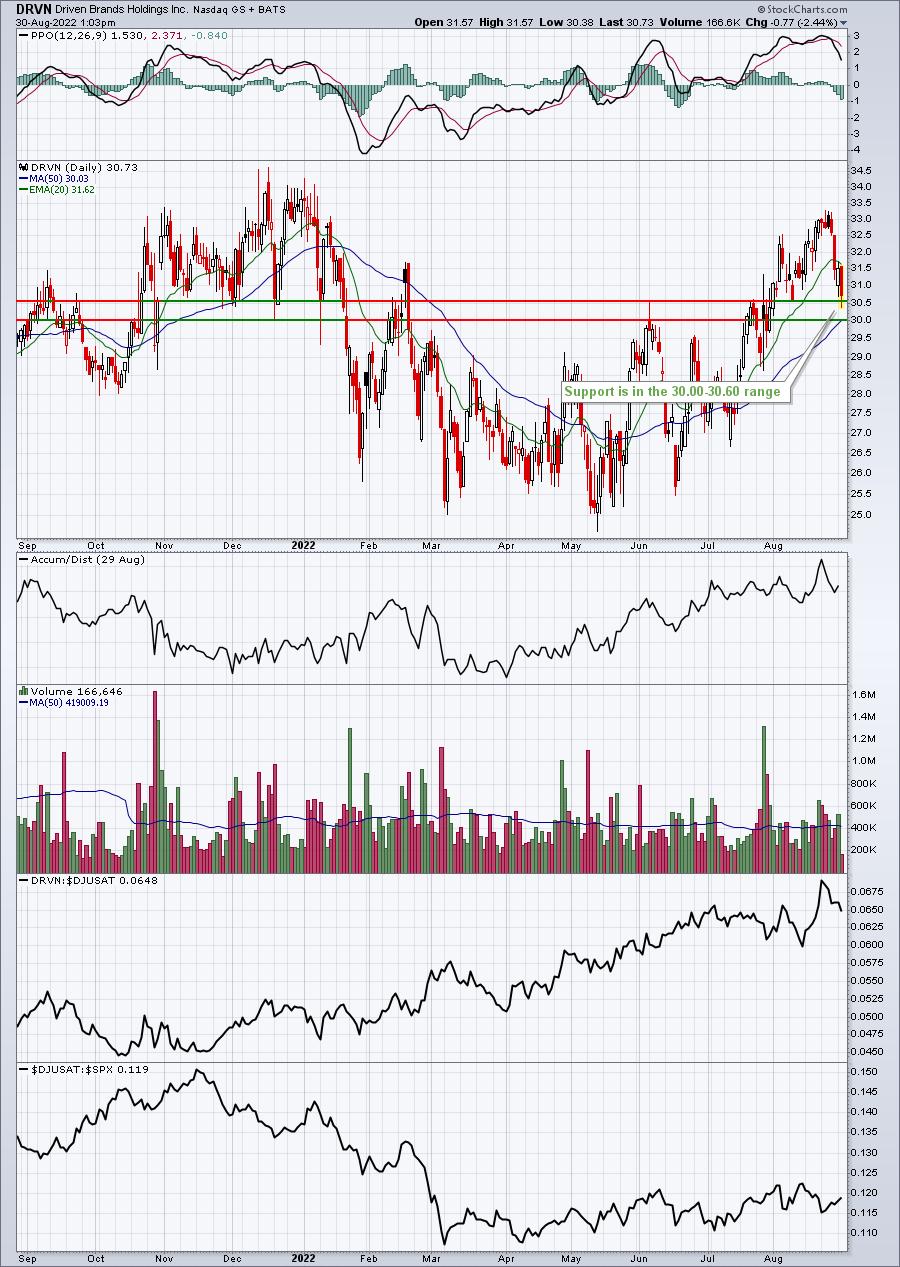
LZB's AD line has tumbled a bit since earnings, but otherwise these stocks all appear to be under accumulation to me. Therefore, they should be poised to benefit from an overall market reversal. Keep these on your radar.
Earnings Reports
Here are the key earnings reports for the next two days, featuring stocks with market caps of more than $10 billion. I also include several companies with market caps below $10 billion. Finally, any portfolio stocks that will be reporting results are highlighted in BOLD. If you decide to hold a stock into earnings, please understand the significant short-term risk that you are taking. Please be sure to check for earnings dates for any companies you own or are considering owning.
Tuesday, August 30:
BMO, BIDU, CRWD, HPQ, HPE, BBY, CHWY, CHPT, PVH, AMBA, IQ, PLAB
Wednesday, August 31:
BF/B, VEEV, MDB, OKTA, COO, PSTG, IOT, S, FIVE, DCI, NTNX, GEF, SMTC, AI, CRDO, DBI, CHS
Economic Reports
June Case-Shiller home price index: +0.4% (actual) vs. +1.1% (estimate)
June FHFA house price index: +0.1% (actual) vs. +0.9% (estimate)
August consumer confidence: 103.2 (actual) vs. 97.4 (estimate)
Happy trading!
Tom