
EB Daily Market Report - Special Report - Thursday, September 1, 2022
Today and/or tomorrow will be very big days technically for U.S. equities, so I wanted to share a few things with you. We're off to a horrible start this morning, adding to the weakness in recent days. Rather than wait until this afternoon, where we COULD have already seen a big reversal, I want to let you know ahead of time what I'm seeing. In no particular order, here are charts/information that I believe is of major importance right now:
NVIDIA Corp (NVDA)
There was an announcement this morning that the U.S. will restrict chip sales to China, which will have a significant impact on NVDA. In my opinion, the reason that NVDA is moving lower is because, in part, of this current fundamental announcement. Trust me, Wall Street looks ahead when pricing securities and much of this is already built in. However, the headline news does what? It triggers gaps lower and early morning "amateur" trading. Perhaps NVDA goes lower, but I believe today could be THE day to determine that. We opened above MAJOR price support, but are currently trading beneath it. If we see a recovery and NVDA closes today above 141.75, then I believe it may have printed a VERY SIGNIFICANT bottom:
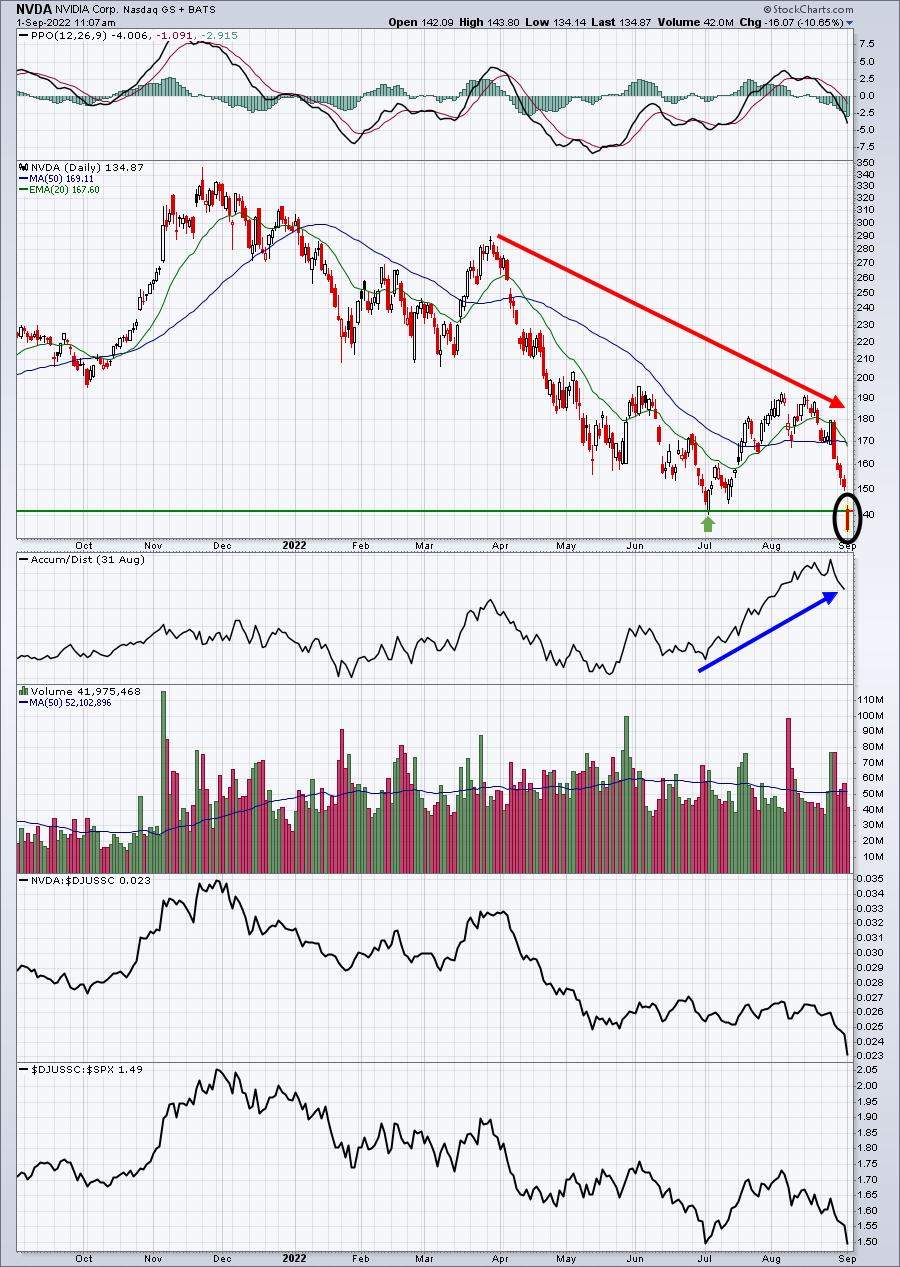
I've studied the stock market for a long, long time. I've seen how bottoms form. A tail (intraday low) beneath a major prior price low, followed by an afternoon recovery, and a successful support test is as good as it gets. Buying NVDA now, in breakdown mode, can be extremely dangerous as the breakdown could trigger a tsunami of selling. But if NVDA rallies later today on big volume and closes back above 141.75, I will buy it. Buying at the current price could be much more rewarding, but it's definitely a riskier trade, in my view.
Bearish Sentiment Accelerating
Remember, sentiment readings are contrarian signals. When the equity-only put-call ratio soars, it means that options traders are POURING into puts, but it's also an indication of a probable bottom coming soon. The exact timing isn't always easy, but I view sentiment much like a rubber band. The more and more bearish sentiment readings get, the more the rubber band is pulled back. When it's finally released, it's a POWERFUL snap back! With this in mind, check out the 5-day moving average of the $CPCE:
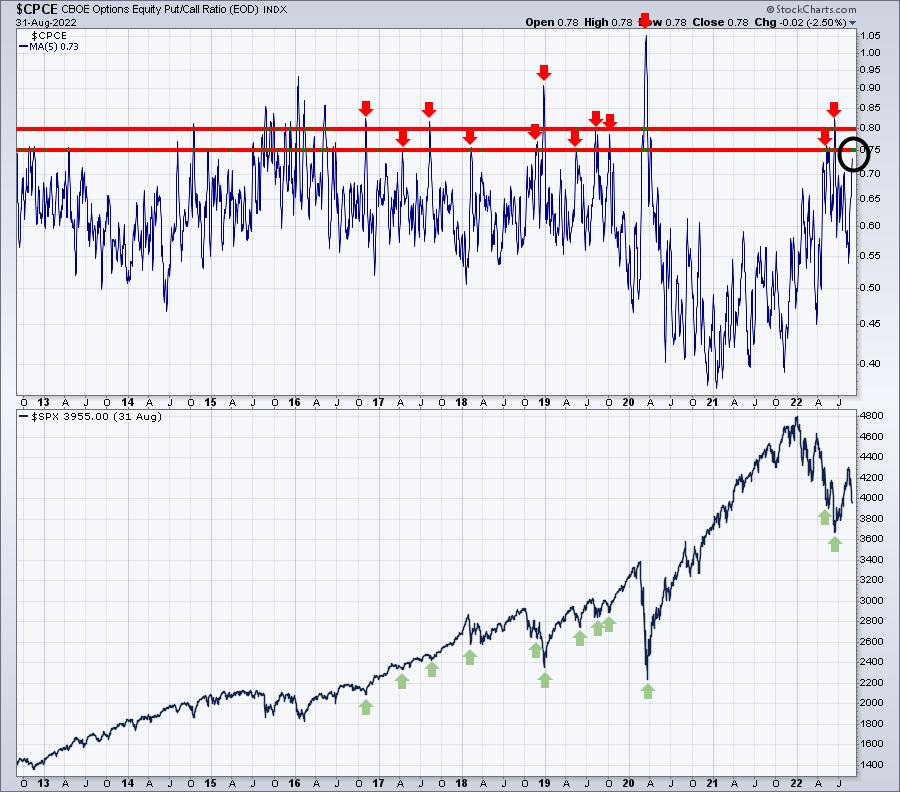
We're not quite at the .75 to .80 range where we can begin to look for major bottoms, but today's reading will replace the .59 reading from last Thursday. I suspect that, by today's close, we could see this ratio in that .75-.80 range. Keep in mind that the ratio could go higher and we could see a further selloff, so there's still plenty of risk, but history tells us that we are nearing what will likely be a very important low - even if it's just for a week or two.
Here's the initial readings this morning of the equity-only put-call ratio at cboe.com:

According to the cboe.com website, the first two half-hour readings show more equity puts than equity calls being traded. Bears are EVERYWHERE!
I believe the proverbial carpet is about to pulled out from under them, though again, timing the exact bottom is very difficult. I'm looking for a reversing candle. If we get it today, I'll likely be very aggressive, jumping into the leveraged QLD (tracks the NASDAQ 100 at a 2 to 1 clip). I tend to be more aggressive when I'm smelling what could be a significant bottom - even if only a short-term bottom.
Manipulation
It hasn't ended. As I've discussed on many prior occasions, I believe that the selling at the open and during the first 90 minutes of trading, followed by much more bullish action over the balance of the day is a signal that Wall Street is accumulating shares during declines like the one we're seeing right now. Could I be wrong? Sure, but I believe what I believe. I pass along the information that I'm seeing and then you can make your own calls that are best in your own personal situation.
A hallmark of 2022 has been rough gap downs and morning periods, followed by buying/accumulation in the afternoons. I have an Excel spreadsheet that accounts for this. This price action isn't really up for discussion. It's real and 100% FACT. However, everyone may interpret the data as they wish. Here is how the QQQ (ETF that tracks NASDAQ 100) has performed from its closing high on November 19th through yesterday's close:
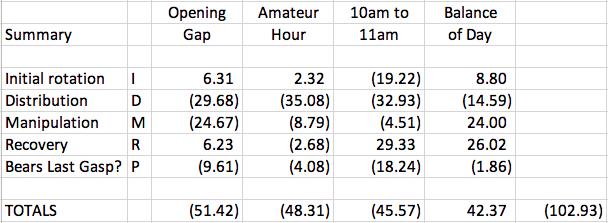
Here are the timeframes attributable to each grouping above:
- Initial rotation (11/19-1/3)
- Distribution (1/4-5/20)
- Manipulation (5/21-6/17*)
- Recovery (6/18-8/15)
- Bears Last Gasp (8/16-current)
The asterisk (*) above was the mid-June market bottom.
While the QQQ has fallen 102 points during the entire period, it's actually traded higher by 42 bucks during the 11am-4pm period. That is absolutely STUNNING to me! But if you notice, even this period was weak during the "Distribution" phase from January 4th through May 20th. Look at today's action. A gap lower and further morning selling. Will we see that afternoon accumulation really kick in later today? I don't know, but I'll be watching closely.
My Trading Strategy
First, let me discuss big picture. During the first half of 2022, I profited from the selling at times, because I felt a cyclical bear market was beginning in January. I stuck with that strategy until mid-June, when rotational signals suggested to me that Wall Street had turned much more offensive. I called the bottom and I have since traded using bull market strategies. I will not short (other than possibly max pain periods, when appropriate) during what I consider to be the resumption of a SECULAR bull market. Last Saturday, during our event, I provided two possible scenarios that I see going forward. The first showed the S&P 500 moving back down to test 3900 and reversing back higher. The second showed a double bottom to test the mid-June low. I still favor the former, but here's what I showed at the event:
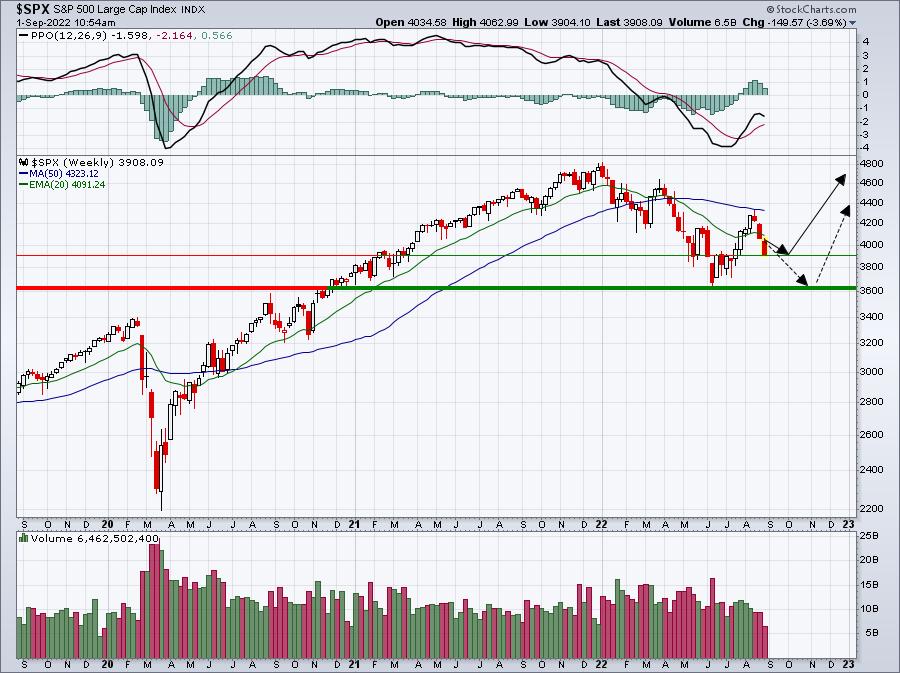
The 3920 test is coming very quickly, but it's also coming with signs of a significant reversal at any time. If we keep selling off all day long, then the odds of a double bottom increase immensely. I don't believe it's going to happen, but we need to keep all possibilities on the table and try to remain objective.
Here's the bullish case: The extreme bearishness helps us mark a key bottom today or possibly tomorrow. We break the recent string of lower daily highs and lower daily lows. That could potentially give us a relief rally back to 4100 or the declining 20-day EMA, at which time we would re-evaluate.
Obviously, the bearish case is that the extreme bearish continues, the 5-day moving average of the CPCE soars well above .80 and the current selling accelerates, rapidly sending the S&P 500 back down to the June low. Also, my key sustainability ratios (XLY:XLP, QQQ:SPY, IWF:IWD) are all trading down with the S&P 500, so they are not providing any bullish signals at this point.
If you're cautiously watching from the sidelines and want to mitigate risk, I'd wait to see either (1) a LONG tail to the downside with a BIG afternoon reversal, or (2) a higher intraday high (vs. prior day). Sitting our during a big decline is not a bad strategy at all. Personally, I'd be very careful shorting, but that's a decision each of us can make.
I'll be watching closely today to see which scenario - bottom at 3900 or a retest of 3636 - is most likely in the days and weeks ahead.
Happy trading!
Tom