
EB Daily Market Report - Friday, September 2, 2022
Market Closed on Monday, September 5th
The U.S. financial markets will be closed on Monday in observance of Labor Day. We will be closed as well, so there will be no Trading Places LIVE show, EB Digest newsletter, or Daily Market Report. We'll be back to business as usual on Tuesday, September 6th.
I want to wish everyone a safe and relaxing holiday weekend!
Executive Market Summary
- Futures were flat when the August nonfarm payrolls were released at 8:30am ET
- We saw an initial bullish reaction, but selling kicked in within an hour
- Crude oil ($WTIC, +0.36%) and most commodities are relatively flat on the session
- The 10-year treasury yield ($TNX) is down 7 basis points to 3.19% as traders move into bonds after the big jobs report
- Energy (XLE, +2.08%) is the only sector in positive territory, perhaps responding to slightly higher crude oil
- Meanwhile, communication services (XLC, -1.90%) is the worst-performing sector as internet stocks ($DJUSNS, -2.05%) struggle on a relative basis
- Automobiles ($DJUSAU, -2.22%) are the worst industry group within consumer discretionary (XLY, -1.08%)
- We're seeing selling just past 3:30pm with our major indices threatening to close at or near today's low
Market Outlook
I tend to be bullish and optimistic as the U.S. stock market rises more often than it falls. Barring a breakdown of the June 17th low on the S&P 500 at 3636, I'll be mostly bullish with the biggest exception typically around options expiration week. We saw a brutal two-hour period from noon to 2pm ET today, but I do see a couple positives nonetheless.
First, we finally printed a higher intraday high this morning to break the recent losing streak. While the weakness intraday was evident, we also have thus far printed a higher low. I would like to see a decent finish today to feel better about the action. Here's a quick look at the S&P 500 on a 10-day 15-minute chart to highlight the technical change of character:
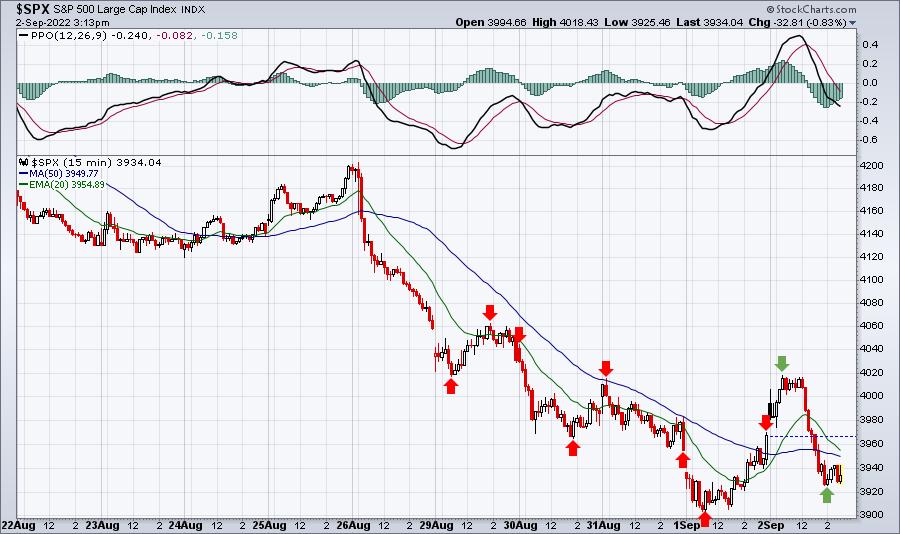
Of course, there's still 30 minutes left in today's session and a quick selloff could alter this technical change, but, at a minimum, the higher daily high is a positive.
Next, I laid out two possible alternatives for the course of the S&P 500 through year end. Obviously, the S&P 500 could do something other than these two, but these are the two that I believe are the highest probabilities. The first, more bullish forecast, has the S&P 500 holding onto gap support from July 26th at 3921. Yesterday's hammer candlestick saw an intraday move beneath this support level with a close above:
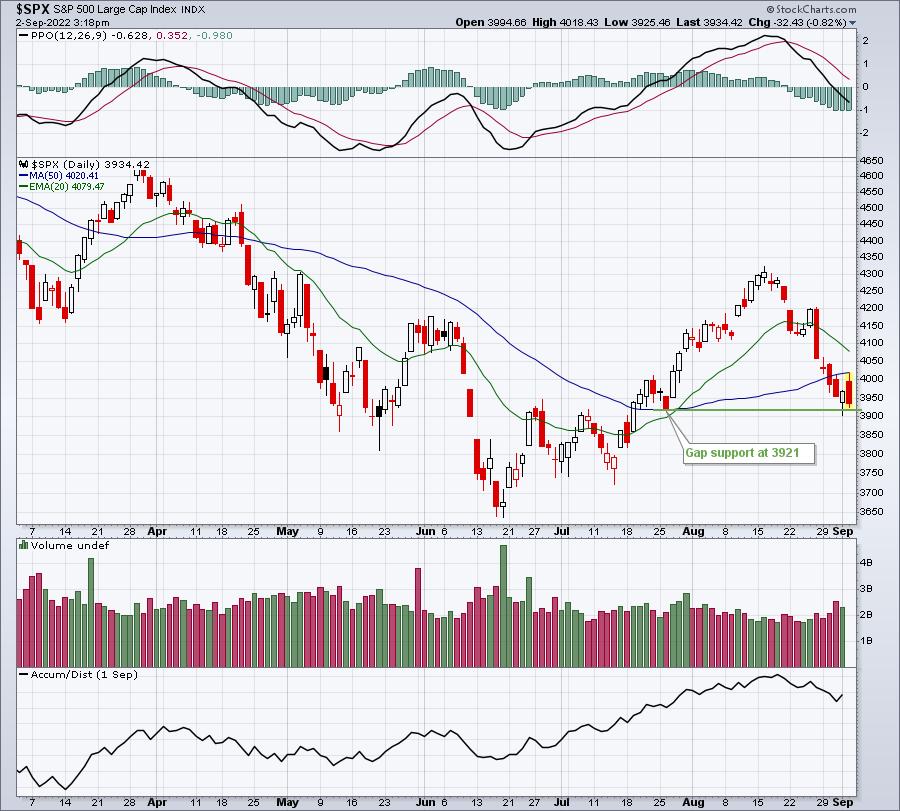
There are other gap support levels beneath 3921 that could provide support, but I look at the 3921 level as a stronger support level as it was the first support found after clearing both the 20-day EMA and 50-day SMA resistance. I've shown previously that prior cyclical bear market bottoms and subsequent rallies have shown this first pullback to the 20-day EMA to have particular significance.
Sector/Industry Focus
I'm following sentiment very, very closely. One thing I found very interesting yesterday was the fact that the half hourly put call ratios remained mostly above 1.0 on Thursday afternoon, even though prices rallied strongly. As the selling kicked in earlier today, the bears were at it again. Sentiment is SOOO different now than it was at December 31st and this bearish behavior is necessary to kick off the next bullish cycle.
Here were the equity only put call ratio readings yesterday:
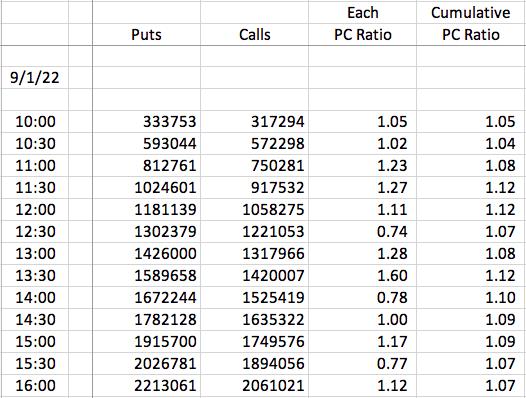
The "Each PC Ratio" column has a formula that calculates the put call ratio for ONLY the past half hour. The cumulative reading smooths out the readings throughout the session.
If interested, here's what we've seen so far today:
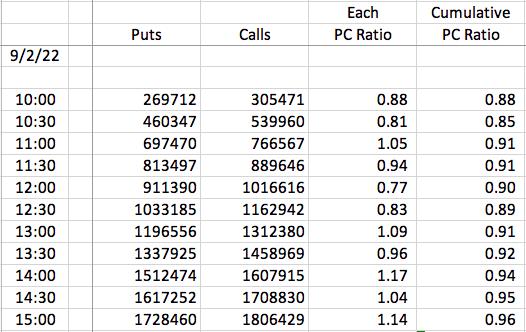
All of these readings over 1.0 tell us just how bearish market participants have become. This does NOT mean we cannot go lower and it certainly doesn't mean that the June 17th low cannot be broken. But bearish sentiment historically marks MAJOR bottoms.
I'll continue to monitor sentiment and keep you posted.
ChartLists/Strategies
If you'd like to be aggressive, you can run scans against our key ChartLists - especially the Strong Earnings ChartList (SECL). I'd simply make sure that you keep stops in place as we're witnessing increasing and extreme volatility and prices can fall rapidly as occurred earlier today. The opportunities for profit are high, but just make sure you consider the higher risks as well.
Earnings Reports
Here are the key earnings reports for the next two days, featuring stocks with market caps of more than $10 billion. I also include several companies with market caps below $10 billion. Finally, any portfolio stocks that will be reporting results are highlighted in BOLD. If you decide to hold a stock into earnings, please understand the significant short-term risk that you are taking. Please be sure to check for earnings dates for any companies you own or are considering owning.
Friday, September 2:
None
Tuesday, September 6:
PATH, GTLB, GWRE, HQY, COUP
Economic Reports
August nonfarm payrolls: 315,000 (actual) vs. 293,000 (estimate)
August private payrolls: 308,000 (actual) vs. 280,000 (estimate)
August unemployment rate: 3.7% (actual) vs. 3.5% (estimate)
August average hourly earnings: +0.3% (actual) vs. +0.4% (estimate)
July factory orders: -1.0% (actual) vs. +0.2% (estimate)
Happy trading!
Tom