
EB Daily Market Report - Tuesday, September 6, 2022
ChartLists Updated
Many of our ChartLists have been updated - either over the weekend or earlier today. Here is the list:
- Strong Earnings ChartList (SECL)
- Strong Future Earnings ChartList (SFECL)
- Raised Guidance ChartList (RGCL)
- Bullish Trifecta ChartList (BTCL)
- Earnings AD ChartList (EADCL)
- Short Squeeze ChartList (SSCL)
- September Seasonality ChartList (SEASCL)
They should be updated and ready for download/viewing from our website. However, if not, they should be ready later today.
Executive Market Summary
- Futures were higher overnight, though they fell back some as the open approached
- It's been a crazy volatile day as big swings in both directions have taken place intraday
- The 3900-3921 support level is fairly significant, resulting in today's tug o war
- Bitcoin ($BTCUSD, -3.77%) is leading cryptocurrencies lower; etherium ($ETHUSD, -1.10%) is performing a bit better on a relative basis
- Commodities are mostly near their respective flat lines today, including crude oil ($WTIC, -0.06%)
- The 10-year treasury yield ($TNX) has surged 15 basis points to 3.34%, no doubt adding to the volatility in equities
- The Volatility Index ($VIX) is up 5.5% to 26.87; 28 has held as resistance since early July, so a break above it would be a bonus for the bears
- Sectors are mixed, with defensive sectors performing best; real estate (XLRE, +0.97%) is today's best performer
- Meanwhile, communication services (XLC, -1.36%) is in its familiar position - last among all sectors
- Renewable energy ($DWCREE, +1.30%) is having a decent day with Enphase Energy (ENPH, +5.56%) leading the S&P 500
Market Outlook
I'm still seeing sustainability ratios that remain fairly strong. Yes, they've fallen back with the S&P 500, but that's normal. I still see further rotation into key aggressive areas and that makes it very difficult for me to be bearish and simply "follow the crowd". There are plenty of bears out there right now, but I'm not one. I continue to believe that the mid-June low will prove to be the bottom. Time will tell, for sure.
Anyhow, check out the benchmark S&P 500 with my 3 key ratios below it:
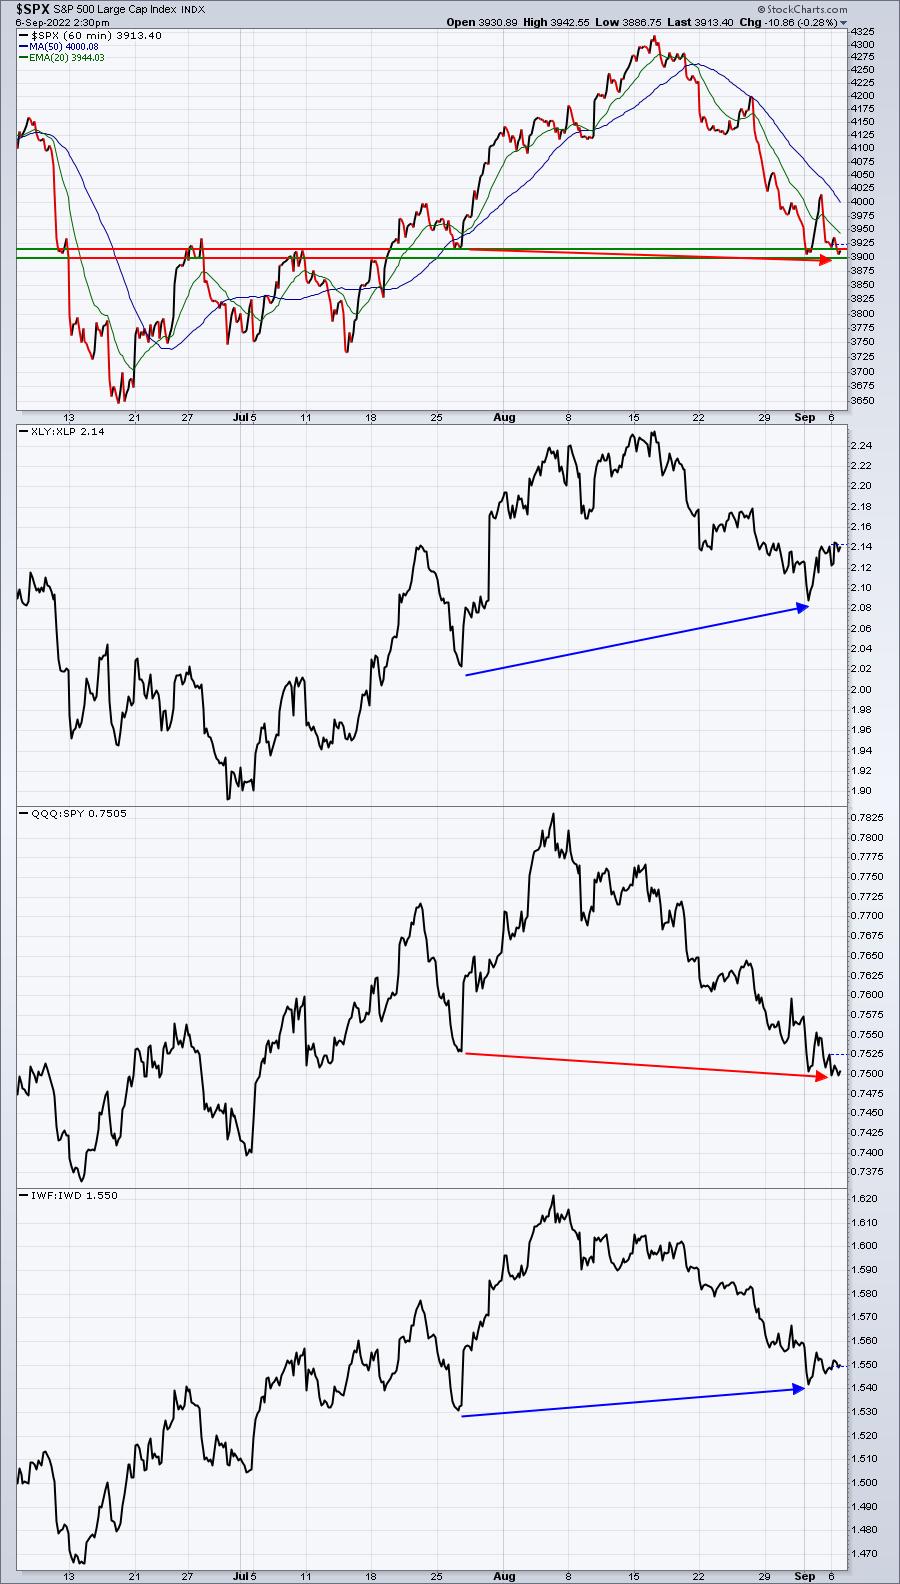
The only one of my three ratios setting a new low since its July low is the QQQ:SPY. That's following the S&P 500 lower, but my theory here is quite simple. Semiconductors ($DJUSSC) have been a HUGE drag on the NASDAQ, more so than on the S&P 500. Check out the DJUSSC chart:
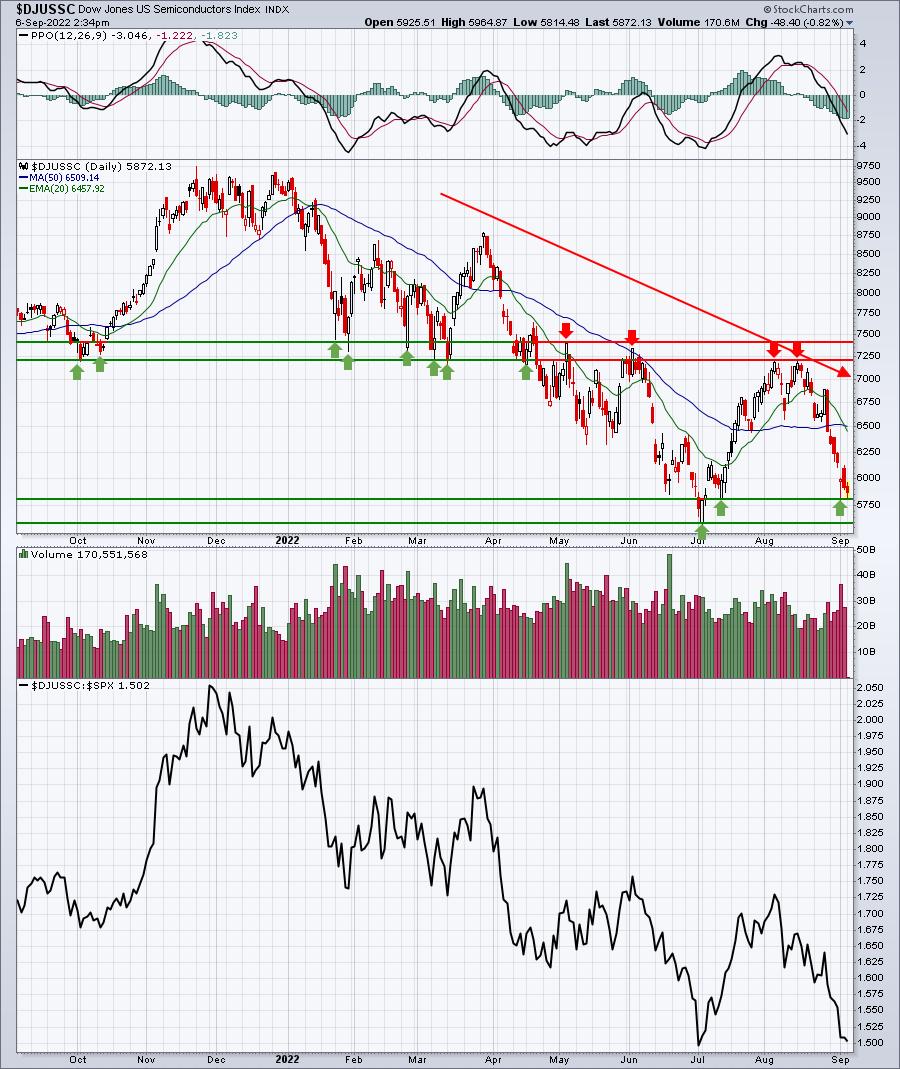
If we see an absolute price breakdown beneath the July low, then it's going to be very difficult for the S&P 500 and NASDAQ to hold key support levels. Semiconductors are a very important group. But as the group nears those key price support levels from early July, remember that September has actually been pretty kind to semiconductors throughout this secular bull market (since 2013):
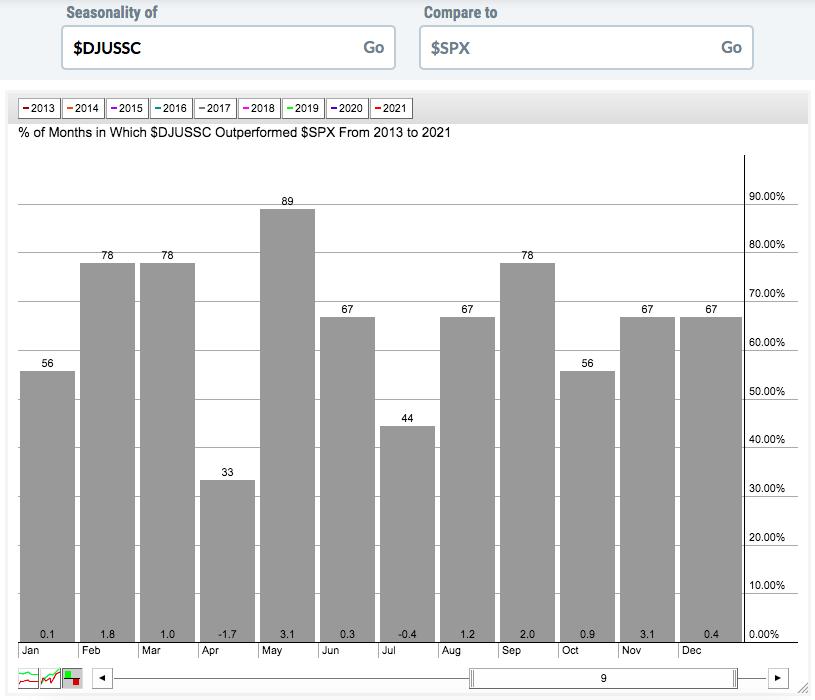
In the 9 year period from 2013 to 2021, the DJUSSC outperformed the S&P 500 during 7 of those 9 Septembers and averaged outperforming by 2 full percentage points. So if a breakdown occurs, respect it. But also, be sure to keep in mind that September hasn't been that bad of a month for this important industry group.
Sector/Industry Focus
Heavy construction ($DJUSHV) is a part of industrials (XLI), which has been one of the strongest sectors of late, breaking to a fresh new 52-week relative high vs. the benchmark S&P 500. The DJUSHV has been the best-performing industry group within industrials over the past 6 months. It's also been the second-best industry among industrials over the past 1-month and 3-month periods. It's pulled back over the past few weeks - like just about every other industry group - but it's now testing key price support:
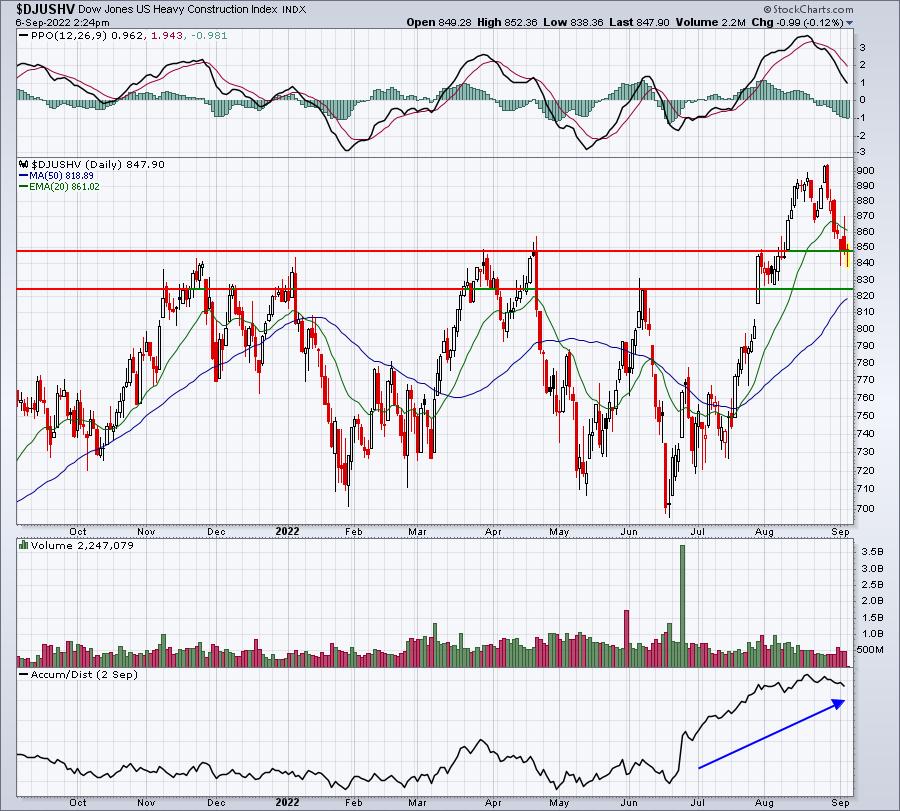
It's not shown above, and it probably goes without saying, but the relative strength in the DJUSHV has been extremely bullish throughout 2022.
ChartLists/Strategies
We provided a handful of Model Trades in the EB Weekly Portfolio Report that was published last night. Here is a quick update on these stocks:
NET: Thus far, it's holding onto gap support at 58.43. I bought NET this morning and will hold it unless it closes today beneath 58.30 (50-day SMA). I'm keeping a tight stop, knowing I can always re-enter if market conditions improve.
GSHD: Traded slightly beneath 47.70 support, but currently is back above that level, trading at 48.25. A close beneath 47.70 and it's a SELL for us. Again, a tight stop is used because of market conditions. We don't want to get caught in a big downdraft.
TTMI: We indicated that a pullback to 14.76 would trigger a buy. Well, it didn't quite reach it, but it did hit a low of 14.81. Remember, any CLOSE beneath 14.76 and we'd exit. Tight stop.
WOLF: We had two entries, the first at the current price (open was 108.91). Our second entry was a test of the 20-day EMA. We nearly hit it as the low of 105.40 came quite close. We will maintain a closing stop of 103.58.
RUN: This was a carryover from last week's Model Trades. If you recall, we liked entry at 133 and 130, with a closing stop beneath its 50-day SMA. It was down this morning, but never triggered the second entry at 30. It has since recovered nicely and is up more than 6% on a down day in the market. Looks good so far.
Today is a BIG day technically, in my opinion. We're currently in a major support zone for the S&P 500 between 3900 (price support) - 3921 (gap support). Given the high equity only put call ratios (CPCE), I have personally begun building a position in the QLD, anticipating a reversal at any time. It's a VERY AGGRESSIVE trade and certainly not for everyone. But I've witnessed high CPCE readings in the past and know that unusually high readings normally translate into market reversals. If we finish on or near our lows today, I'll exit the QLD. I do NOT want to take any chances with leverage with a market breakdown.
Earnings Reports
Here are the key earnings reports for the next two days, featuring stocks with market caps of more than $10 billion. I also include several companies with market caps below $10 billion. Finally, any portfolio stocks that will be reporting results are highlighted in BOLD. If you decide to hold a stock into earnings, please understand the significant short-term risk that you are taking. Please be sure to check for earnings dates for any companies you own or are considering owning.
Tuesday, September 6:
PATH, GTLB, GWRE, HQY, COUP
Wednesday, September 7:
NIO, CPRT, GME, CASY, DSGX, ASO, ASAN, KFY, VRNT, AVAV, PLAY, AEO, PHR
Economic Reports
August PMI composite: 44.6 (actual) vs. 45.0 (estimate)
August ISM services index: 56.9 (actual) vs. 55.4 (estimate)
Happy trading!
Tom