
EB Daily Market Report - Thursday, September 8, 2022
Correction - Monthly Short Report
Earlier today, I mentioned that I would feature 3 short squeeze stocks for September, then proceeded to show 2 charts. I only had 2 charts, so the "3" was simply a typo. I apologize for any confusion.
Executive Market Summary
- Futures were weak as the new trading day began, but buyers stepped in; in the past hour, however, sellers have returned - another volatile session as the market looks for short-term direction
- Initial jobless claims came in well below expectations for the second straight week
- Crude oil ($WTIC, +1.49%) has rebounded, although you wouldn't know it from energy stocks (XLE, -0.54%)
- The 10-year treasury yield ($TNX) opened lower, but has since been trending higher, likely adding to today's stock volatility
- Health care (XLV, +0.68%) and financials (XLF, +0.48%) are leading today, while communication services (XLC, -1.29%) and consumer staples (XLP, -1.25%) are the primary laggards
- Biotechnology stocks ($DJUSBT, +1.69%) are having a particularly strong session, testing their overhead 50-day SMA in the process; a breakout would be bullish
- McCormick & Co (MKC, -7.72%), a food products company, is the S&P 500's worst performer today, breaking beneath recent price lows
Market Outlook
We have two BIG economic reports on the horizon and to be released next week. The Fed says it's become more data dependent, so they'll be looking at all evidence at their September 20-21 meeting. In the meantime, we will have the August CPI and August PPI released on Tuesday and Wednesday of next week, respectively. These are not the only reports and evidence the Fed will look at, but these are two biggies.
Here's how the current charts look for both Core CPI and Core PPI (bottom panels show the 1-year rate of change):
CPI:
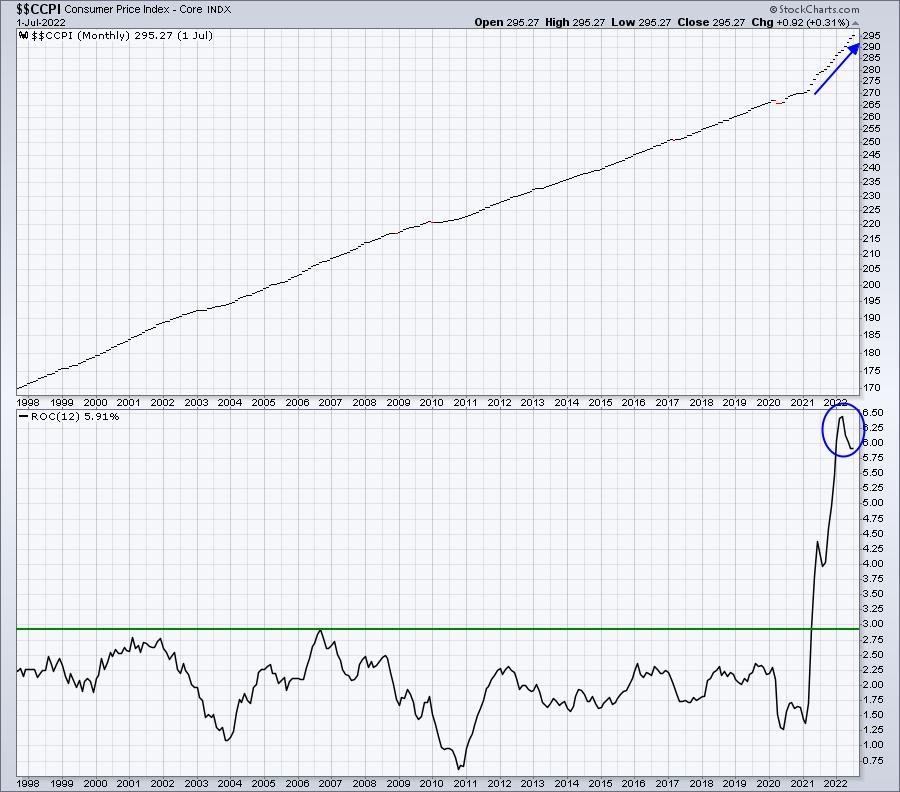
You can see the acceleration in the Core CPI each month for the past 18 months. That's led us to the current annual Core Inflation rate of approximately 6%. The Fed clearly wants to see the recent drop in this annual rate continue.
PPI:
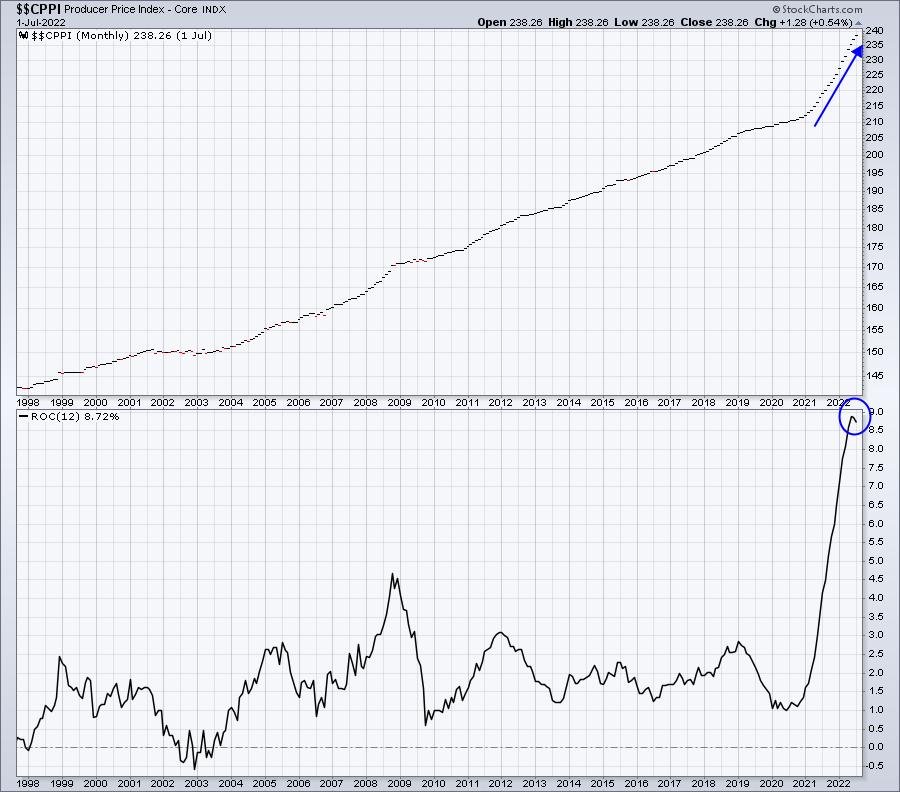
One key factor in the headline PPI number is crude oil prices and they're calculated from the 12th of July through the 12th of August. That was roughly a 3% decline, which should help to keep this number relatively low.
As always, it's not just the numbers. It also comes down to Wall Street's reaction. Do they buy or sell on the news? We'll find out next week, just ahead of the next Fed meeting and decision.
Sector/Industry Focus
Consumer discretionary (XLY) typically leads bull market rallies, so seeing more and more industries in this sector turn bullish would obviously be a great signal for a further advance in the benchmark S&P 500. Here are a few industries and key levels to watch for bullish confirmation:
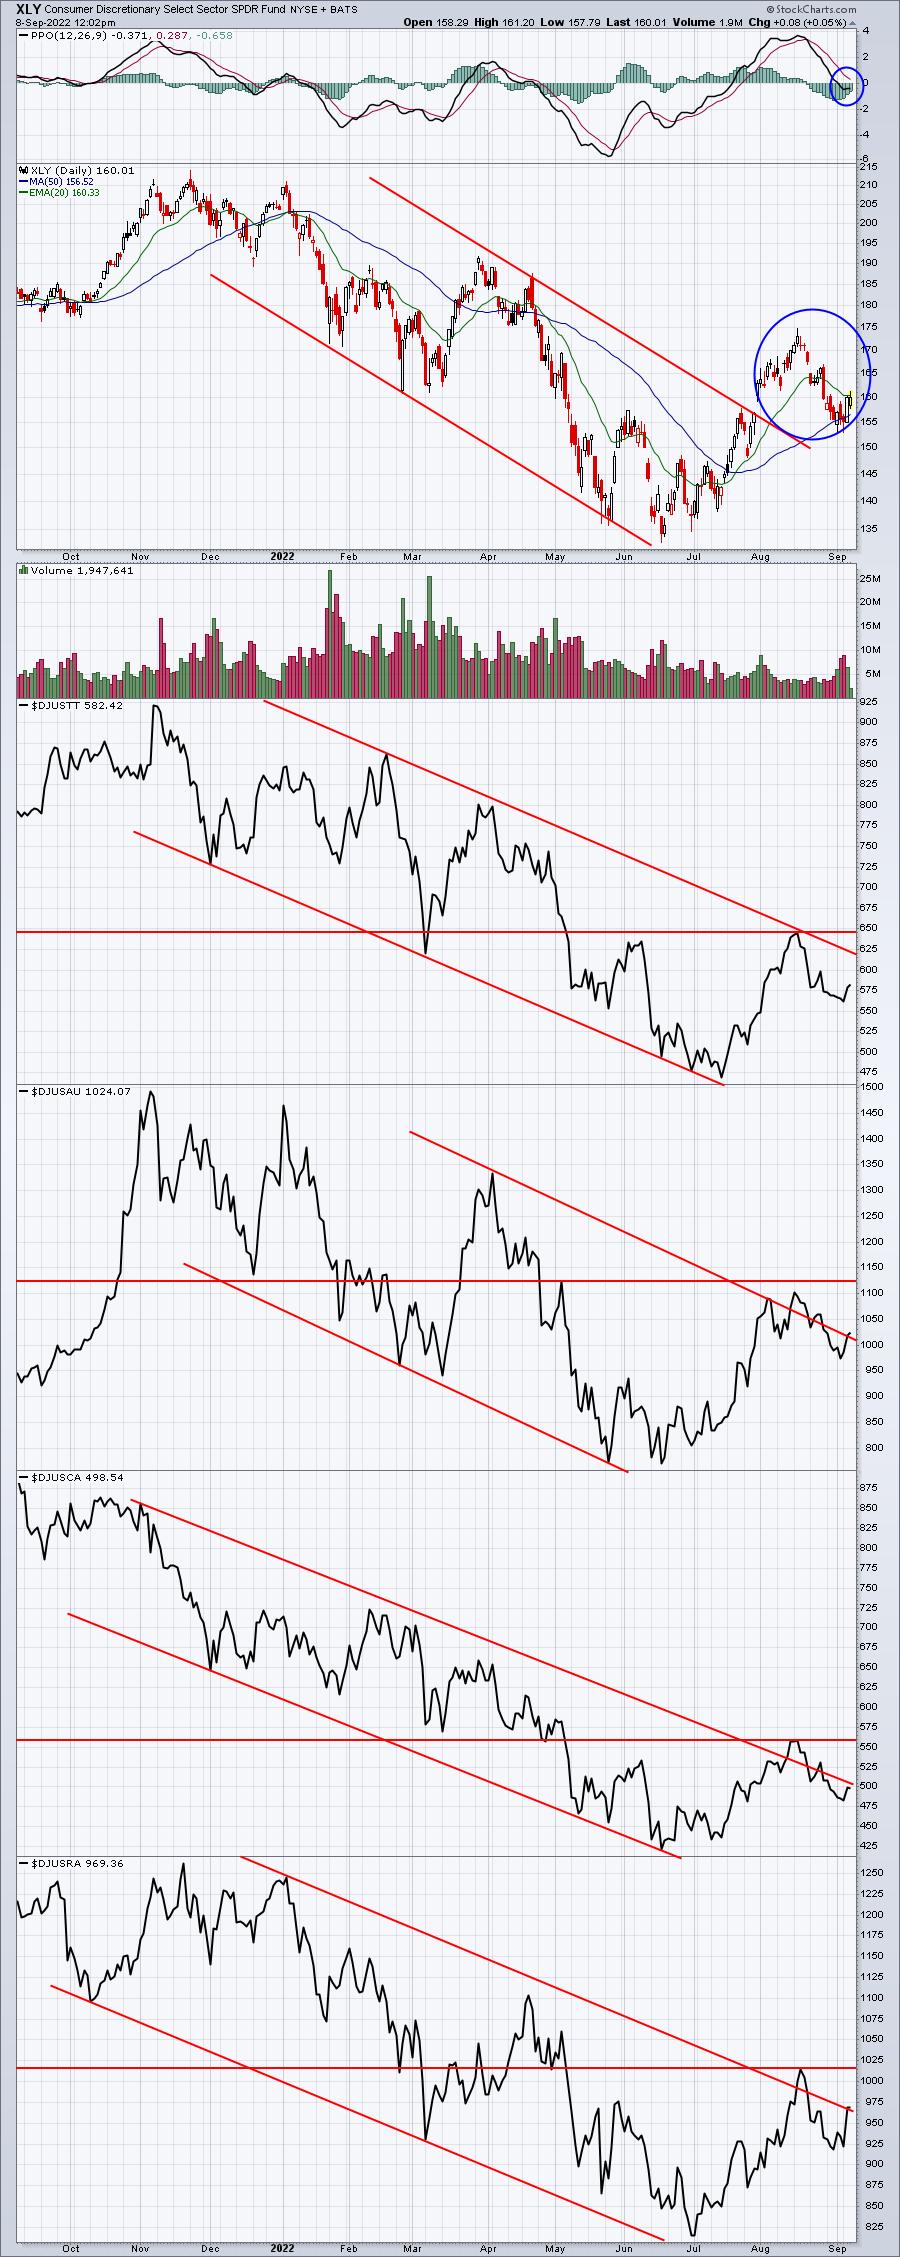
The XLY broke its down channel about 5 weeks ago, but several industry groups within have not. Or they've kinda sorta tried to break, but there's been no follow through. I added a price resistance line for each group. The more that can break above these resistance lines, the more bullish I'm going to be.
ChartLists/Strategies
Our Model Trades have all performed well, but RUN has really taken off, hitting 39 earlier this morning. Keep in mind our initial entry was 33, so in less than two weeks, we've seen an 18% move. Consider taking profits. Technically, the key CLOSING resistance level is 37.38. A close above could lead to further gains, but I'd take the guaranteed return now. You can always re-enter at some point in the future.
Also, PGNY was mentioned yesterday as a trade candidate and it's gained nearly 7.5% today. There will always be high reward to low risk trades, so don't be shy about taking profits and building your portfolio balance.
One stock that I saw earlier today that looks like a potential breakout is Pinterest, Inc. (PINS). Check out the chart:
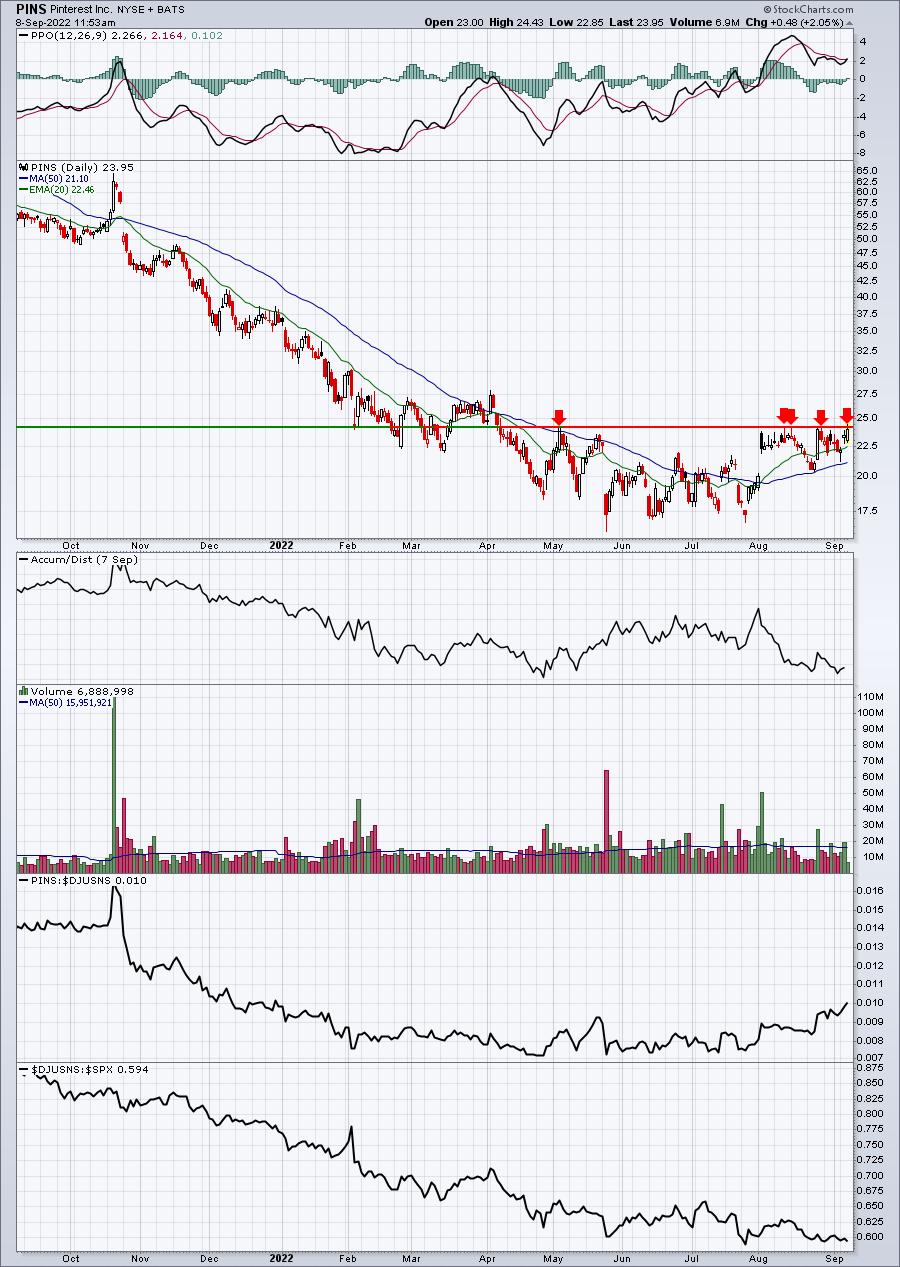
24.20 is key closing resistance. I bought earlier at 24.21 as it broke above resistance, but was stopped out a short time later when it dropped back beneath 24.00. Just wanted to mention in the event it moves back up again later and you like to trade breakouts. Volume is moderate, it would be much more bullish if volume expands to accompany this price breakout.
Earnings Reports
Here are the key earnings reports for the next two days, featuring stocks with market caps of more than $10 billion. I also include several companies with market caps below $10 billion. Finally, any portfolio stocks that will be reporting results are highlighted in BOLD. If you decide to hold a stock into earnings, please understand the significant short-term risk that you are taking. Please be sure to check for earnings dates for any companies you own or are considering owning.
Thursday, September 8:
ZS, DOCU, BILI, RH, FCEL
Friday, September 9:
KR, WDH, ABM
Economic Reports
Initial jobless claims: 222,000 (actual) vs. 240,000 (estimate)
Happy trading!
Tom