
EB Daily Market Report - Friday, September 9, 2022
Executive Market Summary
- Futures were higher overnight and our major indices gapped up at the opening bell
- Bitcoin ($BTCUSD, +10.45%) is having a stellar day, along with other cryptocurrencies
- Crude oil ($WTIC, +4.07%) has spiked back to $87 per barrel
- The 10-year treasury yield ($TNX) is up 1 basis point to 3.30% as financial markets await next week's key inflationary data
- The large-cap growth vs. value ratio (IWF:IWD) remains depressed, likely due to the recent surge in the TNX
- The more important XLY:XLP ratio, however, is nearing its mid-August high, a very bullish development
- Communication services (XLC, +2.51%) is showing leadership and testing its 20-day EMA; all 11 sectors are higher on the session with defensive groups trailing
- The S&P 500 has cleared its 50-day SMA and 20-day EMA so far; we'll see how it closes
- Kroger (KR, +5.83%) is among today's best-performing S&P 500 stocks after reporting earnings that exceeded expectations
Market Outlook
One key test today is whether the growth-oriented NASDAQ can clear its two key moving averages on the close. If we're truly downtrending, this resistance should hold:
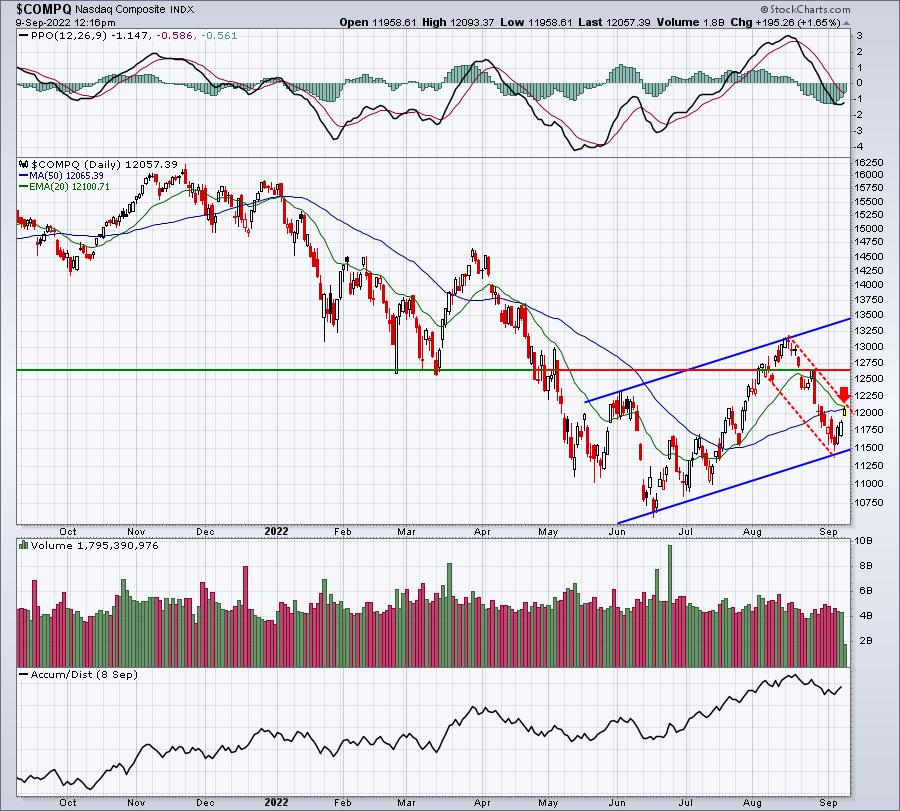
Are you bullish or bearish? Depending on which side of that fence you're on, you can use the above chart to support your case. The short-term down channel (red-dotted lines) and the test of the 20-day EMA and 50-day SMA are being tested simultaneously. The bearish argument is that this test fails and we resume that downtrend. The bullish argument is "GREAT, let's pull back and get closer to that intermediate-term uptrend." In my opinion, a strong finish this afternoon and a close above these moving averages would be short-term bullish.
Personally, I closed out my leveraged position in the QLD as we tested these two moving averages. In my opinion, the risk shifts at this important test as the bulls must prove they have the buying power to push through resistance. I like to trade the QLD when I believe the odds of an uptrend are skewed in my favor. Currently, we need to respect these moving averages until we move (and close) above them. And remember - the CPI and PPI reports are coming up next Tuesday and Wednesday, respectively. Your guess is as good as mine as to what the stock market will do leading up to this report....and after. A second month of tame inflation data would likely result in an explosion to the upside, but that's just my opinion.
Sector/Industry Focus
Transportation stocks ($TRAN) have not performed well and certainly are NOT providing any kind of bullish signal. Those who have a bearish mindset would use the transports as support for their stance, and I wouldn't blame them. Not only have we seen poor absolute performance in transports, their relative performance vs. utilities is very bearish as well:
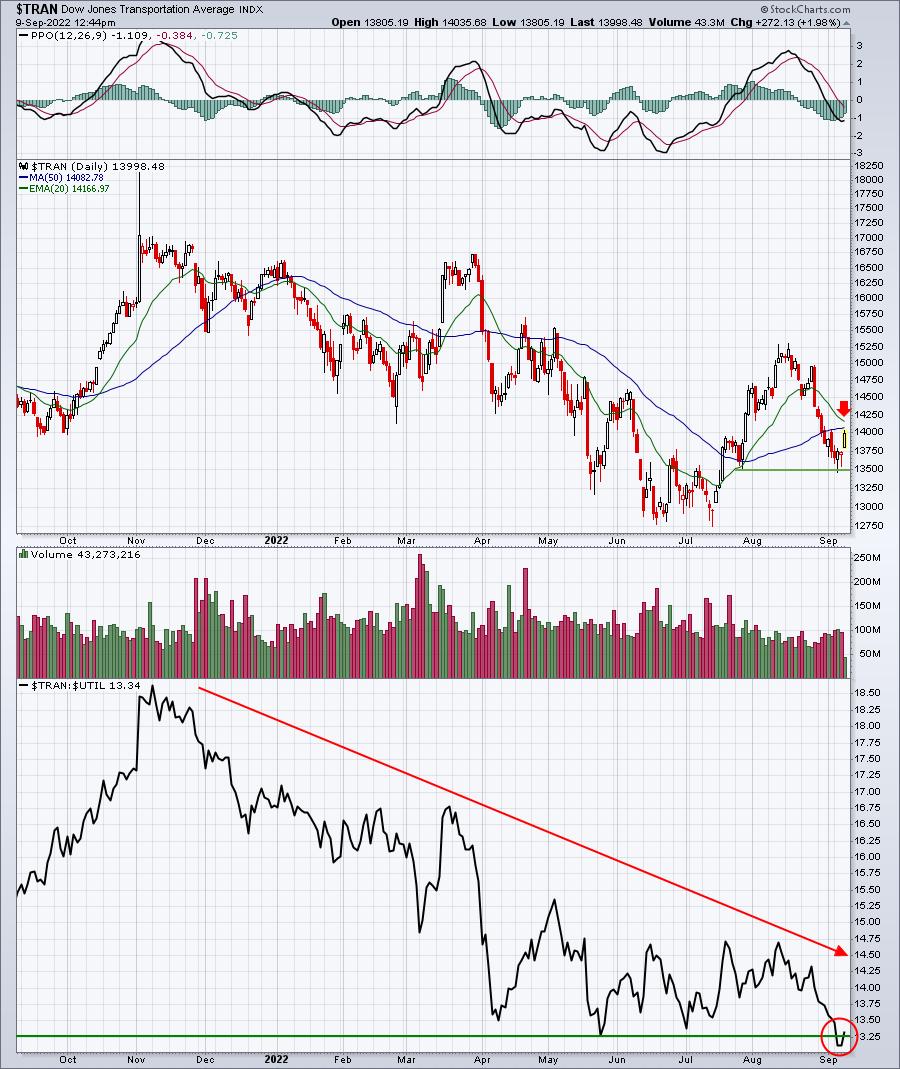
That bottom panel highlights that transportation/utilities relationship and it normally moves in the same direction as the S&P 500. As the S&P 500 rallies, this ratio is setting a new low. There have been plenty of periods where we see inverse correlation, which is why I focus much more of my attention on the XLY:XLP ratio. The positive correlation on that ratio is much clearer.
Nonetheless, I'll feel much better about the stock market environment when this TRAN:UTIL ratio starts trending higher. I also would like to see the TRAN hold recent price support near 13500.
ChartLists/Strategies
We're happy with our Model Trades this week. Currently, the NASDAQ is testing its 20-day EMA and 50-day SMA from underneath. While I believe we'll eventually break above these moving averages, it certainly makes sense to take profits with strong short-term overhead resistance staring at us. So, here is a quick summary of the Model Trades from last week and how they've performed:
RUN - was a carryover from the week prior. We entered at 33 and suggested taking solid profits yesterday. If you held, it did breakout above closing resistance at 37.38 and volume confirmed this move. I'd watch closing support at 37.38 as a possible closing stop. Or if you want to hold it longer and give it more room, then I'd use the rising 20-day EMA.
NET - opened Tuesday morning at 58.32. It's currently at 66.88, which is a $8.56 gain, or 14.68% profit. It certainly has room to move much higher, but we're taking the profit - great trade!
GSHD - 47.70 support triggered a buy on Tuesday. I mentioned the 20-day EMA and/or the 50-day SMA as a target. It hit the 20-day EMA today at 55.01, so GSHD is closed out with a 13.29% profit.
TTMI - 14.76 gap support was our entry level, which triggered Wednesday. I initially suggested a target in the 15.55-15.73 range. It's at 15.53 right now and we'll be happy to take profits right here. TTMI trade results in a 5.22% profit.
WOLF - I suggested two entries - current price and then a 20-day EMA test. Tuesday's open was 108.91. It traded lower that day and rebounded almost squarely off the 20-day EMA, which was approximately 105.50 at the time. I suggested a target here of 120-122. WOLF hit 116.24 earlier today and is now at 114.36. We'll book profits at the current price, which is up 7.16 from the average entry of 107.20, resulting in a nice profit of 6.68%.
The NASDAQ is right up against its 20-day EMA and 50-day SMA. I'd like to see how we close today before adding additional trades. A close above these moving averages would be bullish, while the alternative could mark a short-term top. I'll provide a few Model Trades this weekend in our EB Weekly Portfolio Report.
Earnings Reports
Here are the key earnings reports for the next two days, featuring stocks with market caps of more than $10 billion. I also include several companies with market caps below $10 billion. Finally, any portfolio stocks that will be reporting results are highlighted in BOLD. If you decide to hold a stock into earnings, please understand the significant short-term risk that you are taking. Please be sure to check for earnings dates for any companies you own or are considering owning.
Friday, September 9:
KR, WDH, ABM
Monday, September 12:
ORCL, BRZE
Economic Reports
July wholesale inventories: +0.6% (actual) vs. +0.8% (estimate)
Happy trading!
Tom