
EB Daily Market Report - Monday, September 12, 2022
Max Pain Event
Over the weekend, Erin Webber sent out max pain calculations for a large number of stocks and for both the SPY and QQQ. Unlike recent months, the back and forth nature of the market since the mid-June low has left little net in-the-money call/put premium on the table. Therefore, I'm not expecting a huge move in either direction based on max pain. However, there are still plenty of individual stocks that could be highly impacted this week and we'll talk about those tomorrow at our monthly Max Pain event. It will begin at 4:30pm ET. I hope to see you there!
Executive Market Summary
- Futures were higher this morning and our major indices have been mostly strong since the opening bell
- Cryptocurrencies are mixed, though, as bitcoin ($BTCUSD, +3.20%) and etherium ($ETHUSD, -2.33%) are heading in opposite directions
- Commodities are higher on the session as crude oil ($WTIC, +1.53%) spikes above $88 per barrel, while silver ($SILVER) has jumped 5.53%
- The 10-year treasury yield ($TNX) is up 4 basis points to 3.36%, not far from its 3.48% 11-year high set in June
- All 11 sectors are higher again today, the same as Friday; energy (XLE, +1.61%) is providing leadership given the spike in the price of crude
- Consumer discretionary (XLY, +1.25%) is easily beating consumer staples (XLP, +0.46%) today as that XLY:XLP ratio remains strong and bullish
- Technology (XLK, +1.50%) is strengthening as Apple (AAPL, +3.80%) soars back above both its 20-day EMA and 50-day SMA
- Steel ($DJUSST, -1.86%) is having a notably weak day as it continues to attempt to breakout above the 485-493 resistance area; today's high was 486 prior to its 15-point reversal to 471
Market Outlook
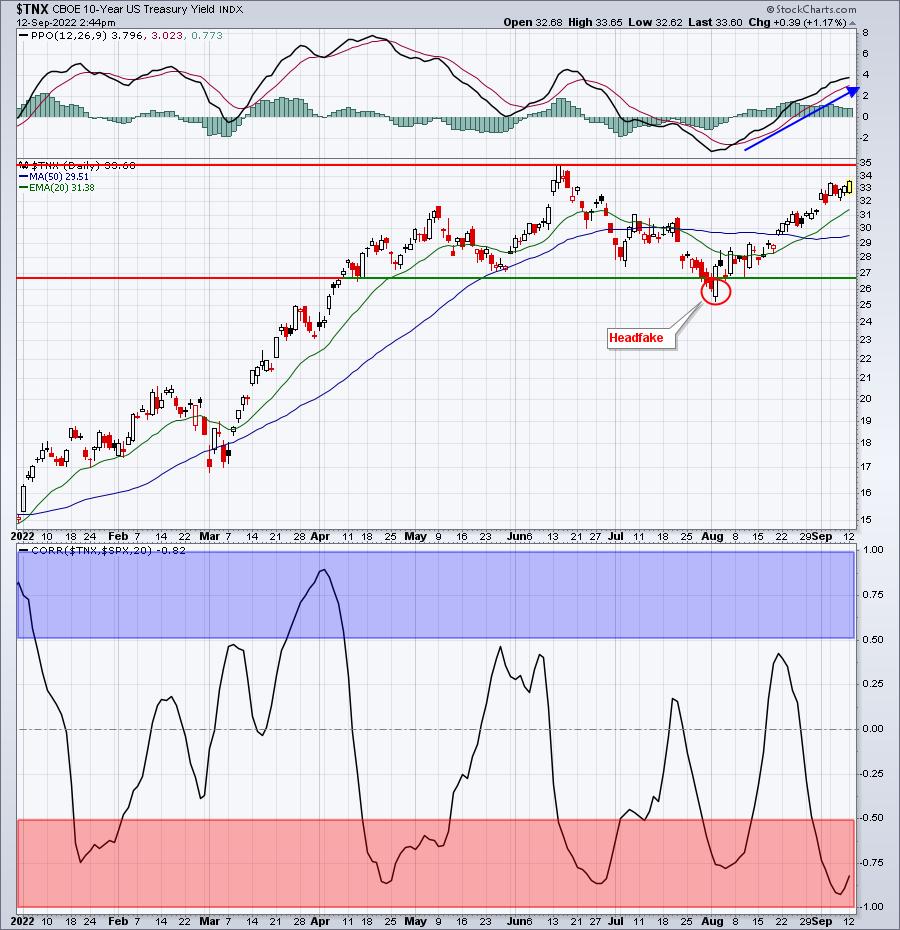
There's been a lot of selling in bonds the past 5-6 weeks as we head into two key inflation reports the next two days. Tomorrow morning, the August CPI will be released, and on Wednesday morning, we'll get the August PPI. If we look only at 2022, I think it's fairly obvious that the S&P 500 and the 10-year treasury yield ($TNX) have been moving inversely to one another. For visual proof, let's check out the TNX, with the correlation coefficient in the bottom panel:
Sector/Industry Focus
I trade the leveraged ETFs from time to time. The QQQ tracks the NASDAQ 100 on a 1 to 1 basis. But if you want to potentially increase your return, you can do so with the QLD, which also tracks the NASDAQ 100, but at a 2 to 1 clip. For even more leverage, you can consider the TQQQ, which tracks the NASDAQ 100 at a 3 to 1 clip. There are two rules you should be aware of, however, before you consider trading leveraged ETFs at all.
Rule #1 - Leveraged ETF returns erode over time.
The following is a chart of the NASDAQ 100, with the QQQ, QLD and TQQQ plotted beneath it on a year-t0-date basis:
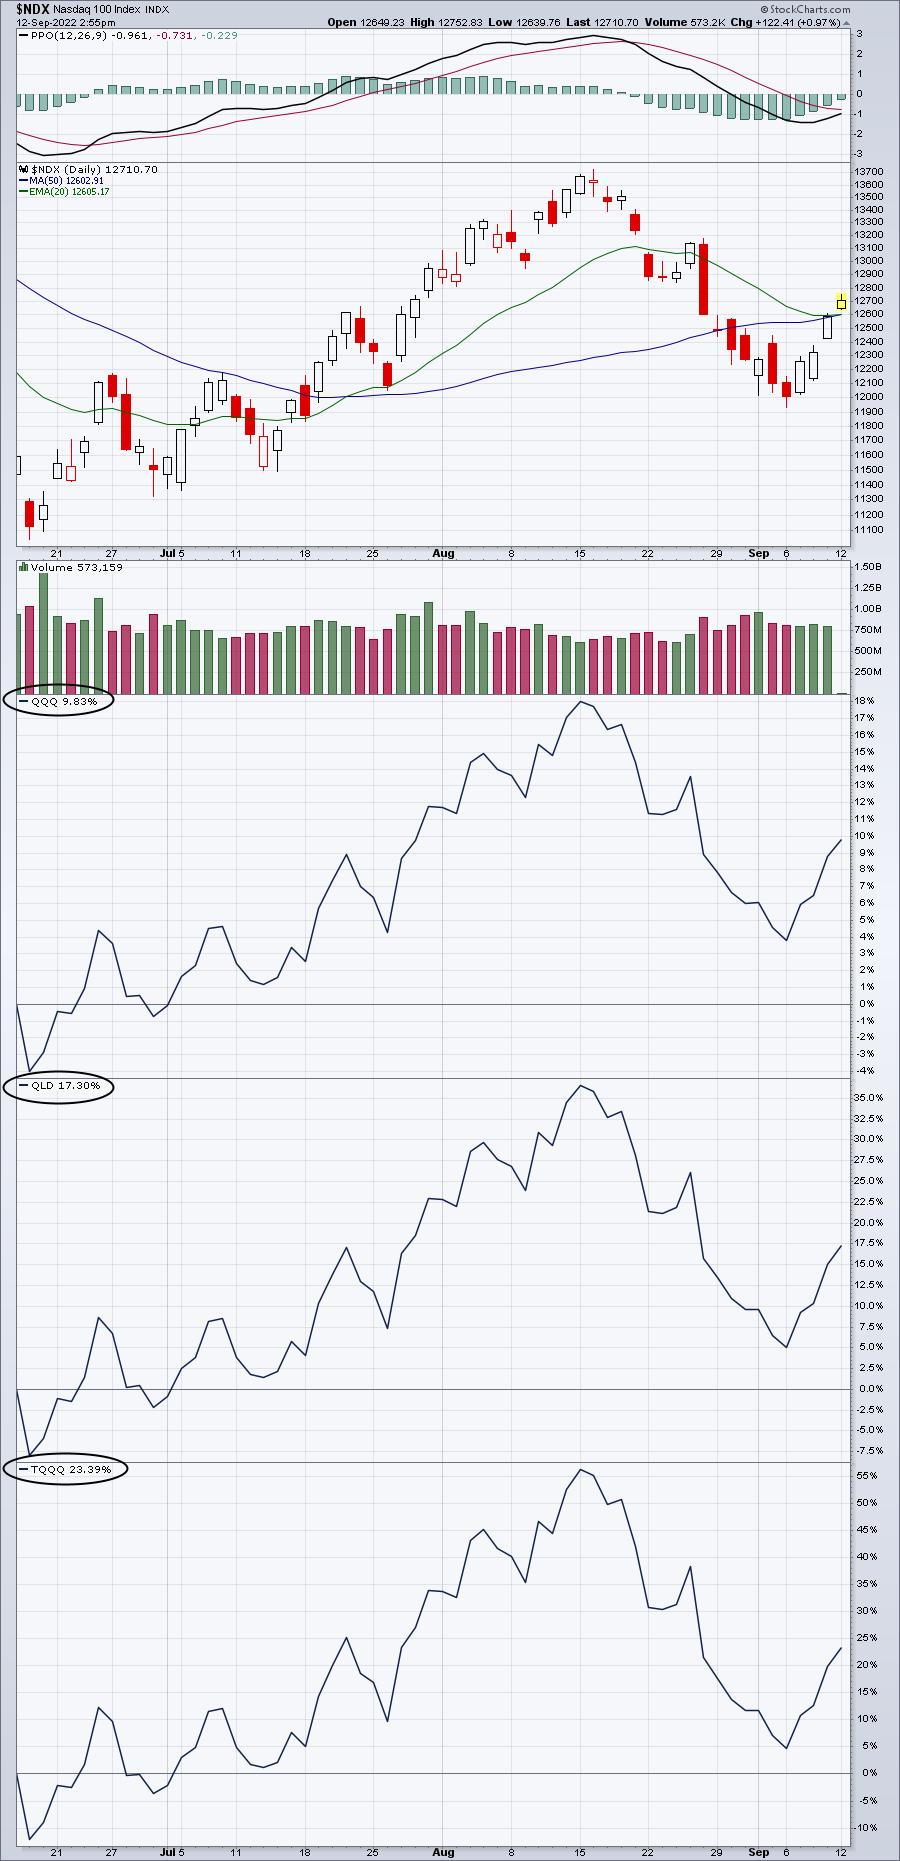
In a perfect world, the QLD should be exactly double the QQQ's return of 9.83% and the TQQQ should be exactly triple. That would result in the QLD being up 19.66% and the TQQQ being up 29.49%. But check out their actual returns of 17.30% and 23.39%. The difference can be chalked up to erosion over time.
But check out Rule #2.
Rule #2 - Leveraged ETFs produce greater than 2 to 1 or 3 to 1 returns while trending due to their compounding nature.
If you time your entry correctly and only trade leveraged ETFs during an extended trend, you'll make more than double or triple. Let's look at this same chart, except let's assume we timed our entry perfectly back on March 14th at the close and held through the close on March 29th. That uptrend was mostly unabated. Check out what those returns would have looked like:
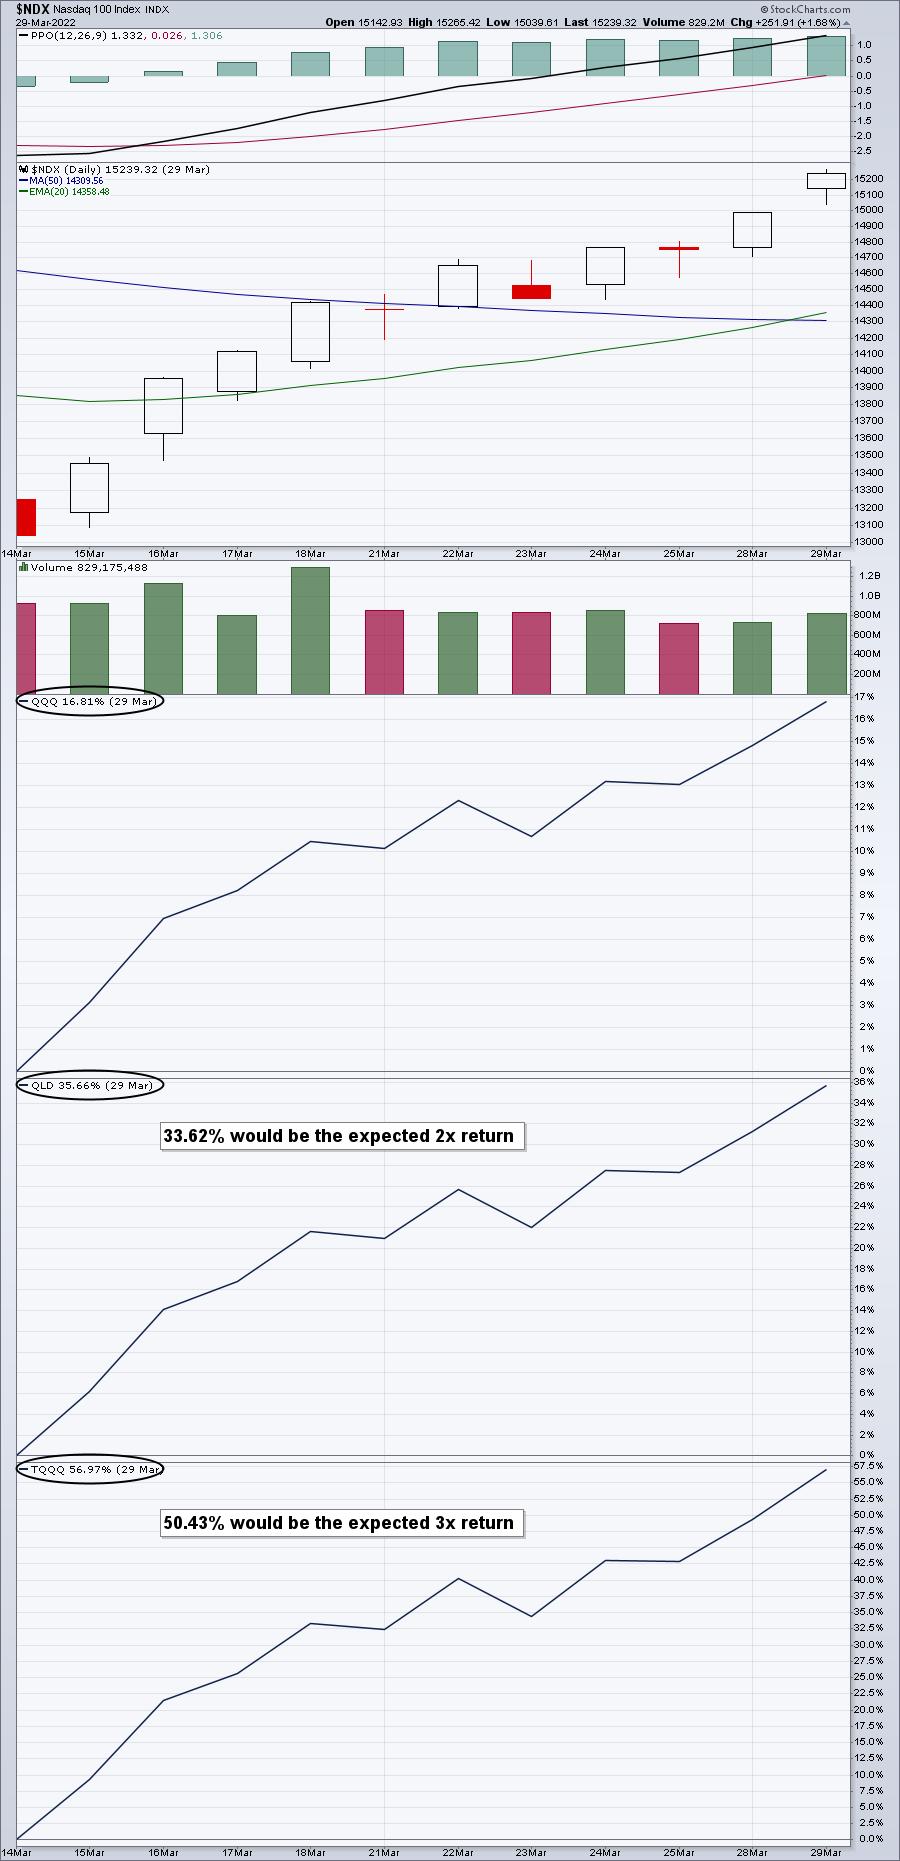
The TQQQ would have tripled your return PLUS you'd have earned a BONUS return of another 6.54% simply due to the compounding nature of these leveraged ETFs. They attempt to double and triple DAILY returns. Well, if the underlying investment continues moving higher, compounding actually works in your favor. THIS is why I don't hold leveraged ETFs for long periods of time. They work even better if you can ride them when they're heading in your direction. It's the reason why I don't want to own them ahead of the big inflation reports this week. Even if we lose ground initially, but then return to new highs later, I end up losing my BONUS return as the compounding nature is lost.
ChartLists/Strategies
I'm sitting on my hands ahead of the inflation reports the next two days. I like cash. If we gap higher, there'll still be plenty of days ahead to trade on the long side and make money. I want to manage my risk, but how can I do that if I'm heavily long awaiting these key reports that could have major impacts on both the bond and stock markets.
It's similar to holding into an earnings report. Yes, you can be a hero. But, you can also be a zero.
Earnings Reports
Here are the key earnings reports for the next two days, featuring stocks with market caps of more than $10 billion. I also include several companies with market caps below $10 billion. Finally, any portfolio stocks that will be reporting results are highlighted in BOLD. If you decide to hold a stock into earnings, please understand the significant short-term risk that you are taking. Please be sure to check for earnings dates for any companies you own or are considering owning.
Monday, September 12:
ORCL, BRZE
Tuesday, September 13:
None
Economic Reports
None
Happy trading!
Tom