
EB Daily Market Report - Tuesday, September 13, 2022
Max Pain Event
Our September Max Pain event will be held today at 4:30pm ET. We'll take a look at current price vs. max pain on key ETFs that track our major indices, as well as review several individual stocks that could move later this week and/or into next week based on their max pain levels.
I hope you can join me in a few hours!
Executive Market Summary
- Futures were solidly higher....until the August CPI was released at 8:30am ET; that report was much hotter than anticipated, sending yields higher and stock futures lower
- There was nearly a 4% reversal in the QQQ from 8:30am to 9:30am as higher inflation prospects spooked all equities, but particularly growth-oriented stocks
- August Core CPI jumped 0.6%, double the widely-anticipated 0.3% increase
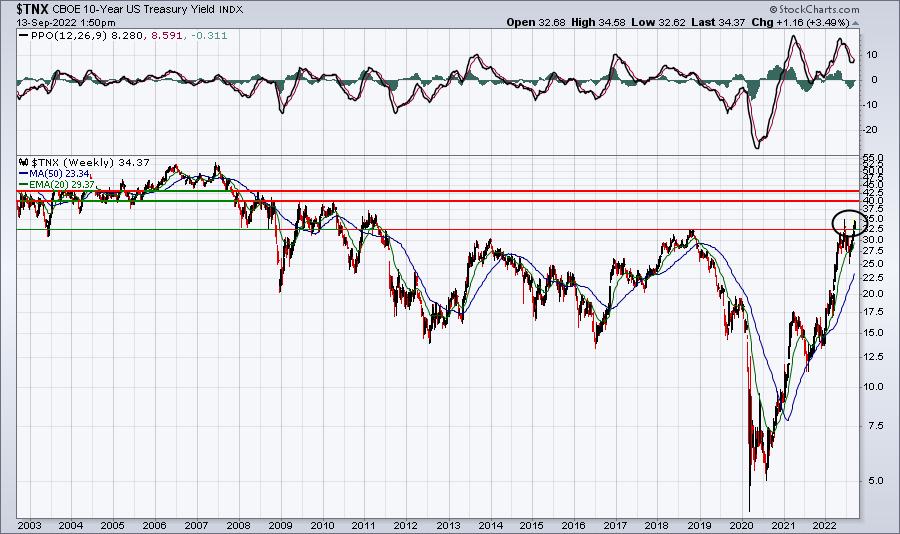
- The 10-year treasury yield ($TNX) is up 6 basis points to 3.42%, after briefly approaching 3.46%; the 11-year high was set on June 14th at 3.48%
- The 3 aggressive sectors - communication services (XLC, -3.83%), technology (XLK, -3.80%), and consumer discretionary (XLY, -3.60%) - are clearly the hardest hit
- Cryptocurrencies are also under significant selling pressure, with bitcoin ($BTCUSD, -7.06%) approaching 20000 again
- Gold ($GOLD, -1.32%) continues to show little bullishness, despite the higher-than-expected CPI this morning
- Nearly all commodities are lower, including crude oil ($WTIC, -1.05%)
- All 30 Dow Jones component stocks are lower today, led by Intel (INTC, -5.10%)
Market Outlook
Bond traders are selling again today, with corresponding yields rising, as higher-than-expected inflation at the consumer level weighs. We need to watch key 10-year treasury yield ($TNX) resistance at 3.48%, the highest level since 2011. The S&P 500 has been trading up and/or down based primarily on what treasury yields are doing. Today, that TNX is up to 3.43% and moved within a whisker of key 3.48% yield resistance. Here's a 12-year weekly chart to illustrate the significance:
Listen, rates are still at historically-low levels, so I believe the stock market can weather the short-term storm and eventually trade back to all-time highs later this year, or more likely, during Q1 2023. But right at this moment, the potential for higher interest rates is making it tough sledding for the bulls. That could continue right through the end of September, so we need to respect that and remain cautious.
Sector/Industry Focus
I need to make one correction from yesterday's DMR in this Sector/Industry section. I indicated that I was provided a look at the leveraged ETFs on a "year-to-date" basis. However, that chart was from the June 17th bottom through Monday's close. My apologies.
Apple, Inc. (AAPL) is the largest holding in both the S&P 500 and NASDAQ 100. To say it was having a bad day would be a significant understatement. After seeing increasing volume on Monday that accompanied a key breakout above both its 20-day EMA and 50-day SMA, AAPL has done a complete reversal. It gapped beneath both moving averages and the selling has only escalated. The PPO behavior is quite bearish, suggesting this move to the downside likely has legs. Check out this chart:
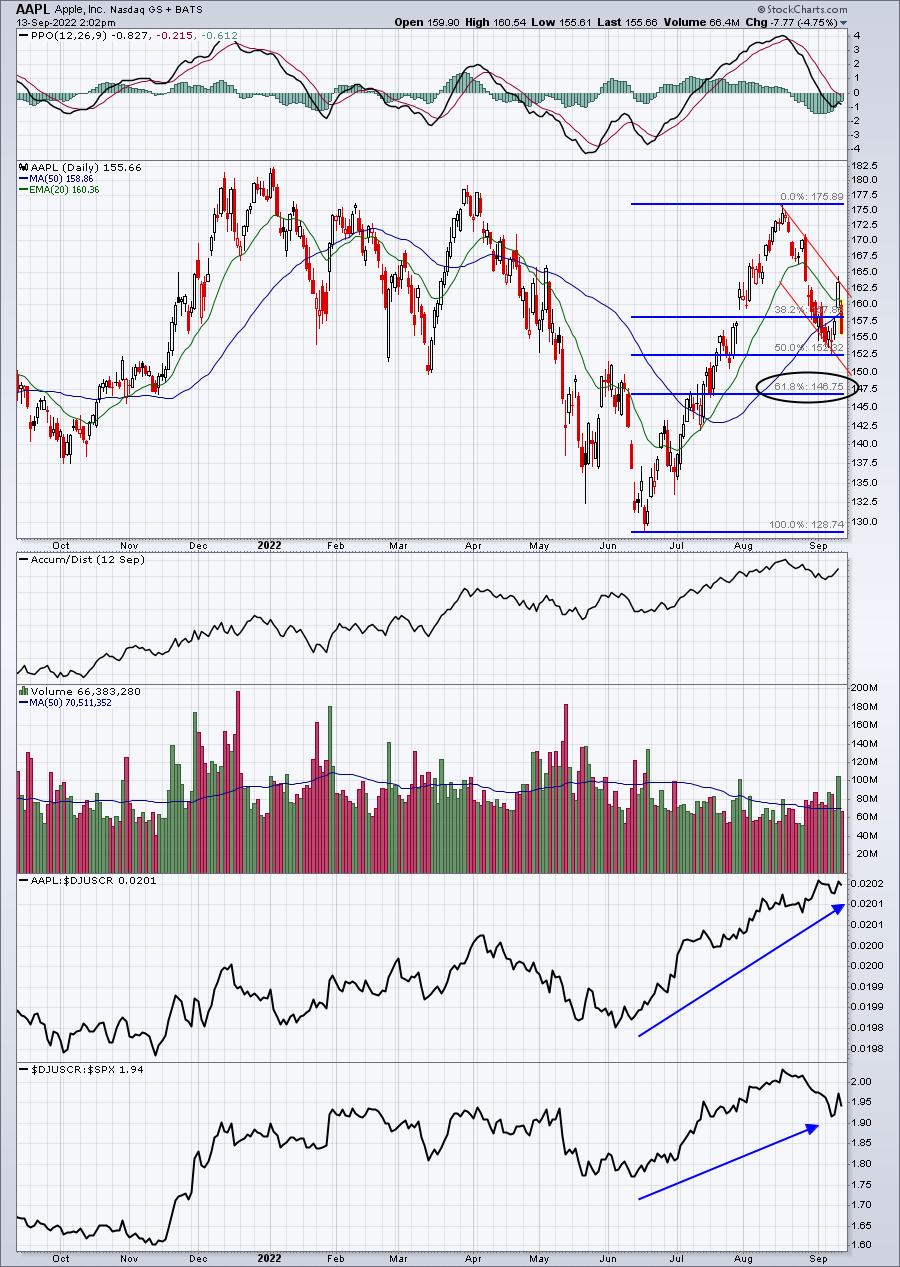
Call it a gut feeling, if you'd like, but I sense that AAPL is going to fall back to its Fibonacci 61.8% retracement level, which is currently at 146.75.
I remain bullish in the long-term regarding AAPL and the overall market, but one scenario I discussed was more selling and consolidation through September. Based on today's CPI report, the 10-year treasury yield, and the Wall Street's reaction (risk-on assets getting hammered), I do see further short-term warning signs that we need to respect.
ChartLists/Strategies
Sitting on my hands into today's CPI report may have proven skillful, or perhaps fortuitous, but it simply underscores how risky trading on either side can be when such a big report is released. I view consumer inflation to be more important than producer inflation, but nonetheless, we still have another key inflation report tomorrow morning in the form of August PPI. The big difference, of course, is that this time we'll have to approach it with price action back beneath both key moving averages.
I'm remaining in cash for now, so have no trading candidates for today.
Earnings Reports
Here are the key earnings reports for the next two days, featuring stocks with market caps of more than $10 billion. I also include several companies with market caps below $10 billion. Finally, any portfolio stocks that will be reporting results are highlighted in BOLD. If you decide to hold a stock into earnings, please understand the significant short-term risk that you are taking. Please be sure to check for earnings dates for any companies you own or are considering owning.
Tuesday, September 13:
None
Wednesday, September 14:
None
Economic Reports
August CPI: +0.1% (actual) vs. -0.1% (estimate)
August Core CPI: +0.6% (actual) vs. +0.3% (estimate)
Happy trading!
Tom