
EB Daily Market Report - Special Update - Friday, September 16, 2022
Today is options-expiration day and I just wanted to share two things with you briefly.
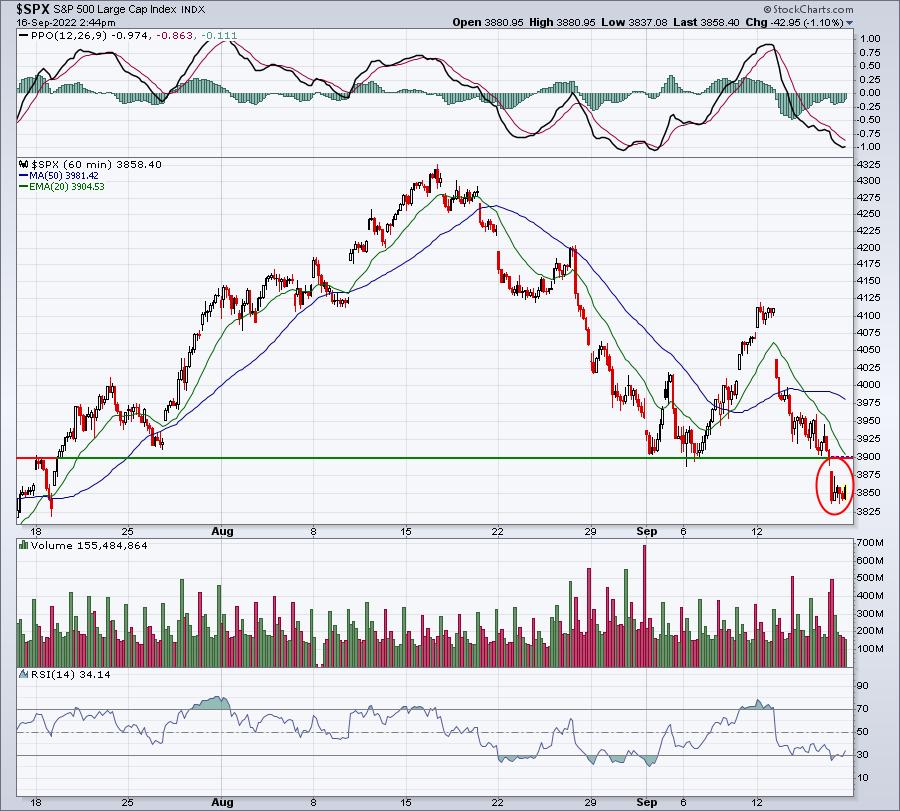
First, the S&P 500 has broken down beneath 3900. Barring a late-afternoon reversal, this is not good technical action. It does not change my opinion about the mid-June low being the most important low, but it does suggest a much higher probability that we'll see that June low retested. Here's the current chart, highlighting the breakdown today:
The second thing I'd like to share is an update of the manipulation analysis that I've been doing. The purpose of this work is to help me (and you) understand the likelihood of a continuing move to the downside. In other words, are we being manipulated lower with gaps and morning weakness, or is this true distribution throughout the trading day, where we should expect lower prices? I've updated my work on the QQQ through yesterday's close. I'll show you how the QQQ has traded via gaps, morning action (from 9:30am to 11am), and balance of the day (11am to 4pm). Here's that breakdown:
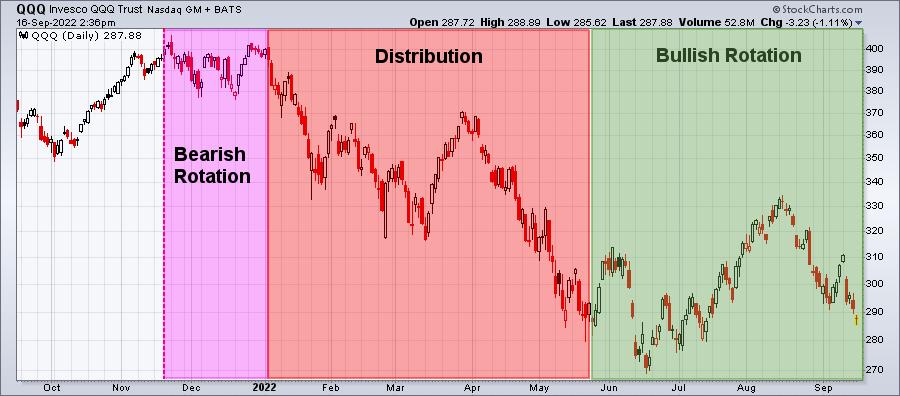
Bearish Rotation Phase, 11/19/21 - 1/3/22
During this phase, the QQQ dropped from 402.20 to 400.41, a fall of just 1.79. However, here's how the QQQ traded during this period, broken down by time of the day:
- Opening gaps: +6.31
- 9:30am-10:00am: +2.32
- 10:00am-11:00am: -19.22
- 11:00am-4:00pm: +8.80
My take: Opening gaps and early morning action enticed traders to continue buying stocks, while market makers unloaded shares for institutional trading. That's how the S&P 500 was able to produce one final high in early January 2022 - with significant rotation to defensive areas.
Distribution Phase, 1/4-5/20
This was the phase of REAL selling, where we saw the QQQ tumble from 400.41 to 288.13, a drop of 112.28. Institutions, hedge funds and others cannot get out of positions without actually selling. When large positions are sold, we're going to see that show up during the trading day. Here's how the QQQ traded during this distribution phase, by time of the day:
- Opening gaps: -29.68
- 9:30am-10:00am: -35.08
- 10:00am-11:00am: -32.93
- 11:00am-4:00pm: -14.59
My take: I think it's pretty clear. Selling took place throughout all parts of the trading day. It's difficult to draw any bullish conclusions from this data, which is one (of many) reason why I remained bearish through the first half of the year.
Bullish Rotation Phase, 5/21/22 - 9/15/22
During this phase, the QQQ has rallied and stumbled, but overall has gained a scant 2.97. The intraday trading has been, at a minimum, very suspicious. Check out the breakdown of this period on an intraday basis:
- Opening gaps: -34.82
- 9:30am-10:00am: -12.02
- 10:00am-11:00am: +3.77
- 11:00am-4:00pm: +46.04
My take: In November and December 2021, we saw morning gaps higher and early morning strength, followed by afternoon distribution (selling) as Wall Street prepared for the bloodbath of 2022. That was followed by a clear period of much more selling. But since May 20th, we've seen continuing weakness at the opening bell and during the very early morning action, while it appears that many buyers surface after the first 30 minutes of trading. I believe shares are being accumulated by Wall Street ahead of a big rally later this year and into 2023. They began bailing before the cyclical bear market began and now they're accumulating ahead of what I think will be a big rally.
To visualize the 3 phases that I discussed above, check out this chart of the QQQ:
Listen, there are no guarantees and I don't have a crystal ball. But I do believe there is a TON of manipulation that takes place on Wall Street on a regular basis. Today's clearly a bad day and I don't know how we'll finish. But right now, the QQQ is trading at 287.88. It's down 3.23 today. Want the intraday breakdown?
- Opening gap: -3.38
- 9:30am-10:00am: -1.73
- 10:00am-11:00am: +0.49
- 11:00am-2:36pm (current time): +1.40
We still have close to 90 minutes left so anything can happen, but does this intraday breakdown look familiar?
Happy trading!
Tom