
EB Daily Market Report - Wednesday, September 21, 2022
ChartLists
I have updated several of our ChartLists and they'll be available for downloading/viewing later today or tomorrow. I'll keep you posted.
Executive Market Summary
- Futures were higher overnight and our major indices did gap up as markets brace for the Fed decision and statement at 2pm ET
- My sustainability ratios are BULLISH heading into this announcement; I'd still expect extreme volatility, but unless these ratios change, I believe the after-Fed-meeting move to be HIGHER - more on this below
- Cryptocurrencies are rallying with bitcoin ($BTCUSD, +2.16%) aiding the rally
- Gold ($GOLD, +0.31%) remains depressed and near 2 1/2 year lows
- Other commodities are mostly higher, though crude oil ($WTIC) is flat at just under $84 per barrel
- The 10-year treasury yield ($TNX) is also flat at 3.57%, ahead of the FOMC meeting and policy statement
- All sectors are either higher or flat today, led by consumer staples (XLP, +1.28%) and industrials (XLI, +1.13%)
- Food products ($DJUSFP, +2.19%) are leading staples higher, as General Mills (GIS, +6.88%) rallies after a much-better-than-expected earnings report
Market Outlook
Today's action is quite boring, which is typical for Fed day. Volume tends to be light as many market participants wait for the Fed decision to decide whether to go long or short. I would expect volatility ($VIX) to pick up considerably after 2pm ET, the time of the Fed's policy statement this afternoon. One thing I want to point out is that the VIX has struggled to clear 28. Today's open was 28.03 and, if the S&P 500 reacts negatively into today's close and the VIX ends the day above 28, extra caution would be appropriate in the near-term. A rising VIX can trigger violent selling episodes when the VIX is this high. Check out this VIX chart:
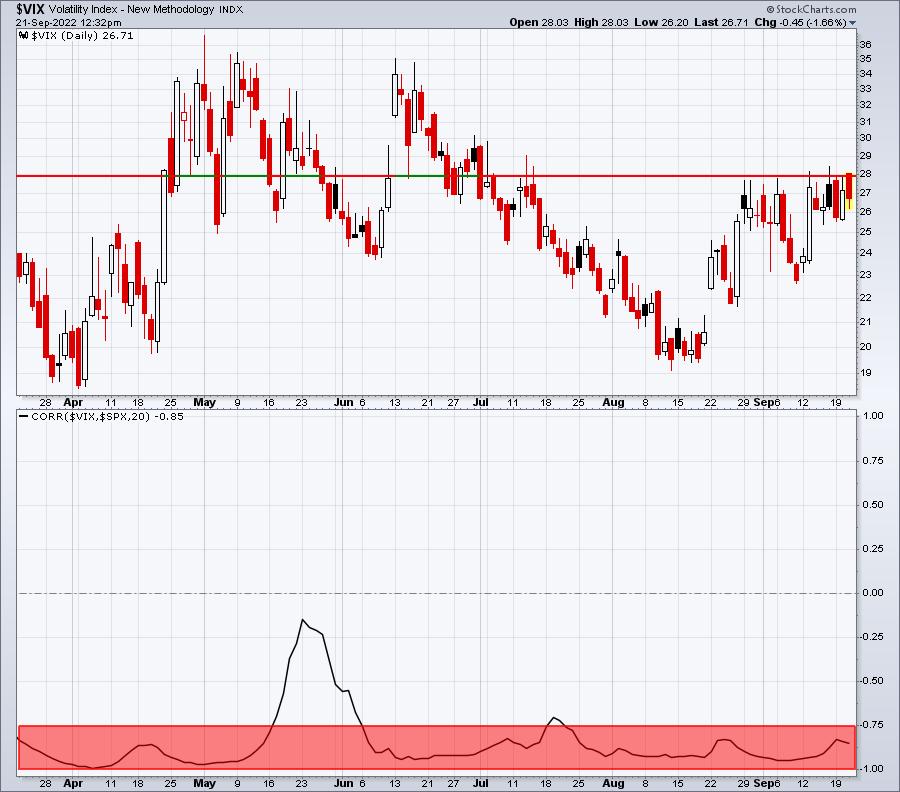
In the bottom panel, the correlation coefficient shows EXTREME inverse tendencies when we compare the direction of the VIX and the direction of the S&P 500. This confirms that a rising VIX is BEARISH for the S&P 500....and vice versa. And it makes sense. As fear increases, selling can become impulsive, meaning rapid declines in the S&P 500.
I'm not suggesting that the S&P 500 is likely to move lower today, because I honestly have no idea which way we're going today. I'm going to watch like everyone else. My plan is build a long portfolio via weakness though. A strategic, diversified way of doing so is by buying ETFs like the SPY and QQQ at current price and add as prices decline. Obviously, a more aggressive method would be to add individual stocks or to add leveraged ETFs that track the S&P 500 and NASDAQ 100 (SSO and QLD, respectively). But that is certainly an individual call.
For those of you that believe the market is going lower, using a similar strategy on strength after the 2pm ET announcement makes sense. You may completely disagree with my bullish assessment of the market right now, and that's okay. I've been wrong plenty of times before and there'll be plenty more mistakes ahead. Everyone must do what's most comfortable for his/her in their own personal circumstance.
Sector/Industry Focus
I will watch sustainability ratios this afternoon and over the next couple days for S&P 500 directional clues. Temporary moves in both directions are very likely to occur, so whipsaw action is to be expected. Things could look great for you at 2:15 and awful at 2:30. That's simply called FED DAY, where crazy moves in either or both directions is completely normal. I believe where we are in 2-3 days will matter much more than how we trade today after 2pm ET. Also, the rotation will matter. If we go lower, but rotation moves into more aggressive areas, I'm going to find that very bullish. If, however, the opposite is true, and the stock market rallies, but with money moving more defensively, I'll be extremely cautious.
Let's look at how the S&P 500 traded during the two-week period that contained Fed announcements the past three meetings. I'll also include the 3 key sustainability ratios (XLY:XLP, QQQ:SPY, IWF:IWD) that I like to follow in the bottom 3 panels.
Fed Meeting, July 26-27:
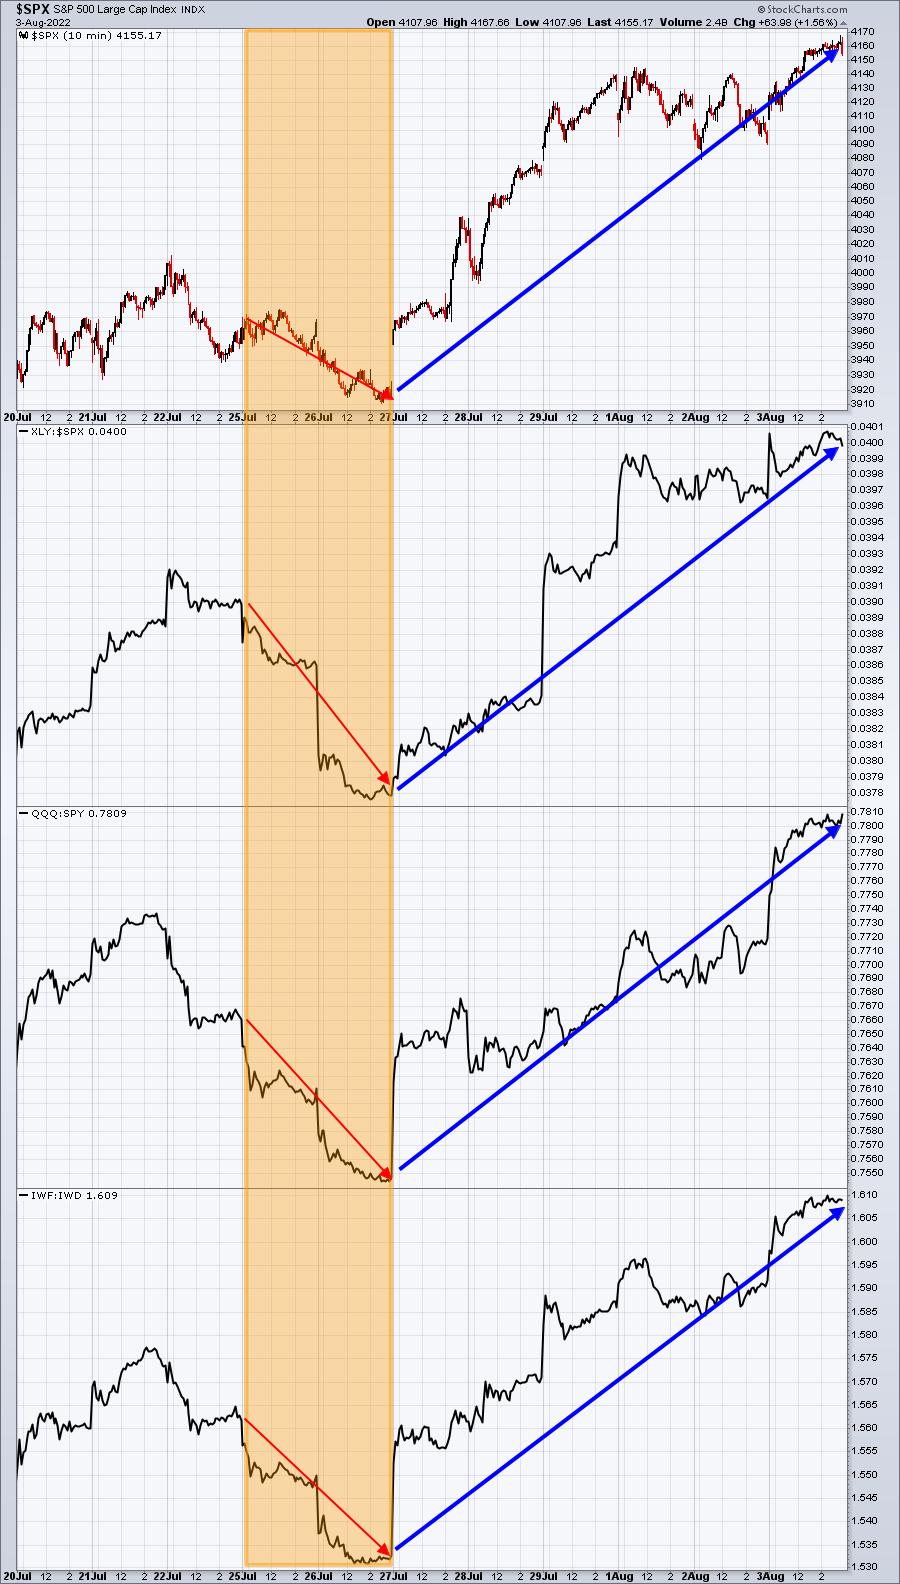
I didn't really see any clues here. The S&P 500 traded down during the 2-day meeting (orange shading), but so did the ratios. When the S&P 500 turned up AFTER the meeting, so too did the sustainability ratios. If anything that AFTER the Fed meeting reaction was bullish and supported by the ratios shown. The S&P 500 did rally for the next few weeks - through mid-August.
Fed Meeting, June 14-15:
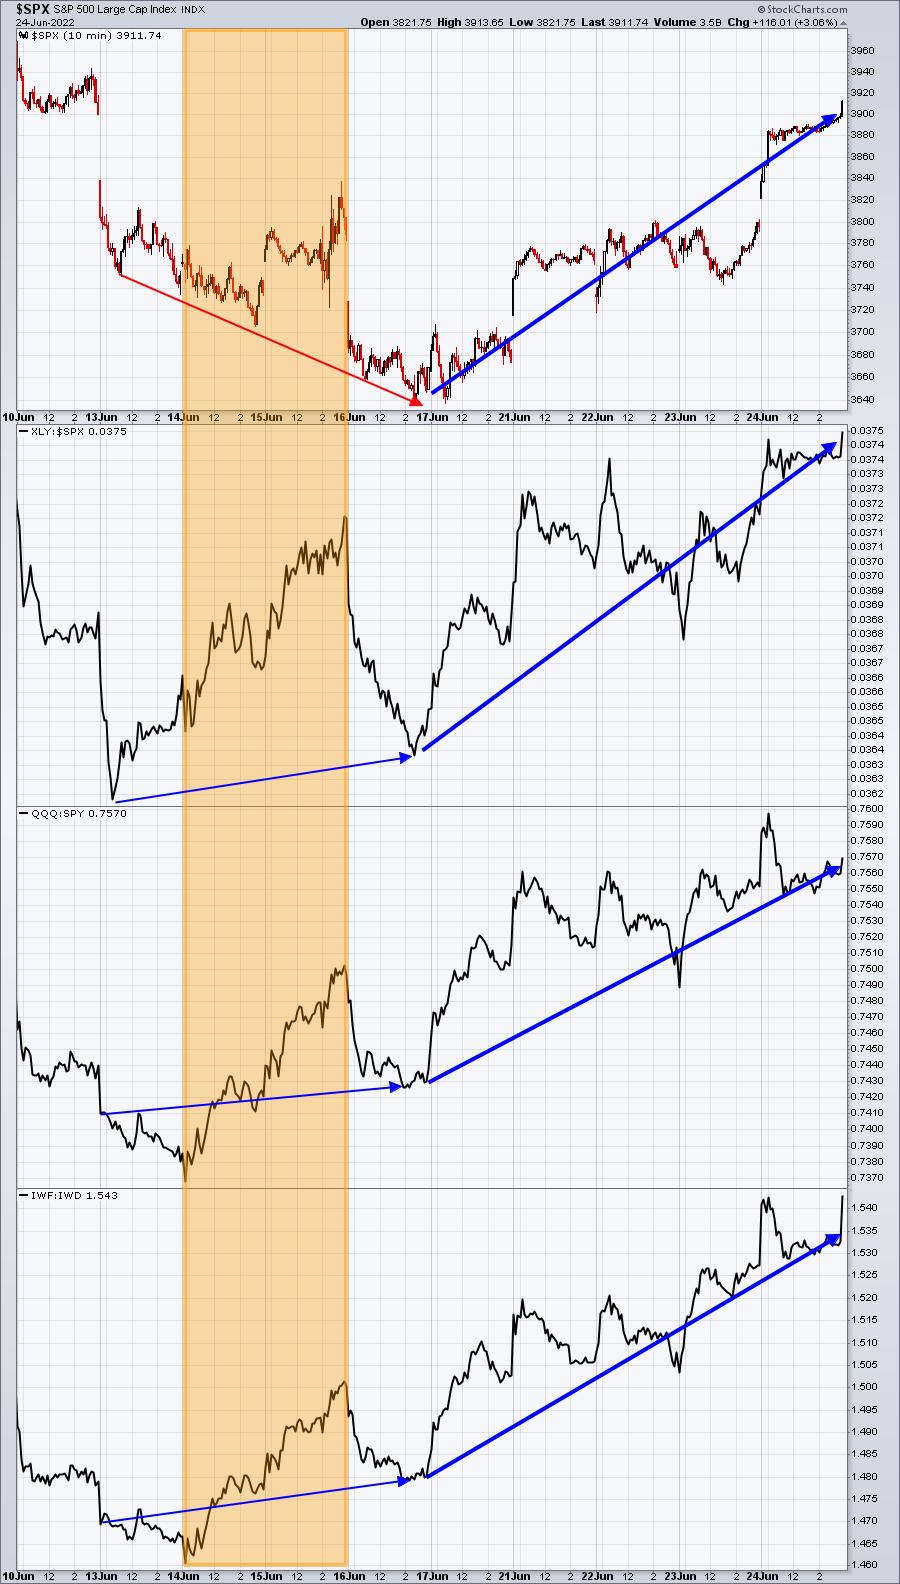
This meeting was much more interesting as it occurred as the market made a MAJOR bottom. From just prior to the Fed meeting through the end of the Fed meeting, the S&P 500 clearly trended lower, while our ratios held up quite well, actually rising over the same period. In this instance, just looking at the surface, you'd have been concerned about the deteriorating S&P 500. However, the rising ratios suggested Wall Street was repositioning into more aggressive areas. That resulted in a very significant market rally.
Fed Meeting, May 3-4:
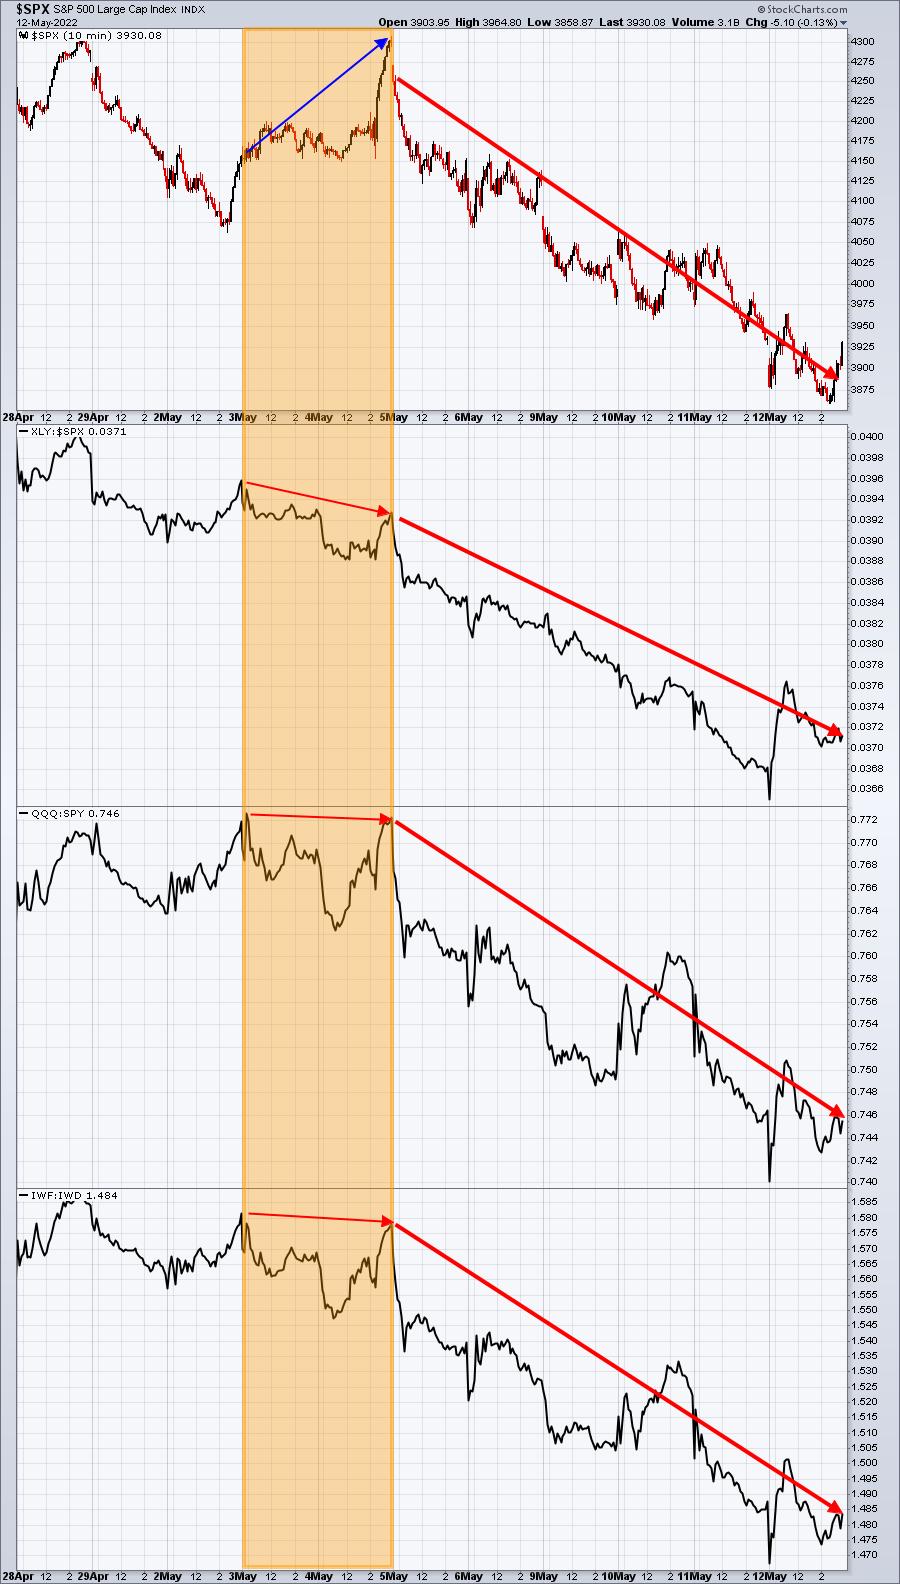
May was also a very interesting Fed meeting. Note that S&P 500 SOARED 225 points from just prior to the meeting to just after the announcement. However, do you see Wall Street turning more defensive? NONE of these 3 ratios pushed to new highs, following the S&P 500. That makes me much more nervous about the rally, which, as it turned out, didn't last.
So what do we look like heading into and during this current Fed meeting and what can we gain from looking at the ratios? Well, here's the same chart:
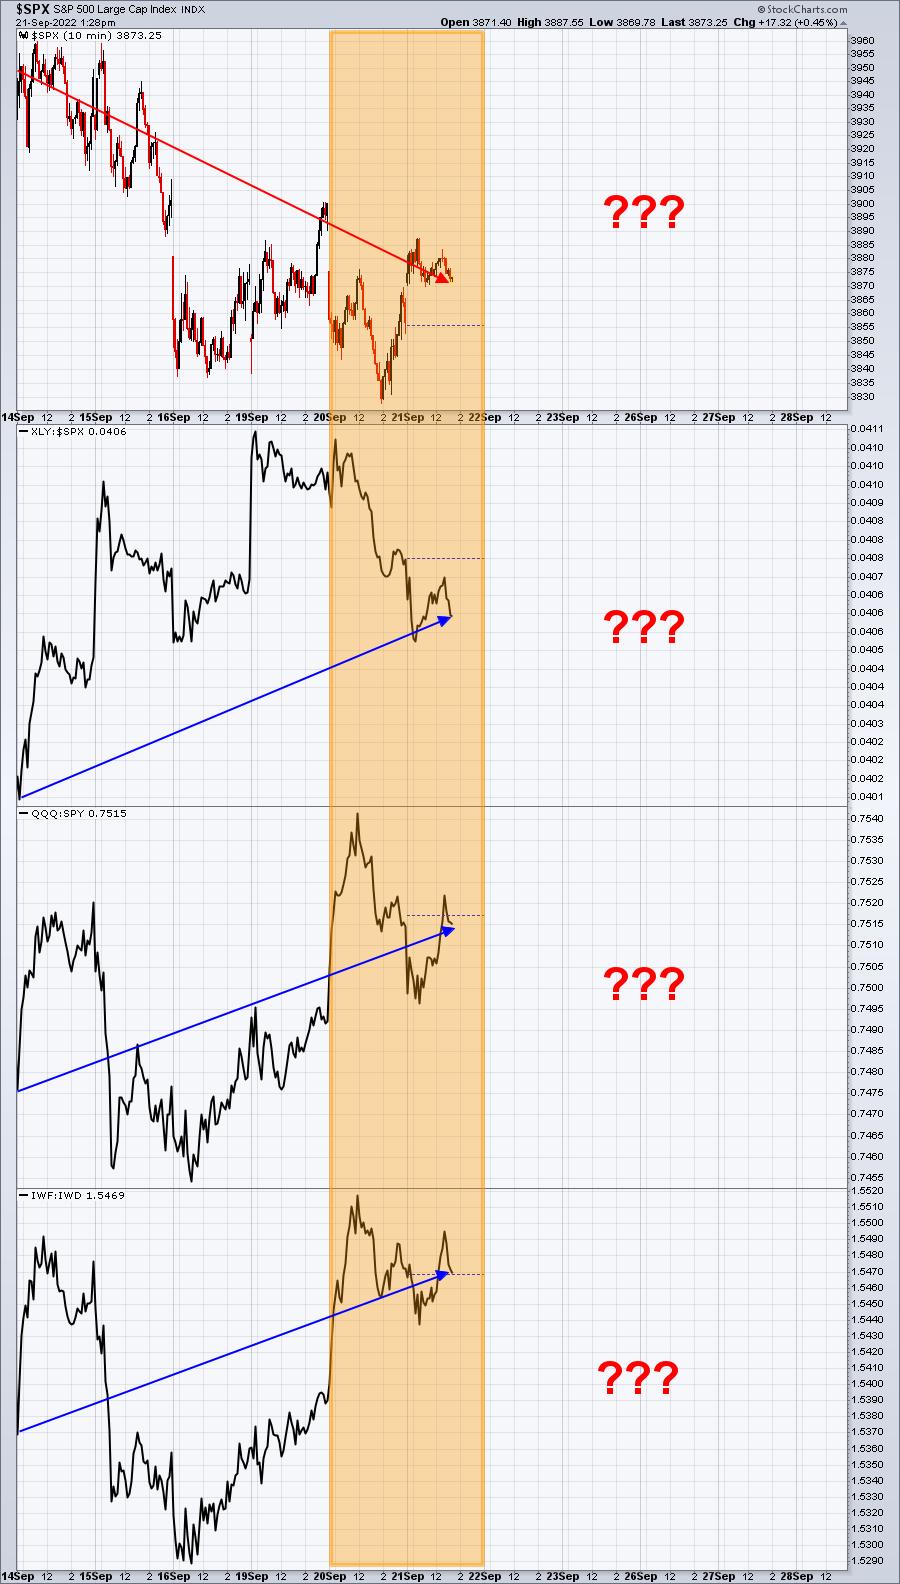
It's certainly an interesting chart. For the past several days, the S&P 500 has been declining, but Wall Street is positioning aggressively as our 3 key ratios have risen, moving opposite the S&P 500. Will this lead to big market rally? I don't know, but I feel much better about the market given the current state of these ratios than I would if they were all declining. It's why I am going to trade on the long side, despite the historical headwinds (2nd half of September historically tends to be bearish).
Members have asked on several occasions how reliable the sustainability ratios are. Well, if you're searching for the HOLY GRAIL, this ain't it. It is not infallible. I think these ratios are better and more reliable in the intermediate- to long-term than they are on an hourly basis. But I do believe watching Wall Street's rotation is a critical PIECE of the puzzle - not the puzzle itself.
You should still trade or invest in a way and using a strategy that's most comfortable for you. You certainly do not have to agree with me. But I do have strong conviction in my methods and in my research. That's all I can really say.
ChartLists/Strategies
If you're a fan of buying on key price support and you believe the stock market is going higher, I will provide you a few interesting trades at current price levels. Here they are:
ASAN:
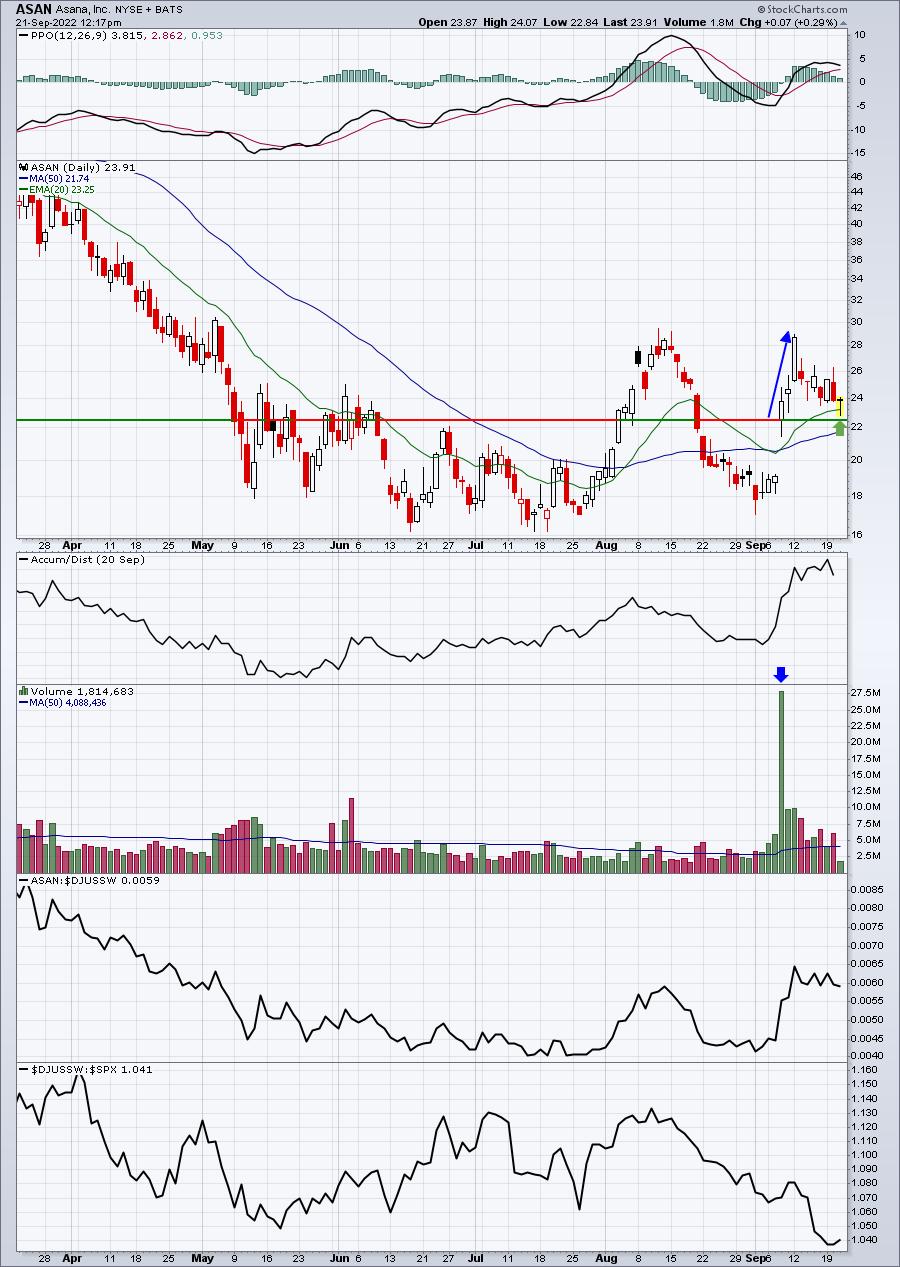
ASAN has already bounced a bit, but it is extremely volatile and is only for those who have a high risk tolerance. Recently, ASAN reported its quarterly results and raised guidance. Since then, it's returned back nearly all the way to the top of gap support and has tested its rising 20-day EMA.
(Disclosure: I own ASAN shares)
CXM:
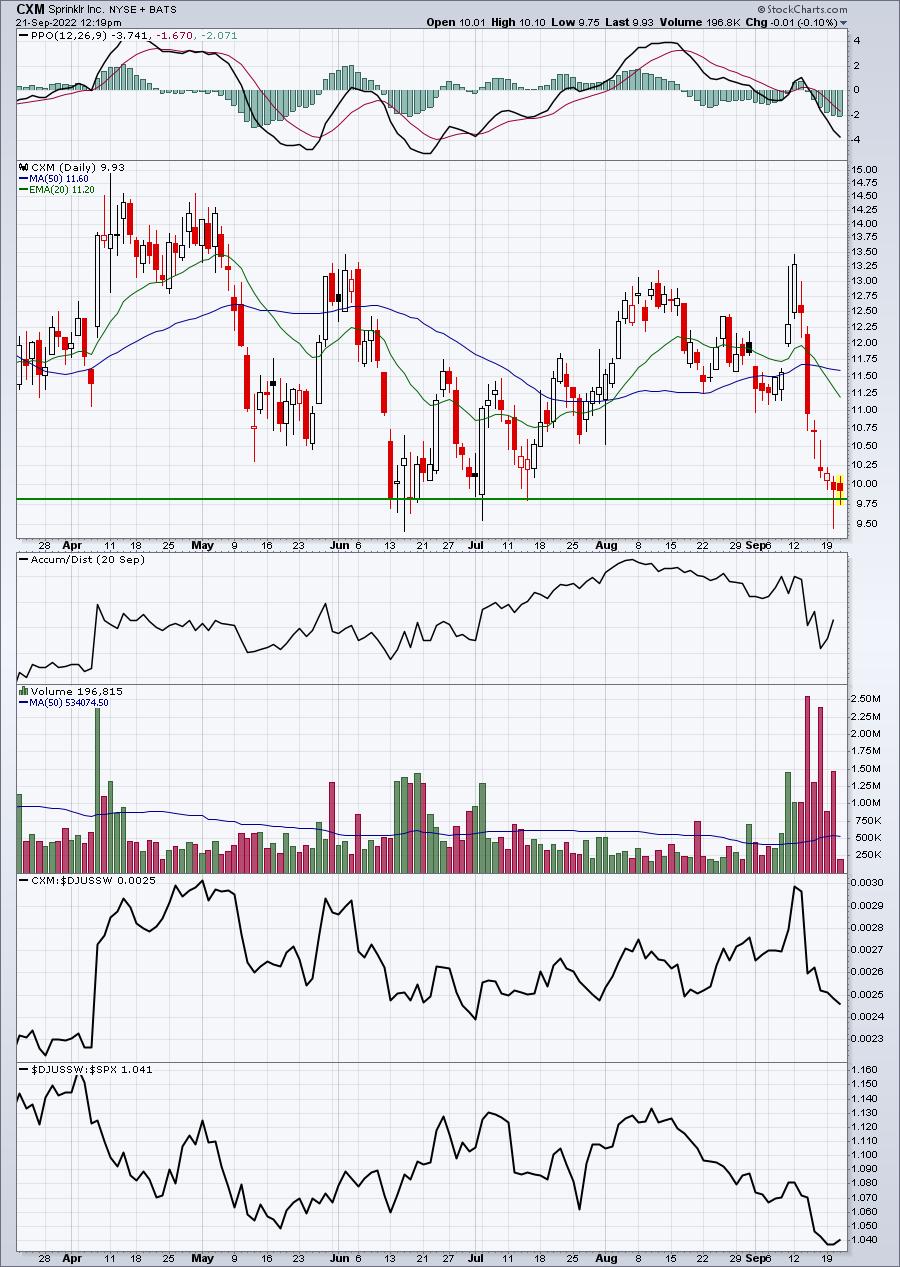
I don't own CXM, because I like to see at least signs of relative strength and there is little of that here. However, CXM also recently raised guidance AND it's trading nearly square on a major price support level. After being bludgeoned, it's certainly not out of the question to see an oversold bounce of 10-15%.
PL:
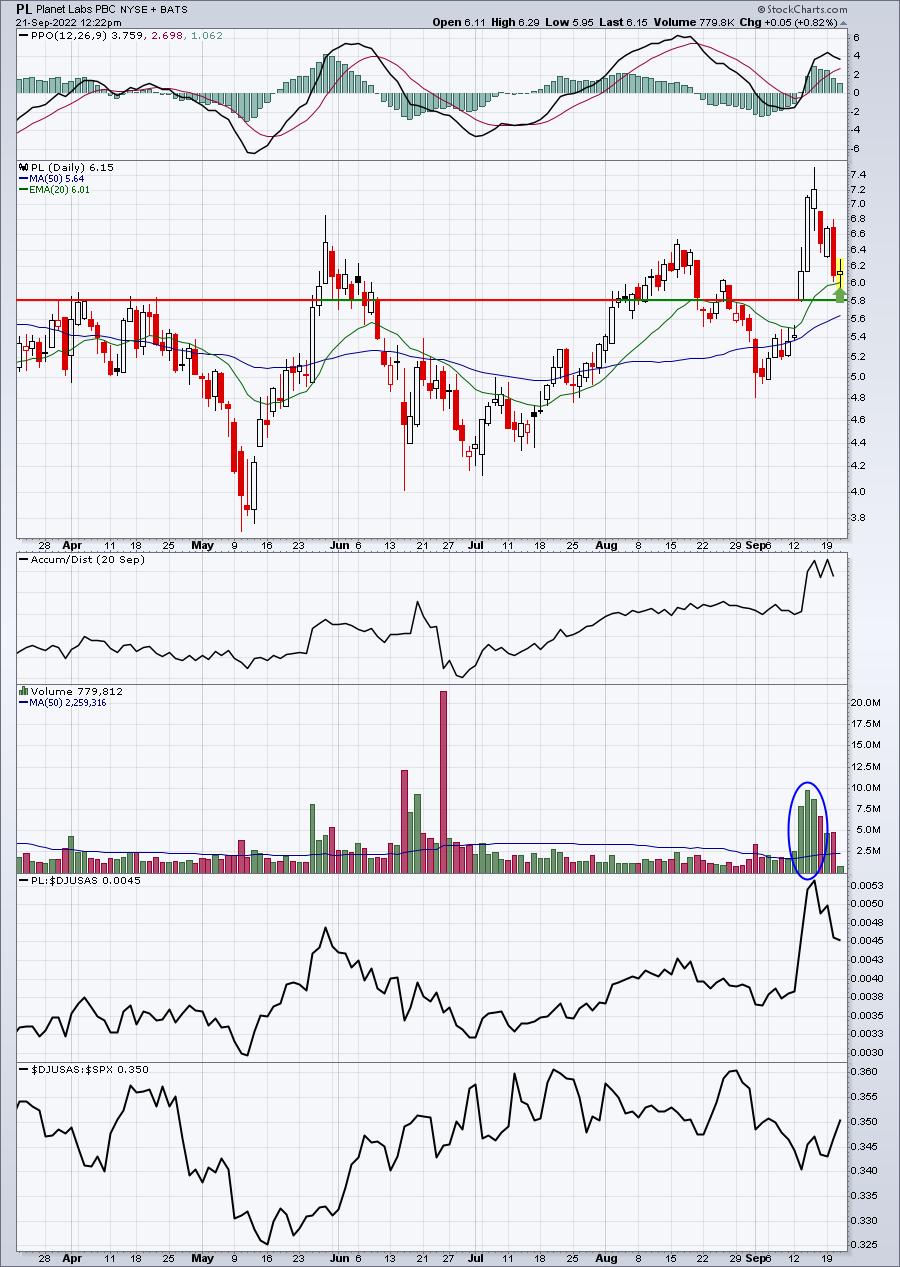
PL looks similar to ASAN, except that its industry group, aerospace ($DJUSAS) has been much stronger in recent weeks than software ($DJUSSW). That might provide a bit more confidence in making this trade. It is a very aggressive trade, however. I like entry better on the 20-day EMA and again at gap support at 5.82, so a strategy that includes those two price levels is solid, in my opinion. A close much below that 5.82 level and I'd exit.
Earnings Reports
Here are the key earnings reports for the next two days, featuring stocks with market caps of more than $10 billion. I also include several companies with market caps below $10 billion. Finally, any portfolio stocks that will be reporting results are highlighted in BOLD. If you decide to hold a stock into earnings, please understand the significant short-term risk that you are taking. Please be sure to check for earnings dates for any companies you own or are considering owning.
Wednesday, September 21:
GIS, LEN, TCOM, FUL, KBH, SCS
Thursday, September 22:
COST, ACN, FDX, FDS, DRI, AIR
Economic Reports
August existing home sales: 4,800,000 (actual) vs. 4,700,000 (estimate)
FOMC policy statement due at 2:00pm ET: fed funds rate expected to be raised by 75 basis points
Happy trading!
Tom