
EB Daily Market Report - Thursday, September 22, 2022
ChartLists Updated
The following ChartLists have been updated:
- Strong Earnings (SECL)
- Strong Future Earnings (SFECL)
- Strong AD (SADCL)
- Raised Guidance (RGCL)
- Bullish Trifecta (BTCL)
- Short Squeeze (SSCL)
Also, we've corrected the link for our Strong ETF ChartList (SETFCL). All of these ChartLists will be updated on our website this afternoon and available for downloading/viewing at that time.
Executive Market Summary
- Futures were lower following yesterday's final hour rout by the bears
- Our major indices have been weak throughout the day, though we are seeing relative strength in the Dow Jones component stocks
- Cryptocurrencies continue to sell, with etherium ($ETHUSD) down more than 3%, falling beneath 1300
- Commodities are mostly higher as crude oil ($WTIC, +0.83%) jumps back above $83 per barrel
- The 10-year treasury yield ($TNX) is soaring 18 basis points to 3.69% and that, in my opinion, is what's putting so much pressure on U.S. equities
- Today is a RISK OFF day as consumer discretionary (XLY, -2.12%) is the primary laggard
- Gambling stocks ($DJUSCA, -6.06%) have completely fallen apart the past three trading sessions, rapidly-approaching their June low
- Health care (XLV, +0.77%) is avoiding much of the selling since the FOMC policy decision; the XLV has been gaining throughout today's session
- Eli Lilly (LLY, +4.29%) is the top-performing S&P 500 stock, helping to lead health care stocks higher
Market Outlook
Yesterday, at this time, I was discussing how boring the market was. Well, that changed after 2pm ET, as it usually does on Fed day. Whipsaw action is the norm, but I'm not sure I've seen the market as volatile after a Fed policy statement as it was yesterday. Insane is how I might describe it. Personally, I used initial weakness to build a leveraged ETF holding (QLD). I did that because of my belief that those sustainability ratios were forecasting higher prices ahead, once we had the Fed out of the way. In other words, I felt pretty good that we were going to see a relief rally. And we did - for 20 minutes. It was a POWERFUL rally, but it did not last. The bears completely regained control of the action and we saw rapidly-declining prices during the final 60-75 minutes of the trading day.
There is a lot to consider based on the new information from the Fed and the subsequent market breakdown. First and foremost, I am still of the opinion we're in a cyclical, not secular, bear market. The primary difference between the two is the length of time that we see a decline. Most cyclical bear markets run their course (high to low) in 3-6 months. Not all of them, but most of them. So the January top, followed by the June bottom, was 5 1/2 months. That low on the S&P 500 0f 3636, while we're quickly approaching it, has not been breached yet. The reaction to yesterday's rate hike and policy statement was clearly bearish, but the June low hasn't been broken.
After Fed Chief Powell's speech from Jackson Hole on August 26th, we hosted a "Where Does The Market Go From Here" event. During that event, I pointed out what I believed were the two most likely scenarios to the downside before we would resume the secular bull market. Here was the chart I provided:
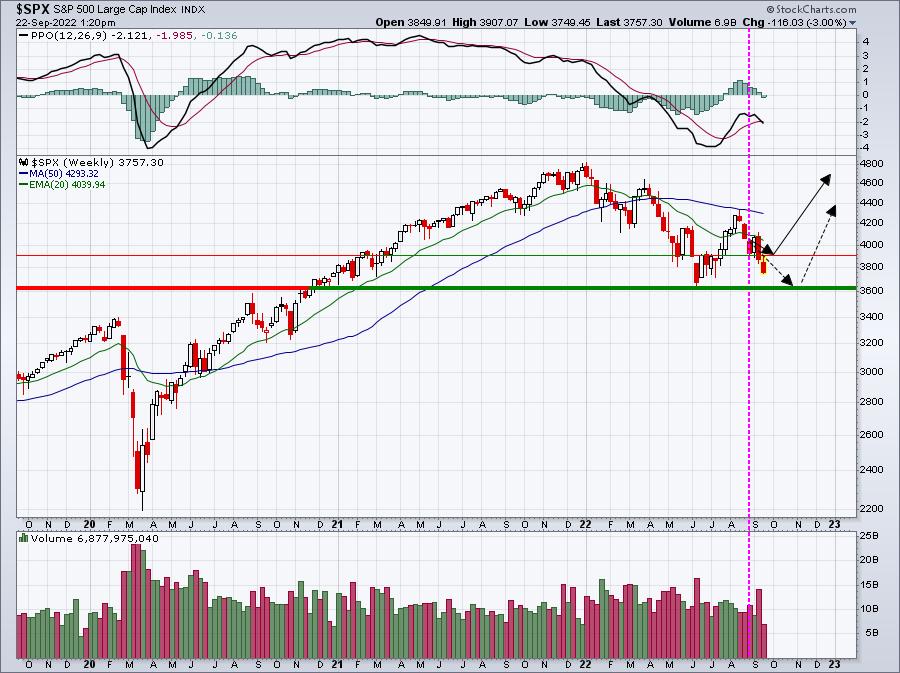
Scenario 1 was the more bullish of the two. In that case, I was expecting a more shallow pullback to 3900, where we'd find solid support and resume the secular bull market into Q4. Scenario 2 was the more bearish, where I looked for a possible retest of the mid-June low at 3636.
Technically, 3900 has now become a VERY important level to clear for those in the bullish camp. Yesterday afternoon, just before all that late-day selling, the S&P 500 had climbed to 3907. Then the sellers ambushed the bulls. So once again, 3900 was the wall - this time the resistance wall, instead of the previous support wall. I would consider the S&P 500's trading range now to be 3636-3900.
In order to confirm a secular bear market (for those wondering what it would take for me to more seriously consider this to be a secular bear market as opposed to a cyclical bear market), we need to see 2 things - at a minimum. The monthly PPO MUST go negative. Next, the monthly RSI must pierce 40 support. We've never had a secular bear market and, by definition, we need a bear market to last long enough for these two technical indicators to reach those more extreme levels. As of today, the monthly PPO on the S&P 500 is 3.12 and the monthly RSI is 45.72. There's still significant weakness that must be felt to "qualify" as a secular bear market.
Sector/Industry Focus
I am bullish by nature. I think it's the better "default", if you will. But I do try to remain objective and call what I see. I was able to call a cyclical bear market in 2022 before it ever began, so my bullishness isn't "perma" bullishness. Once I'm convinced of a market direction, however, it's difficult for me to change my tune. Maybe that's a good thing, maybe it's not. I'm aware that it can lead to confirmation bias, which is essentially cherry-picking reasons that support my current market thesis. But there's a fine line here. I don't want to constantly change from bearish to bullish to bearish to bullish. It gets exhausting after awhile and does no one any good.
Here's what I'd say right now. We're downtrending short-term and losing 3900 support was a big deal. No matter how bullish I (or you) might be, we need to respect the short-term downtrend and the historical bearishness of September. From an intermediate-term perspective, I like to look at key lows and see how various intermarket relationships look at those specific levels. If we do retest 3636, are the XLY:XLP, QQQ:SPY, IWF:IWD, and other ratios higher? If so, I'm going to remain bullish. If these ratios break down, then all bets are off and I'll likely be extremely cautious, even if not outright bearish.
I think the HUGE spike in the 10-year treasury yield ($TNX) is spooking the market right now. It's up 16 basis points today to 3.67%, and certainly appears to have established a confirmed 11-year breakout. Rising yields are hurting the ratios I mentioned above. Check out what's happened just since yesterday afternoon:
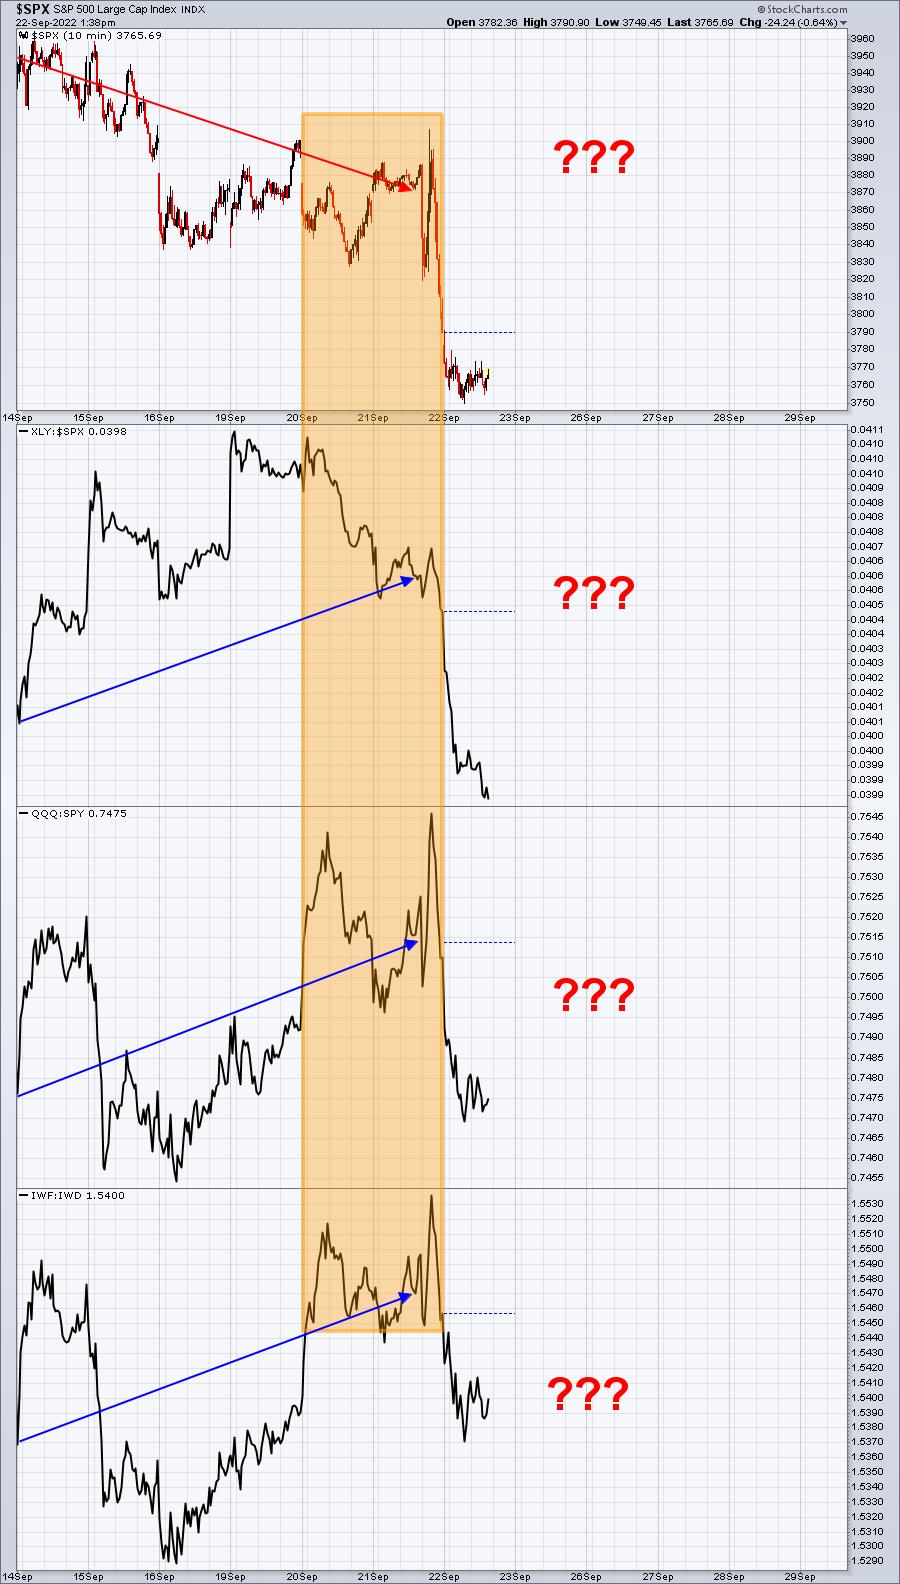
The XLY:XLP was in excellent shape and threatening to break out recently above its relative August high. One week later, this same ratio is challenging the relative support established on September 1st. It had room to the downside because of that earlier strength. The other two ratios have moved lower, but nothing like the XLY:XLP. The action today is bearish, but these relationships are still fairly bullish relative to where they were back at the May and June lows. It's a mixed bag.
ChartLists/Strategies
Just a quick update on our Model Trades:
STZ - stopped out on Wednesday's close of 238.87, since that was below our closing stop of 239.84.
SJM - continues to perform well, mostly the result of defensive stocks outperforming during this selloff. Our target is at 144 and SJM is currently trading near 143. If it hits 144, we'll lock in profits.
TXN - somewhat surprisingly, TXN continues to perform relatively well, given the selling in many growth areas. We have a second entry in TXN awaiting if it reaches 160. Today's low was 161.22, but TXN has since rebounded to 163.
NET - our closing stop is 58 and NET is currently trading at 56.95. Barring an afternoon reversal, we'll exit and hopefully take a small loss. If NET does reverse and finish back over 58, it could be a significant bottom. We'll see.
Earnings Reports
Here are the key earnings reports for the next two days, featuring stocks with market caps of more than $10 billion. I also include several companies with market caps below $10 billion. Finally, any portfolio stocks that will be reporting results are highlighted in BOLD. If you decide to hold a stock into earnings, please understand the significant short-term risk that you are taking. Please be sure to check for earnings dates for any companies you own or are considering owning.
Thursday, September 22:
COST, ACN, FDX, FDS, DRI, AIR
Friday, September 23:
None
Economic Reports
Initial jobless claims: 213,000 (actual) vs. 220,000 (estimate)
August leading indicators: -0.3% (actual) vs. +0.0% (estimate)
Happy trading!
Tom