
EB Special Report - Friday, September 23, 2022
This Special Report will be in lieu of today's Daily Market Report (DMR).
Understandably, I'm receiving a number of emails discussing the June low on our major indices, whether it holds, and if I've adjusted my downside target for the S&P 500. I figured it would be much easier to provide our entire membership my current line of thinking, rather than trying to address individual emails. That's the primary purpose of this communication.
Trip Down Memory Lane
This segment of the report is primarily for our newer EB.com members that were not with us during the first half of the year.
I began 2022 in very bearish mode. I expected a rough 2022 - especially during the 3-6 months. There were many warning signs that included the following:
- 120% advance in the S&P 500 in 22 months - the largest such advance since 1950
- Wall Street rotation from aggressive groups to defensive groups in December 2021
- EXTREME complacency in the form of ridiculously-low equity-only put-call ratios ($CPCE)
- Negative divergences on weekly PPOs of our major indices
- Breakout of our secular bull market channel (same thing happened in 2014/2015 before a lengthy consolidation)
At our MarketVision 2022 event, I suggested a potential drop on the S&P 500 to the 3500-3800 range over a 3-6 month period. We saw the June bottom print at 3636 5 1/2 months later. I mention this so our newer members don't infer that I'm a perma-bull always calling higher prices ahead. I do my best to look objectively at all the information at my disposal to make an informed call based on experience. I've been passionate about the stock market for 40 years and have been actively trading it since the 1990s. I was able to negotiate the secular bear market of the 2010s with my capital intact. In fact, it was the dot.com bubble period and all the manipulation that surrounded it, that encouraged my partner John Hopkins and I to start our company in 2004. My goal and vision at EarningsBeats.com is simply to help others avoid many of the mistakes I had made when I first began trading. We do that via our research, guidance, and education platform at EB.
Will We Retest The June Low?
This is an easy answer, because we're already there on the Dow Jones. In fact, as I'm writing this, the Dow Jones hit a low at 29643 this morning, 10 points lower than the 29653 low on June 17th. The CLOSING LOWS that I'm watching on our major indices are as follows:
- Dow Jones ($DJI): 29,888.78
- S&P 500 ($SPX): 3666.77
- NASDAQ ($COMPQ): 10646.10
- NASDAQ 100 ($NDX): 11127.57
- S&P 400 Mid Cap ($MDX): 2200.75
- S&P 600 Small Cap ($SML): 1087.48
As I mentioned, the Dow Jones is already in breakdown territory, barring an afternoon reversal. The SML is also into breakdown territory. The others are rapidly approaching. Even if we saw huge buying later today and the S&P 500 never touched its June intraday OR closing low, I'd still consider this a double bottom. It's close enough.
Will These Support Levels Hold?
Well, that's the million-dollar question. As I mentioned in yesterday's DMR, I provided two scenarios back on Saturday, August 27th. I expected one of these two scenarios to play out. If I'm being completely honest, I would have expected the more shallow pull back to 3900, rather than the full retest. If you didn't see this chart yesterday (or back on August 27th), here it is again:
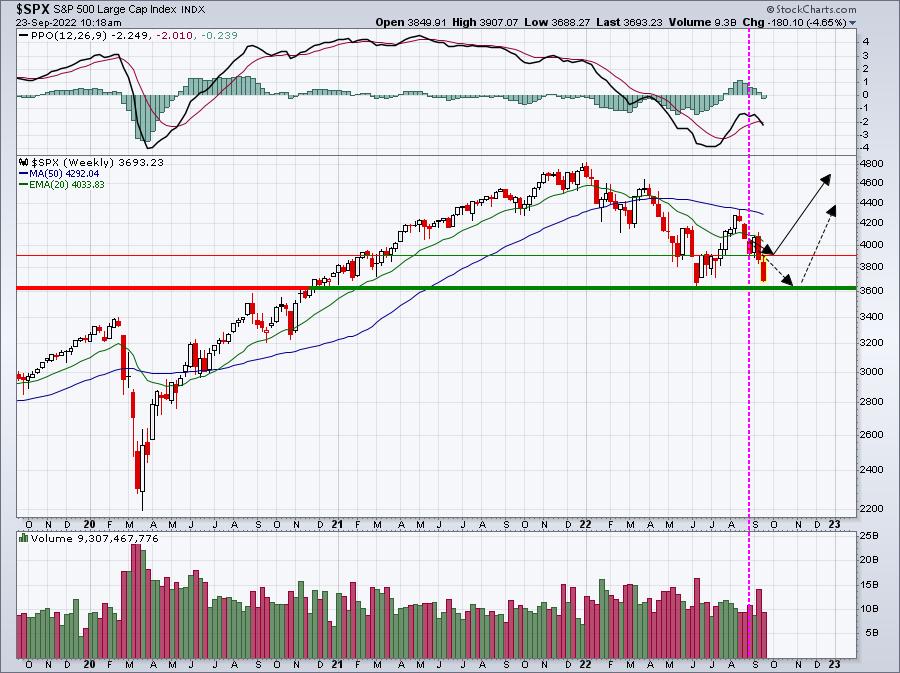
I figured if we were heading back for a retest, it would likely take longer. Otherwise, this move to where we are today was one of the scenarios I considered probable after Fed Chief Powell's Jackson Hole speech.
Has Anything Changed? Is There An Updated Forecast?
I'm not going to assume we break down. At least for today, I'm assuming this key support level holds. But that's no different than any other time I look at the stock market. I generally anticipate key price support holding....until it doesn't. Therefore, I don't have a lower price target on our key indices - for now. I do believe this remains a cyclical bear market rather than a secular bear market. The primary difference between the two is longevity. Of course, the percentage drops are different, but that's because the latter lasts so much longer than the former.
In my opinion, one thing has changed. I believe that starting with the Jackson Hole speech, Wall Street has completely lost faith in the Fed and its current strategy of hiking interest rates aggressively to fight inflation. There are a number of key metrics when valuing companies. As a former practicing CPA, I was involved in numerous valuations to settle disputes, estates, etc. Earnings and earnings growth rates are instrumental and as the Fed's rate hikes continue, many are fearing a deeper recession, which would have a negative effect on future earnings. So that very well could be leading to many Wall Street firms lowering valuations of many companies, especially growth stocks. Another very critical element in performing valuations is the interest rate used to discount future earnings and earnings growth. As interest rates rise (more than expected), it could certainly could again trigger Wall Street firms to reconsider and revisit their prior valuation models. I think, to some degree, that's occurring right now.
What's Driving The Stock Market Right Now?
Well, this is obviously open for debate. I believe the key is interest rate expectations. I honestly think that Wall Street has lost confidence in the Fed. I'm not saying this just to take a shot of Fed Chief Powell. While I am definitely not a fan of this Fed, I'll certainly admit that this Fed has been dealt a very bad hand. I've said many times that there is no "Pandemic Playbook" that I'm aware of. EVERYONE is flying by the seat of their pants. EVERYONE, including the Fed! There's simply little history that tells us how everything will play out after you shut down our entire economy for a month, and then restrict travel for a long period of time. There are both financial and emotional consequences and considerations. We're still trying to catch up on the supply side. And the Fed is doing everything it can to lower demand right now to halt rising inflation. How will this turn out in the end? I don't know. I can make my own assumptions based on my knowledge of economics and the psychology surrounding the stock market whenever it gets so nervous and fearful. But it's nothing more than my opinion, which might be completely different than yours.
My goal when applying technical analysis is to manage risk. That's it. Clearly, I want to make money as well. You can manage stock market risk by remaining in cash 100% of the time. You'll never have to worry about losing money. Or you can be excessively aggressive, putting all of your investable cash into the stock market 100% of the time - even via the use of leveraged ETFs. And if you're bearish, you can short the stock market 100% of the time (I really wouldn't encourage this choice as the stock market goes up much more than it goes down). I try to weigh the evidence and then figure out where on the "risk scale" I want to be. From January through June, I was mostly bearish, with a few opportunities for long trades (mostly around options expiration - like in March 2022). I called a market bottom in mid-June for reasons that were mostly opposite of what I saw in December. Sentiment turned very bearish (where it remains). I discussed back then the need to see a sentiment "reset" and we've seen that. Wall Street was rotating to aggressive areas from defensive areas from the May low to the June low, indicating a change in investing behavior among the smartest investors of all. That was critical to my thinking that a market bottom was at hand. There were subtle positive divergences on the daily PPOs on our key indices. By the way, if you do print new lows across our major indices, we'll have significant positive divergences on the weekly PPOs across the board.
What Do You Believe Is Going To Happen From Here?
I believe the Fed is doing its best to ward off inflation pressures so we don't morph into the 1970s stagflation period. At the same time, Wall Street is saying, "What Inflation?". Stock market prices and rotation were acting like the Fed would be hitting the brakes on rate hikes by now. That's why the stock market bottomed in June and money rotated back towards aggressive growth areas. Wall Street believed rates would peak and begin to drop and growth-oriented stocks would benefit from that. That's THE reason why we see bullish rotation like that. The recent selloff, in my view, is Wall Street's realization that the Fed has gone too far. As rates keep pushing higher, stocks keep selling off further. The two charts ($TNX and $SPX) are nearly a mirror image of one another. Check this out:
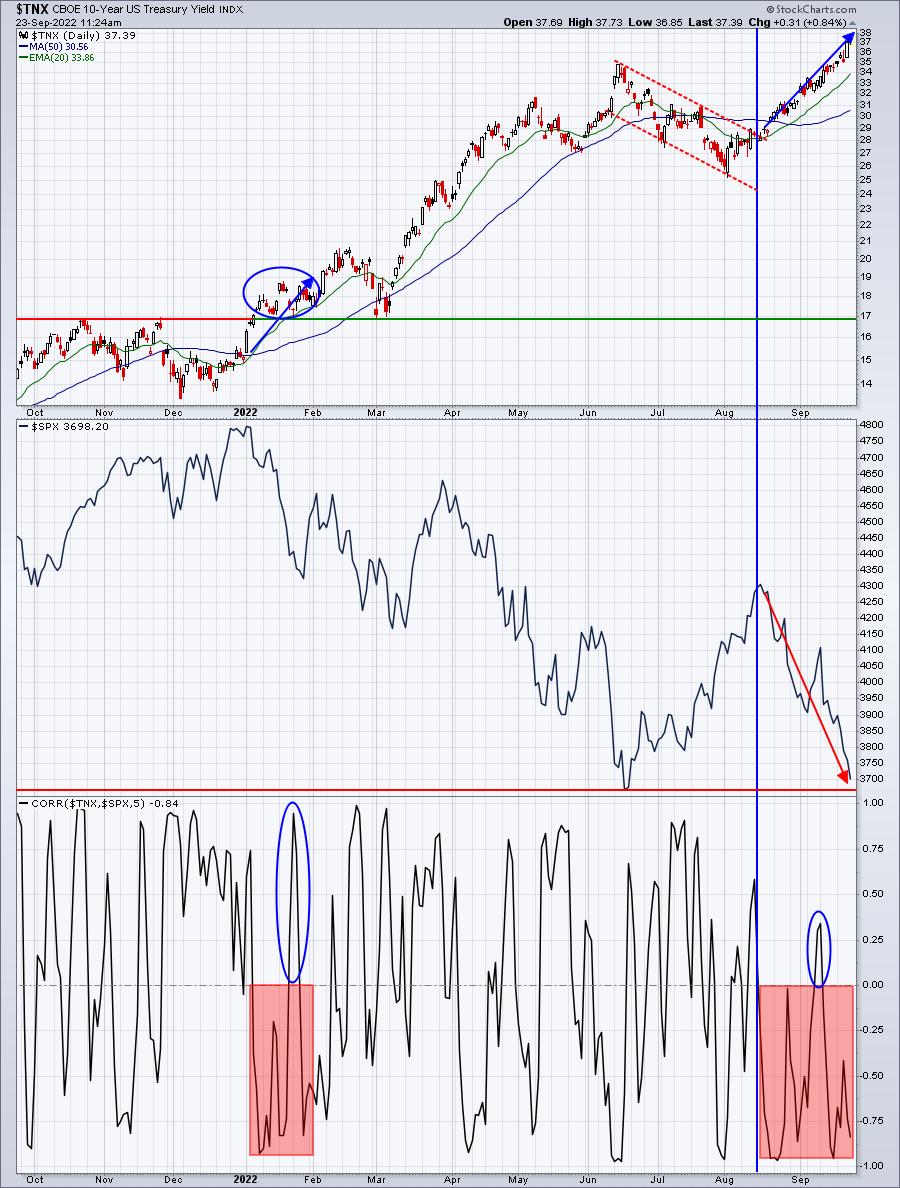
A couple things about this chart. I changed the correlation default of 20 periods, or days, to 5 days. I wanted a shorter period to see what type of correlation we're seeing. In January, as the cyclical bear market began, 10-year treasury yields exploded through key yield resistance at 1.70%. That coincided with a VERY bearish S&P 500 and you can see the significant inverse correlation. After that period, 5-day correlation went back and forth....until the past 5-6 weeks, where it once again is moving inversely and significantly so. The start of the bear market came as rates jumped. As I look "to the story" of this chart, it looks to me like Wall Street is reacting to a much more hawkish Fed than it was previously expecting. If the S&P 500 loses its 3636 support, we could absolutely see a "washout", which is a period of impulsive selling as fear escalates to extreme levels. At that point, I wouldn't look to any particular level of price support. Instead, I'd watch sentiment readings for bottoming clues. That would include either a Volatility Index ($VIX) reversal somewhere in the mid-30s AND/OR a 5-day moving average of the CPCE that moves into the .80s. Impulsive selling can result in prices move right through support levels like they're not even there. I would not look for another bottom until sentiment suggested it.
Getting back to the chart above, as the TNX was channeling lower from June through August, the S&P 500 was rebounding strongly. Again, Wall Street was beginning to price equities higher, believing that the Fed would soon flip and become more dovish. When that didn't happen, and the TNX broke out of the channel to the upside, the selling immediately began. I'm not sure how else we can interpret this. Wall Street's prior expectations were ignored by the Fed and so now we're seeing a "repricing" of the S&P 500. How far will it go? We're about to find out.
Conclusion
Here's where I stand and what I believe - as of this writing.
Cyclical Bear Market
I continue to believe this is a cyclical bear market. Monthly PPOs have never remained positive in a secular bear market. Currently, the monthly PPO on the S&P 500 is +2.988. Monthly RSI 40 provides excellent support in cyclical bear markets, but doesn't hold in secular bear markets. Currently, the monthly RSI on the S&P 500 is 44.52. Again, it's a longevity thing. Bear markets must last a very long time to move from cyclical to secular. My call of a cyclical bear market is based primarily on history, not the severity of the problems we face. Historically, we tend to see secular bull markets last 20 years, while secular bear markets have typically lasted about 10-12 years. The start of bull markets, under this theory, begin when we clear price resistance on the S&P 500, established years earlier, and move to all-time highs. That means that the current secular bull market began on April 10, 2013 and we should expect it to last for another decade (albeit with cyclical bear markets appearing from time to time).
Market Rotation
It makes sense to continually review market rotation. After all, I used it, in part, to call the market top in January and to call the bottom in June. So where do these ratios stand relative to the key June low?
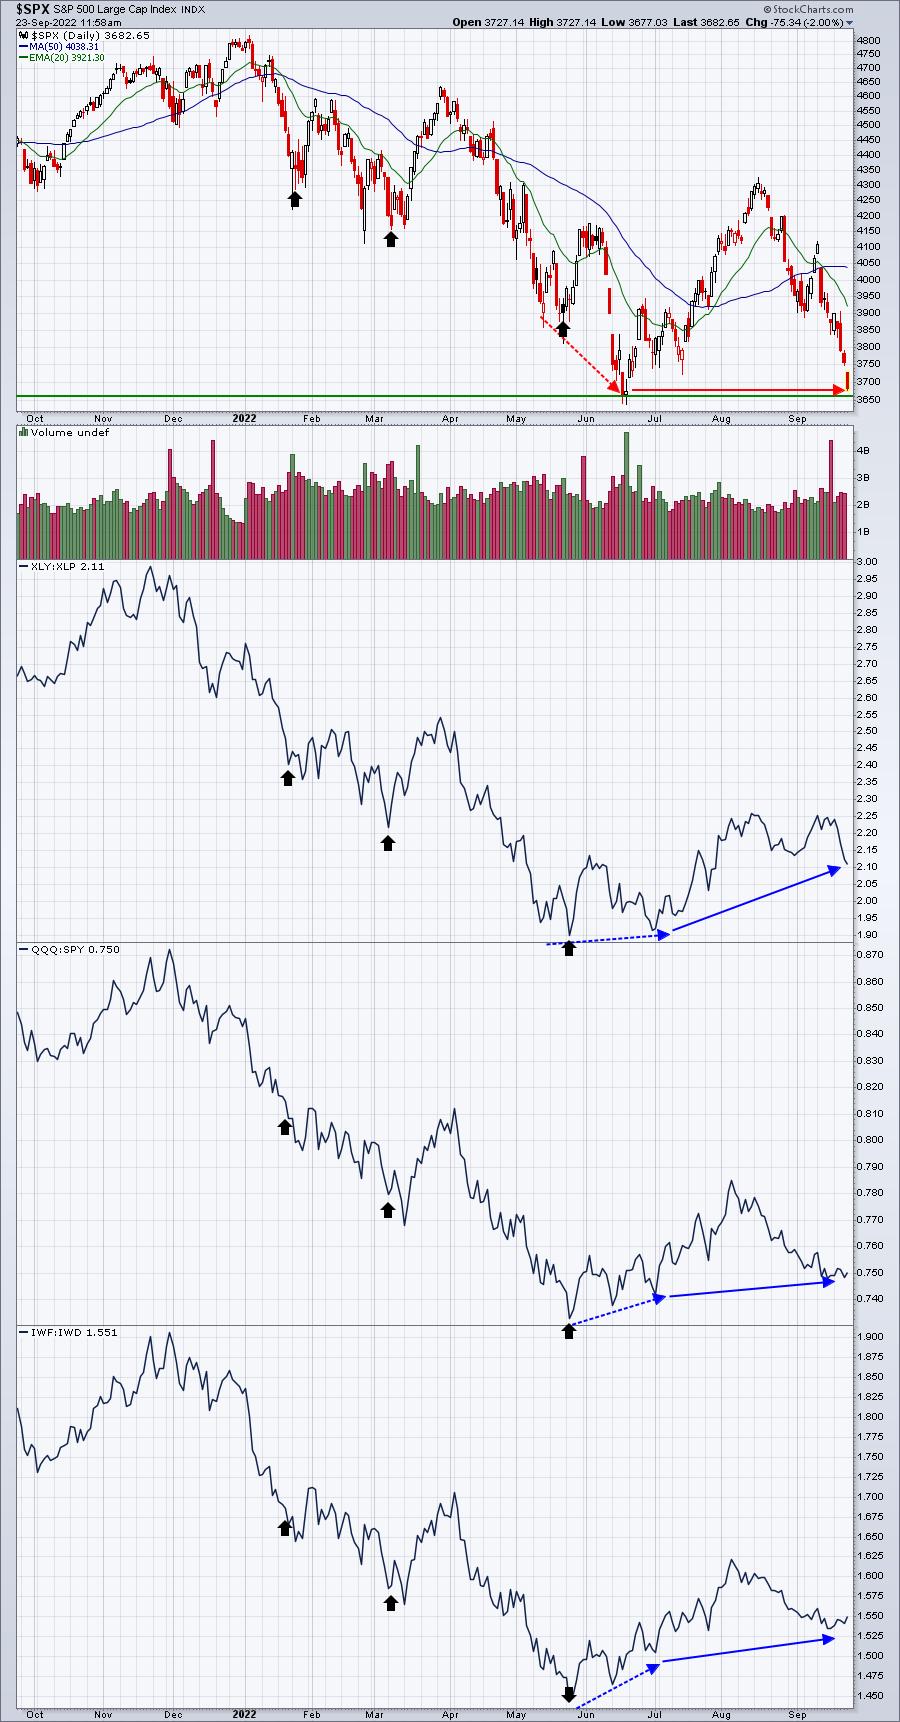
All 3 sustainability ratios have improved further since the June low. So as the S&P 500 has gone up and then back down, essentially to an unchanged level, the XLY:XLP, QQQ:SPY, and IWF:IWD ratios have all climbed to higher lows. There is no other way to interpret this except to say that Wall Street continues to rotate more aggressively during this market weakness. You can disagree with using these ratios as directional clues, but you cannot disagree with the fact that they're rising while the S&P 500 declines. I find this to be VERY BULLISH and consider it to be excellent evidence that this is CYCLICAL, not SECULAR.
Accumulation/Distribution
Throughout the weakness in 2022, AD lines on our major indices have been strong, pushing stubbornly to new highs and not supporting the price downtrend. Here's a current look at the S&P 500 and its AD line:
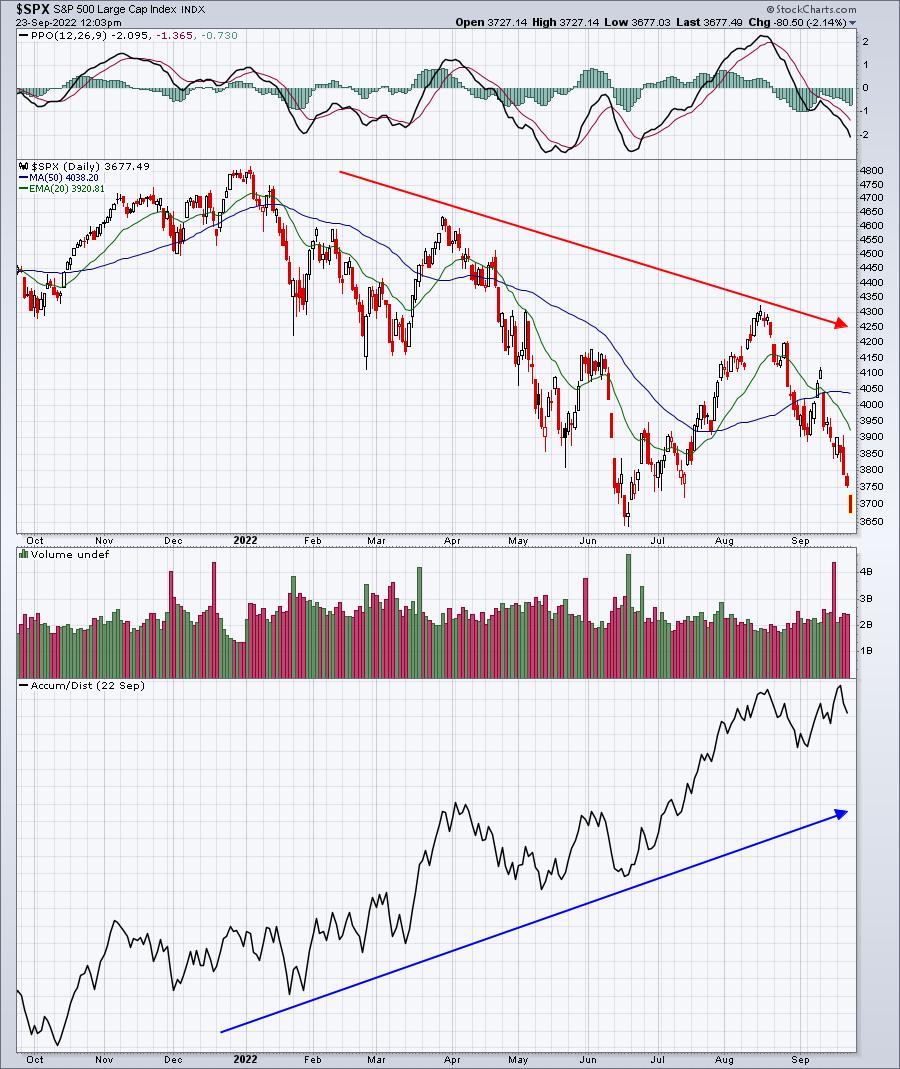
Marc Chaikin developed the AD line. From ChartSchool, here is the explanation of the AD line and its use(s):
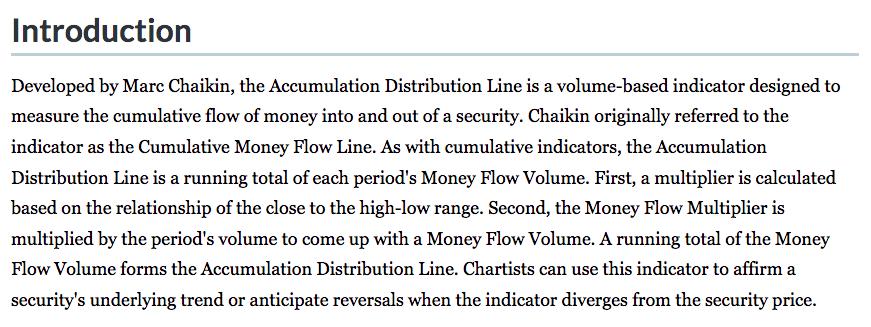
The last sentence is key. The AD line was intended to be used to anticipate reversals when we see divergences. The rising AD line with a falling S&P 500 suggests the potential for a reversal. This is why I follow it.
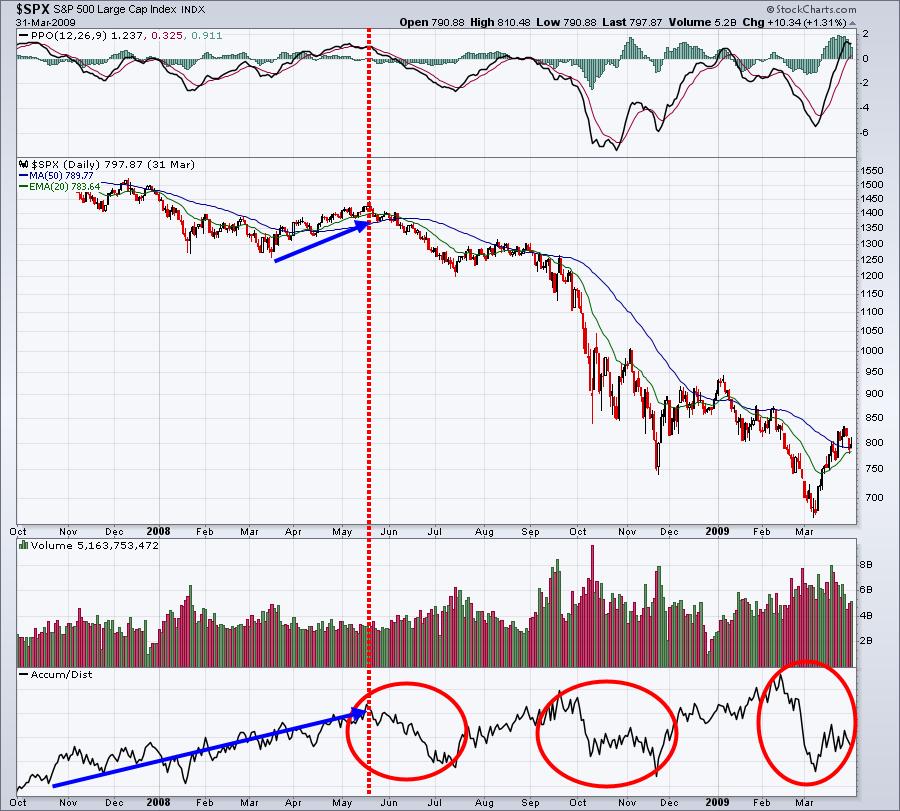
To look at how the AD line looked in prior SECULAR bear markets, let's revisit 2007 and 2000.
2007 Secular Bear Market
2000 Secular Bear Market
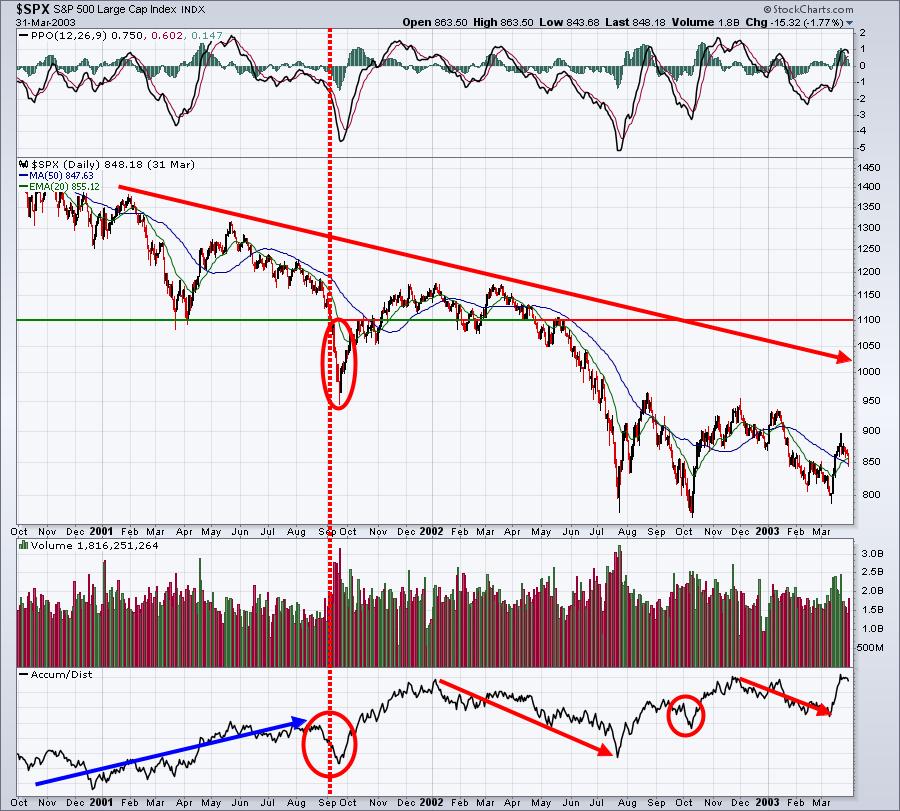
During both the 2000 and 2007 secular bear markets, we saw intermediate-term weakness morph into the longer-term variety. The AD lines, in both cases, took large drops during periods of selling AFTER the initial lows were set in the first 6-9 months of selling. So if you believe that this is a long-term secular bear market, I would expect that a new low would be set AND AD lines would weaken significantly.
Manipulation
This is much the same as the AD lines. I've noted, and passed along, during my research that there are still VERY active buyers after initial gaps lower and morning weakness. That's consistent with how I believe market makers accumulate shares for their institutional clients. I wanted to provide you with an update on this work through yesterday's close (using the QQQ as an example):

These totals are cumulative for the period shown. For instance, the opening gap of 6.31 for the period November 19th through January 3rd is the NET total of all gaps during this period. "Amateur Hour" represents the period from 9:30am (opening bell) to 10:00am ET. The REAL selling took place from January 4th through May 20th. You can see that the QQQ, on a net basis, fell during EVERY time period. That's clear distribution, in my view. Since May 20th, however, I believe Wall Street has used big gap downs and morning weakness to their advantage and I believe this is proof of that. Since May 20th, the QQQ has fallen 12 bucks, but it's risen more than 47 dollars AFTER 10am throughout this period. Someone's doing a lot of buying and that "someone" is WALL STREET.
Even if I cherry pick a key date (August 25th right before Fed Chief Powell's speech in Jackson Hole) and break down the trading since the August 25th close, check out how the QQQ has traded throughout the trading day:

This still looks very suspicious to me. 50% of the weakness has been via gaps lower. Only 10% of the selling is after 11am ET and this number would have been positive, if not for the final hour swoon on Fed day Wednesday.
Listen, maybe all of this will prove to be nothing more than an interesting topic. Maybe we're about to fall apart. I just don't think so. The AD line and this intraday analysis are telling me that this selling is orchestrated to a degree. I'm not saying that none of this selling is real. Prices are declining and that's a fact. But the question for me is whether I'm expecting the selling to continue for the long haul. I say NO. I recognized months ago that the summer could prove to be a very difficult period and even mentioned it again back on Saturday, August 27th, when I suggested a second scenario where we would retest June's low.
I have seen NOTHING thus far that changes my opinion of this being a cyclical bear market and a resumption of the secular bull market.
Therefore, I would still be a holder of the S&P 500 from a long-term perspective. I've never wavered from that, even back in December when I called for a cyclical bear market. Long-term buy and hold investors will look back on this as a blip on the radar, much like the pandemic, the 2018 Q4 trade war drop, and the struggles encountered in 2015/2016.
I could support a more aggressive short-term trading position on the long side so long as the S&P 500 closes above 3665. If that level is lost, I believe we'll need to turn our attention to sentiment indicators as impulsive selling could kick in and take our major indices lower VERY QUICKLY. I just looked and today's low on the S&P 500 was 3662. Because the low CLOSE in June was tested, a double bottom pattern is complete, in my opinion. Now there's just one question.
Does the June low hold? We're about to find out.
Happy trading!
Tom