
EB Daily Market Report - Monday, September 26, 2022
Executive Market Summary
- Futures were lower overnight, but we did see futures become mixed just before the opening bell as the NASDAQ showed relative strength
- We did open with bifurcated indices as the NASDAQ opened higher, while the Dow Jones and S&P 500 opened lower
- After early morning strength, the selling from last week has returned, threatened a key breakdown on the S&P 500 once again - more on this below
- The Volatility Index ($VIX) is surging nearly 8% to 32.25; meanwhile, the 10-year treasury yield ($TNX) has spiked 19 basis points to 3.88%
- Gold ($GOLD) is down another 1.37% to $1632 per ounce, another multi-year low; crude oil ($WTIC, -2.78%) is weak as well
- Surprisingly, consumer stocks are barely down as consumer discretionary (XLY, -0.18%) and consumer staples (XLP, -0.27%) are the two best performing sectors
- Real estate (XLRE, -3.52%) and utilities (XLU, -3.23%), two defensive sectors, are today's worst performers
- Gambling stocks ($DJUSCA, +3.17%) are off their earlier highs, but holding up extremely well on a relative basis; Wynn Resorts (WYNN, +13.13%) and Las Vegas Sands (LVS, +12.69%) are easily the best S&P 500 performers
Market Outlook
Our double bottom is now in the books. I did not believe we'd see this level retested, especially after our initial bounce carried us so far to the upside - above 4300 on the S&P 500. But we're back here and I can blame it on the Fed all I want. It really doesn't matter, because the fact is that we're testing the June closing low of 3666. Will we hold it? I think we will, but there's certainly no guarantee. We should be well aware that the Volatility Index ($VIX) finally broke out above 28 and ANY move into the 30s should be respected. I can support being aggressively long at this level, because of the significance of price support on the S&P 500, but if it's lost, we need to respect the high VIX readings and a breakdown. Prices can drop very, very quickly and quite significantly when panic is in the air. And VIX readings above 30 and rapidly-spiking equity only put call ratios ($CPCE) tell us that fear is with us. Here's a chart of the VIX, highlighting the importance of respecting a VIX this high:
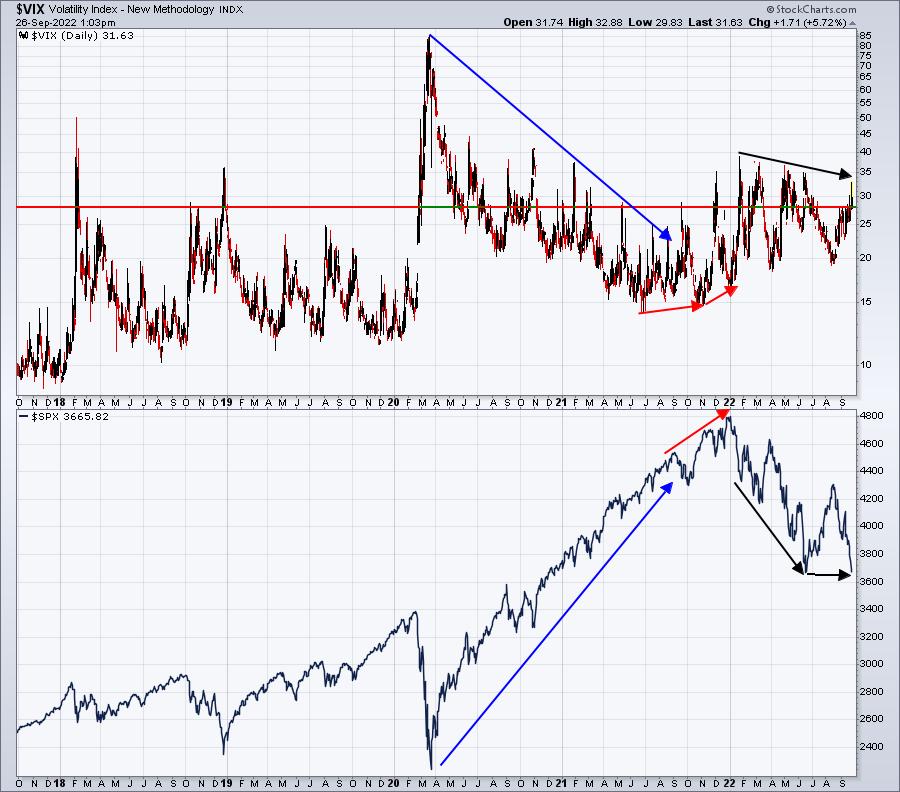
Those spikes above 30 the past several years have coincided with rapid declines and, ultimately, bottoms. But there's plenty of pain before the bottom prints. Note that rising S&P 500 prices normally coincide with lower VIX readings (blue directional lines). The final top in January 2022, however, saw the VIX lows rising (red directional lines) - unusual behavior that added to the bearishness at the top.
The black directional lines are slightly bullish, in my opinion. It's showing that fear is dissipating on every price low that we print. Fear is what drives impulsive selling and bear markets, so it stands to reason that if the fear is lessening at each low, perhaps we've printed the bottom already - or are about to do so.
Sector/Industry Focus
Interest rates have been the single-largest reason why this bear market continues to hang around. It's very easy to point out on a chart how the rising 10-year treasury yield ($TNX) has coincided with nearly every key market bottom in 2022. Today, the TNX is spiking once again, tacking on another 19 basis points to 3.89%. It's difficult to believe that we're going to explode higher, or even hold price support on the S&P 500, if the TNX continues soaring like this. Let me show you how conflicting that signals are right now. I'll provide you a 10-day hourly chart showing you the rising TNX and falling S&P 500 first:
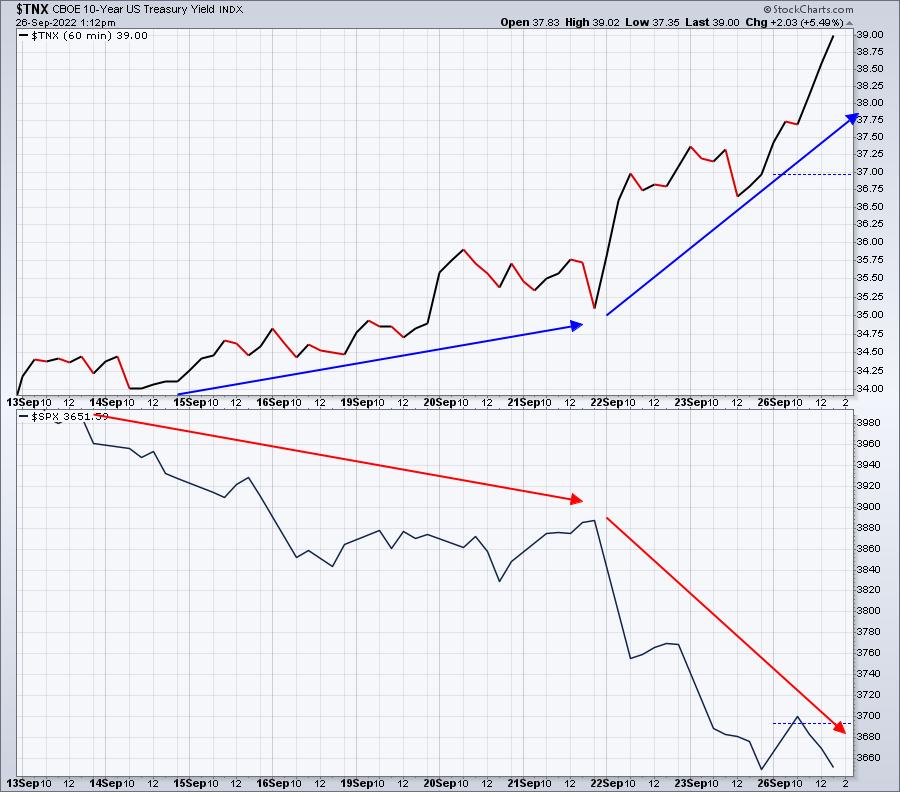
It appears rather obvious to me that as interest rates accelerate higher, the S&P 500 accelerates lower. But now we're at major price support and rotation has turned very bullish, which doesn't make a lot of sense. But check out this chart showing our key sustainability ratios:
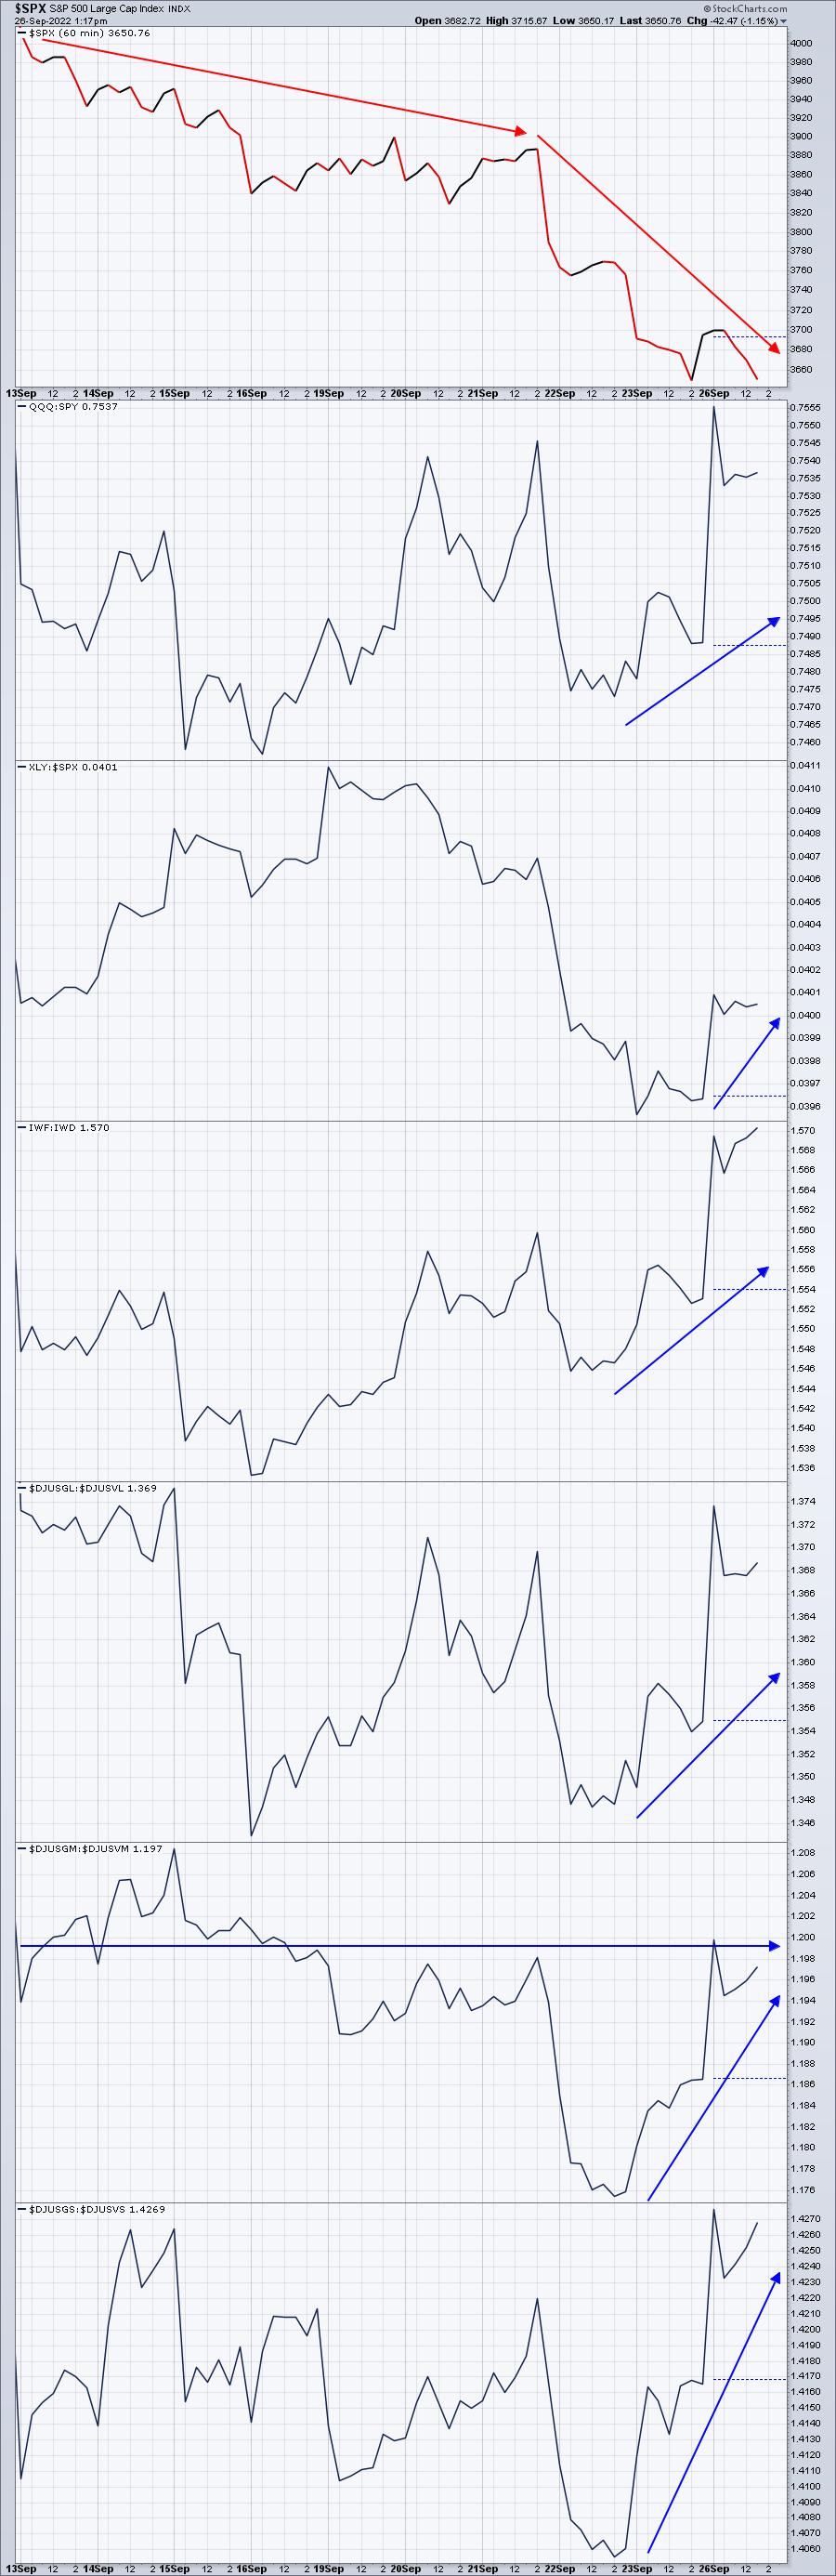
As we've seen some of our biggest selling the past few days, ALL of our ratios are turning higher. Aggressive areas are being bought on a relative basis. Why? I don't know, but I find it hard to feel bearish when I see this bullish rotation.
I'll say this. NOTHING is more important than price breakouts or price breakdowns. We can apply whatever charts or biases that we want, but a breakdown is a breakdown first and foremost. It should be respected. However, if we once again rally this afternoon, I'm going to find the sustainability ratios to be extremely bullish.
Let's watch the close. Remember, the S&P 500's low close from June was 3666 and its intraday low was 3636. Right now, the S&P 500 is at 3650, right squarely in the middle of those two.
ChartLists/Strategies
Let's talk about trading strategy on the Short Squeeze ChartList (SSCL), then I'll give a quick update how our Model Trades are performing today.
The SSCL houses stocks that have HUGE short positions relative to float (float is the total number of shares available for public investors to trade). The number of short shares must be 20% or more of that stock's float in order to be included on the SSCL. Many stocks are heavily shorted for good reason. Therefore, you should not assume they all make great trading candidates or investment. Many times, they'll continue downtrending for an extended period of time. Instead, what we want to wait for is strength to last long enough to begin to force shorts to cover (buy). If a SSCL stock closes at a 52-week low one day, a 5% gain the next day is not likely to trigger short covering as many shorts likely took their position at higher price levels. They're not going to be forced emotionally to cover their shares because of one day's strength. In fact, I normally don't consider a stock for a short squeeze unless it's momentum has turned positive (PPO > 1 on daily chart) and volume escalates above average - usually a LOT above average. That's when shorts are much more likely to feel financial pain with the potential for unlimited losses on the horizon. And when short covering begins, shorts are tripping over each other, trying to find the exit.
Currently, only FUBO and IBRX (just 2 of 38 stocks on the SSCL) fit that PPO criteria. IBRX had a short-squeeze-like surge a couple weeks ago as volume exploded higher and the PPO reached 10, but it's now trading back beneath its 20-day EMA and momentum seems to be fading. FUBO experienced an excellent push higher in early-August, but it's weakened since then, and volume has been mostly beneath average. Both need to accelerate higher before I'd be interested in trying to catch a squeeze. The other 37 stocks on the SSCL are very uninspiring at this point, so I'd avoid this ChartList for now.
On to our Model Trades:
SJM - slightly higher today, despite the market weakness. Continues to be a solid performer on a relative basis. Our target remains 144.00.
TXN - down fractionally today, which once again is better than its industry peer group, semiconductors ($DJUSSC). Our closing stop is 159.79 and our short-term target is 172.00
ENPH - this one is quite aggressive and it's showing just how much today. After gapping down a bit at the open, ENPH was up nearly 10 bucks in the first 30-45 minutes. It's now down 5 bucks. Our entries were at the opening bell (277.86) and a 2nd entry at 277.00, so we're in at an average of 277.43. Our closing stop is 268.00, while our target is the 20-day EMA, currently at 296.13.
TH - this is also fairly aggressive. We suggested two entries. The first triggered at the opening bell (12.31) and we have a second entry at 11.86 (has not triggered) and a tight closing stop beneath 11.86. Our target is the 20-day EMA, currently at 13.10.
Earnings Reports
Here are the key earnings reports for the next two days, featuring stocks with market caps of more than $10 billion. I also include several companies with market caps below $10 billion. Finally, any portfolio stocks that will be reporting results are highlighted in BOLD. If you decide to hold a stock into earnings, please understand the significant short-term risk that you are taking. Please be sure to check for earnings dates for any companies you own or are considering owning.
Monday, September 26:
None
Tuesday, September 27:
SNX, JBL, DAVA, BB, CALM, UNFI, CBRL, PRGS
Economic Reports
None
Happy trading!
Tom