
EB Daily Market Report - Tuesday, September 27, 2022
Executive Market Summary
- Futures were very strong overnight and our major indices gapped higher, with the NASDAQ leading on a relative basis
- We did open higher, but it's been difficult to extend the strength; in fact, our major indices have turned lower
- Sustainability ratios are performing well, however - more on these ratios below in Sector/Industry Focus
- The Volatility Index ($VIX) is moving towards the mid-30s, a bearish short-term development
- Cryptocurrencies are performing quite well given today's stock market weakness
- Crude oil ($WTIC, +1.30%) has rebounded back near $80 per barrel
- The 10-year treasury yield ($TNX) continues its unabated rise, spiking 9 basis points to 3.98% after falling 7 basis points at the open
- The S&P 500 just broke below the mid-June low of 3636, hitting 3635 as I write this
- Energy (XLE, +1.00%) is the only sector in positive territory; utilities (XLU, -1.63%) and consumer staples (XLP, -1.24%) - two defensive sectors - are the only sectors down more than 1% on the session
- This could be a WILD day, given the intraday break of support, the rising VIX, and the stretched equity only put call ratio ($CPCE) - please be careful!
Market Outlook
After starting the day off much lower earlier, the Volatility Index ($VIX) has moved into positive territory near 32.50 as I write this. The 5-day SMA of the equity-only put-call ratio ($CPCE) hit .81 at the close yesterday. Both of these sentiment readings are getting stretched. It doesn't mean that we're at a bottom, but if we're not, we're rapidly approaching one. Just remember that these readings should be viewed much like a rubber band. As the market falls further and further during an emotional period, the rubber band is being stretched more and more. When the bottom finally hits, we tend to see a VERY SIGNIFICANT rally and potentially a major bottom. Should the S&P 500 break below the 3636 low on June 17th, we could see a rapidly-deteriorating S&P 500 - until the rubber band snaps back. Unfortunately, it's very difficult to tell at what level it'll bounce. Fearful markets do not recognize price support. When they fall, it's like a hot knife through butter. Usually, what I do is I begin building a long position, knowing that I'm likely to lose money until that rubber band snaps back. Everyone must decide for themselves what type of risk you're willing to take. For some, it might make sense to wait for a reversal to begin getting more aggressive. Or for those of you that remain bearish, you can ride the wave lower if 3636 support breaks, but just be aware of the market's historical tendencies as sentiment deteriorates to the current level.
The S&P 500 also is now printing a 60-minute positive divergence, as you can see below:
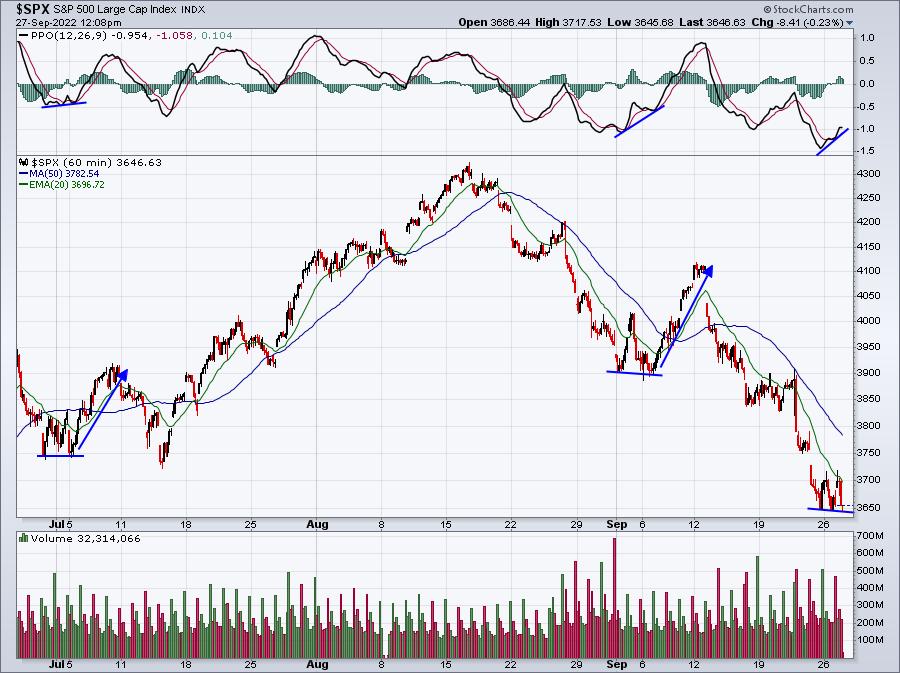
There are never any guarantees, especially when fear runs high, but positive divergences do generally suggest the short-term directional momentum is waning. We'll find out later today and into the balance of the week if that holds true now.
Sector/Industry Focus
I've received multiple questions from newer members, wanting to understand our "sustainability" ratios and how to use them. Over the years, I've watched the intermarket relationship between certain indices, sectors, asset classes, etc. to determine which of these ratios tend to track the S&P 500. It just makes common sense to me that when the stock market is rising, it's important what areas are leading the market higher. If defensive or value-oriented areas are leading, it's a signal that Wall Street is not committed to that move higher. However, if more traditionally-aggressive areas are leading, it can be a great sign that the market uptrend is "sustainable." That's the whole purpose. It's a common sense thing for me. Throughout my research, I believe the MOST reliable ratio to help me understand the "psyche" of the stock market is the XLY:XLP ratio. The XLY is a market-cap weighted ETF (exchanged-traded fund) that tracks the key consumer discretionary stocks. Amazon.com (AMZN) and Tesla, Inc. (TSLA) are very heavily-weighted components and will be significantly responsible for the performance of the XLY. Consumer staples is represented by the XLP and this ETF is also market-cap weighted, though it's a bit less concentrated in top names than the XLY. The key contributors to the XLP are Proctor & Gamble (PG), Coca Cola (KO), PepsiCo (PEP), and Walmart (WMT).
The following is a weekly chart of the S&P 500 over the last 20 years. Beneath it is the XLY:XLP ratio and in the bottom panel is the correlation coefficient to show positively the S&P 500 is correlated to the XLY:XLP over 20-week periods over the past 20 years:
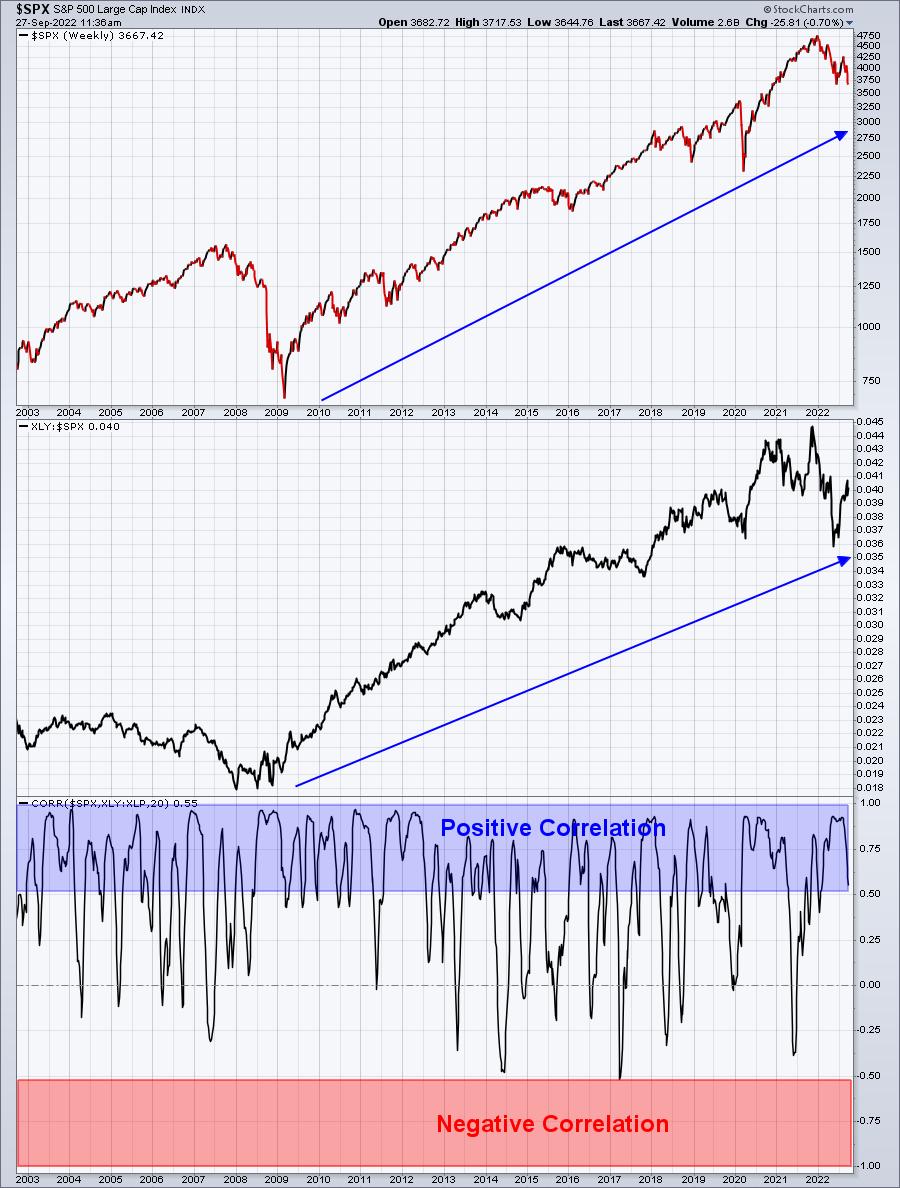
This is a rather confirming visual that the S&P 500 and the XLY:XLP tend to move in similar fashion. I like to highlight the +0.5 to +1.0 positive correlation with the blue-shaded area. Obviously, the S&P 500 and XLY:XLP ratio move in the same direction quite often. When you look at the bottom of this panel, however, 2017 was the ONLY time in 20 years where these two showed any significant negative, or inverse, correlation. I think it's pretty safe to arrive at the conclusion that these two move together.
But the next questions from members have been, "Why does the XLY:XLP ratio matter if it simply moves in the same direction as the S&P 500? What information does that provide us?" Well, think about our economy. It's generally strengthening. Occasionally we see moderate weakness, or even a recession, but mostly quarterly GDP is positive. During periods of economic strength, consumer discretionary stocks will typically perform better. If you're feeling good about the economy, your job, your financial picture, your home value (if you own a home), your 401(k) balance and savings for your future, you might be more likely to buy a Starbucks frappuccino or latte. You'll spend more if you feel wealthier. During a period of economic contraction, you might pass on those discretionary purchases. Think about this question. Do you buy more toothpaste and soap when the economy is strong? Do you buy less of it when the economy is weak? I hope you buy (and use) the same no matter what. Staples purchases tend to remain more constant, no matter the economy. Therefore, it stands to reason that consumer staples companies are likely to have a more consistent earnings picture, correct? Consumer discretionary companies, on the other hand, can see their profits go up and down based on how consumers are feeling.
By watching this ratio, can you see early trend reversals on Wall Street where the big firms begin rotating into more defensive areas of the market, even though the market goes higher. This can be one VERY IMPORTANT piece of the market puzzle. December 2022 was an absolutely perfect example of why I grew more bearish simply based on what the S&P 500 was doing vs. what the XLY:XLP was doing. It's also one of the reasons I've grown more bullish since June 2022. Check this out:
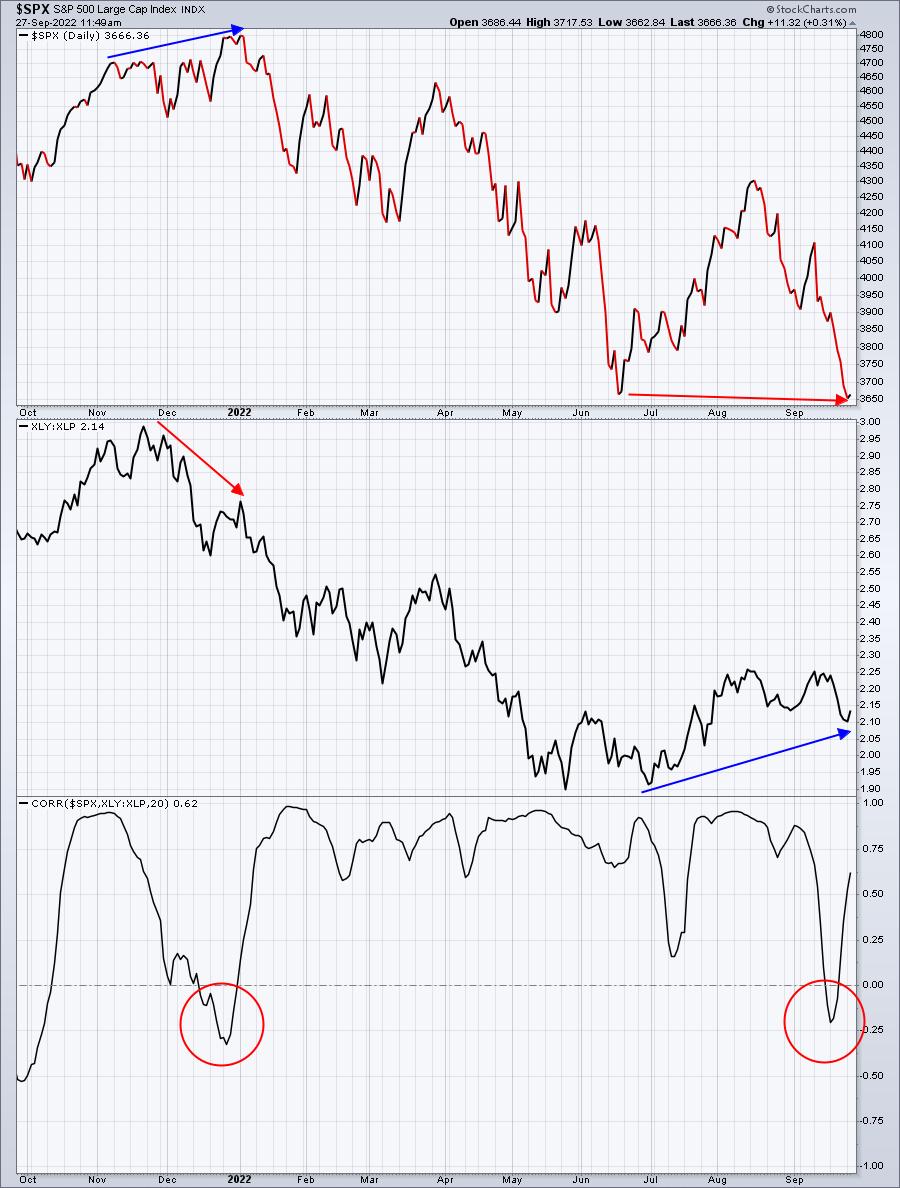
Do you see the divergences here? Back in December 2022, the S&P 500 was rising as if everything was still perfect. But Wall Street was rotating OUT of discretionary and INTO staples. The stock market looks AHEAD. If everything is "fine" with the future outlook, why would money rotate to the defensive staples sector? IT WOULDN'T! That's why this ratio is so important to follow. After the brief "negative" correlation, everything moved together again to the downside.....until June 2022. At that point, the S&P 500 found new price lows, but the XLY:XLP turned higher as Wall Street began moving INTO discretionary and OUT OF staples. If Wall Street is looking ahead and thinking higher interest rates, runaway inflation, etc, why in the heck would they rotate to discretionary stocks? THEY WOULDN'T! So this piece of the puzzle is telling me that Wall Street is positioning for a rally ahead. Will it happen? I have NO idea, but I'm listening to Wall Street's story, not CNBC's.
While the XLY:XLP is the most reliable ratio, in my view, I also like to see how the NASDAQ is performing vs. the S&P 500. The QQQ:SPY ratio does the trick there. In the meantime, I also like to follow the growth vs. value ratios. To do so, my favorite is the IWF:IWD (large cap growth vs. large cap value), but there are others like the:
- $DJUSGL:$DJUSVL (large cap growth vs. value - similar to IWF:IWD)
- $DJUSGM:$DJUSVM (mid cap growth vs. value)
- $DJUSGS:$DJUSVS (small cap growth vs. value)
Another interesting ratio that I follow pits transports vs. utilities ($TRAN:$UTIL). This one is not so favorable right now, but it's the only one. All of the others bottomed in June and are much higher now.
I hope this helps to explain these ratios a bit more and why I find them to be so important.
ChartLists/Strategies
Today, I want to talk about our Strong Future Earnings ChartList (SFECL) and also provide an update on our Model Trades.
The SFECL was designed to capture technically-healthy stocks that did NOT make it onto our Strong Earnings ChartList (SECL). Remember, in order to qualify for the SECL, companies MUST BEAT both quarterly revenue and earnings per share (EPS) estimates. If they match or fall short of expectations, they CANNOT be on the SECL. But that can leave off companies that continue to perform very well technically. Enter the SFECL. In order to qualify for the SFECL, there's a two-step process. The first is to separate the best-performing industry groups from the weakest-performing industry groups. This is a subjective test, but here's how I generally break this down. There will be exceptions from time to time, but I look at the relative chart of each industry group relative to the S&P 500. If the relative WEEKLY PPO is above zero AND current relative price action is above BOTH the 20-week EMA and 50-week SMA, that industry would be considered a STRONG industry. Those industries not meeting this criteria would be considered a WEAK industry. Again, there are exceptions, but this is the general rule that I follow. Once the industry groups are broken down, I run a separate scan for each, with the difference being that I'll accept stocks with SCTRs (SCTR = StockCharts Technical Rank) > 75 from strong industry groups, but I require SCTRs > 90 for stocks from weak industry groups. In other words, if an industry group is weak, a stock within that weak industry group needs to be a STELLAR performer to be included. I also only include stocks > $5 and I filter for liquidity. Stocks must AVERAGE 50-day SMA volume in excess of 200,000. Once these scans are run, they are merged into the SFECL. The final step requires deleting all stocks in the SFECL that are already in the SECL. Once this step is complete, the SFECL is final. In the end, it provides us a list of the best momentum stocks in stock market that are NOT already on the SECL.
Here's an update of our Model Trades:
SJM - consumer staples stocks are flat today, so the tide is not favorable for SJM. It is, however, up slightly for the day and remains a viable trade.
TXN - semiconductors are up nicely on a relative basis, which is helping TXN. It gapped higher, retested the Monday close, and is now up roughly 0.75%. 159.79 remains the CLOSING stop, in the event selling kicks in later today.
ENPH - currently up nearly 6%, was up more earlier in the session. We have a target of the 20-day EMA, currently at 295.67. If ENPH hits 297.00, we'll take profits.
TH - also has a target of the 20-day EMA, which is currently 13.07. Today's high was 13.03, but if 13.07 is hit, we'll take profits. At last check, TH was up 6.25% on the session.
I quickly scanned stocks on the SFECL and found ALT's setup to be interesting. First, it's a biotech ($DJUSBT) stock, so it automatically should be viewed as VERY aggressive. Recently, ALT gapped down to 11.93 and traded as low as 11.16 before rallying strongly throughout the day to finish at 14.87. Clearly, there were plenty of buyers from 11.16-11.93. Today, ALT hit a low of 11.94 and has rallied slightly back to 12.15:
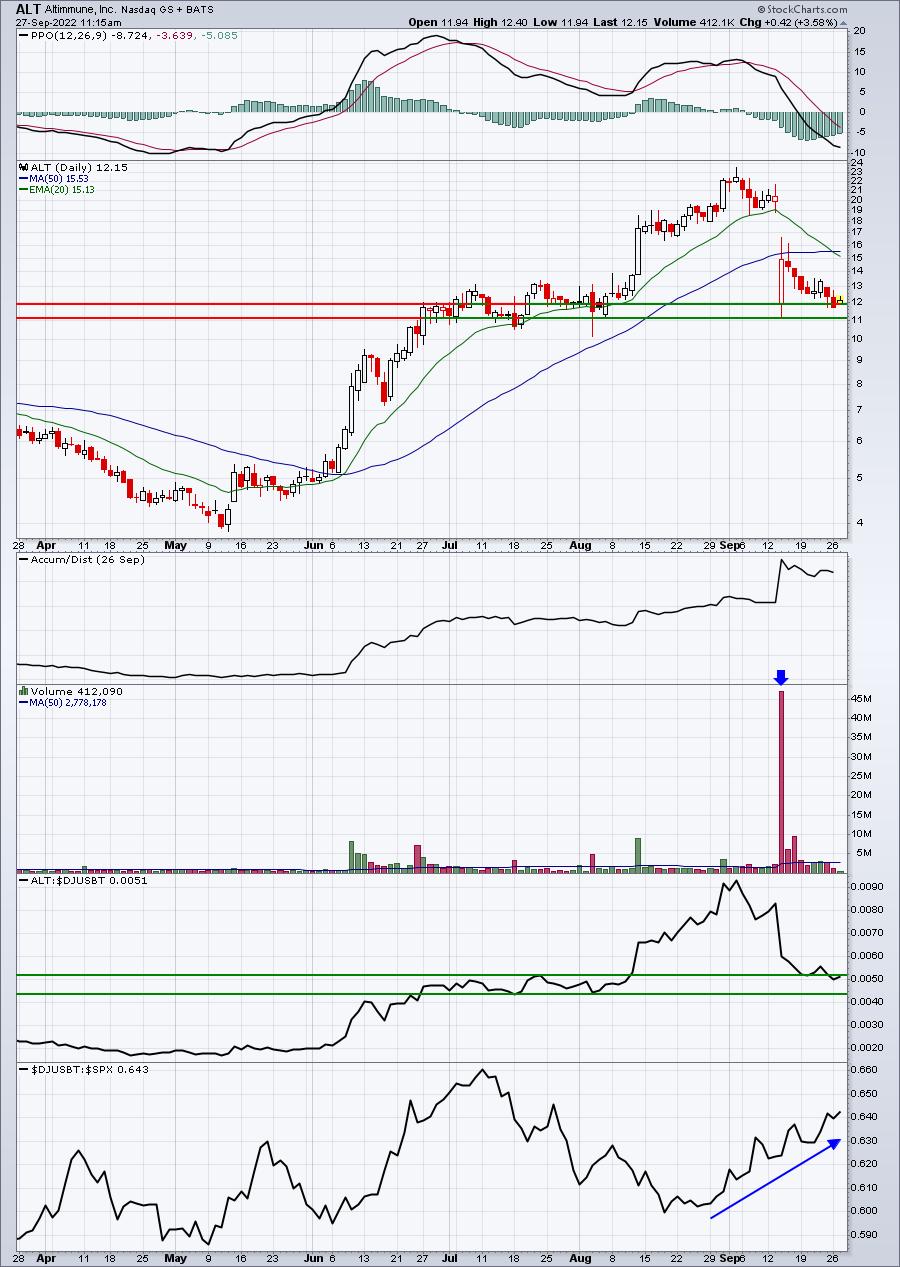
Assuming you're ok with the higher risk of trading biotech stocks, entering ALT at the current price and again at 11.93 with an INTRADAY stop beneath 11.16 would make good technical sense. 14.75-15.00 would be my target. There is always a big risk of big gaps (in either direction) in biotech stocks, because of drug news. But if you're ok with the risk, the return could be substantial.
Earnings Reports
Here are the key earnings reports for the next two days, featuring stocks with market caps of more than $10 billion. I also include several companies with market caps below $10 billion. Finally, any portfolio stocks that will be reporting results are highlighted in BOLD. If you decide to hold a stock into earnings, please understand the significant short-term risk that you are taking. Please be sure to check for earnings dates for any companies you own or are considering owning.
Tuesday, September 27:
SNX, JBL, DAVA, BB, CALM, UNFI, CBRL, PRGS
Wednesday, September 28:
PAYX, CTAS, MTN, JEF, CNXC, THO
Economic Reports
August durable goods: -0.2% (actual) vs. -0.4% (estimate)
August durable goods ex-transports: +0.2% (actual) vs. +0.1% (estimate)
July Case-Shiller home price index: -0.8% (actual) vs. +0.3% (estimate)
July FHFA house price index: -0.6% (actual) vs. +0.0% (estimate)
September consumer confidence: 108.0 (actual) vs. 104.3 (estimate)
August new home sales: 685,000 (actual) vs. 498,000 (estimate)
Happy trading!
Tom