
EB Daily Market Report - Wednesday, September 28, 2022
My Schedule
I'm among the 17 technical analysts that StockCharts.com has invited to speak at ChartCon 2022. The event will be held on October 7th and 8th (Friday and Saturday). I will be traveling to Redmond, WA on Thursday, October 6th and will not be returning until Tuesday, October 11th. Our schedule at EarningsBeats.com will obviously be significantly impacted. At this time, I'm expecting to do Trading Places LIVE on Wednesday morning, October 5th, but I will not likely do another show until Wednesday, October 12th. There will be no EB Digest articles on either Friday, October 7th or Monday, October 10th. I will not be writing a Daily Market Report from Thursday, October 6th through Tuesday, October 11th. John Hopkins, if available, may provide a quick update each of those days.
ChartCon is available to everyone, but there is a fee. For more information on speakers, agenda, and cost, you can CLICK HERE. I know there will be a significant savings for StockCharts.com members - as much as 67% off - so taking out at least a free 30-day trial subscription prior to signing up would make good financial sense, if you're not already a StockCharts.com subscriber.
Executive Market Summary
- Futures were lower overnight, but reversed after the Bank of England announced it would begin buying long-dated bonds in order to calm the bond market there
- Our major indices gapped slightly higher at the open; after a brief 30-minute period of selling, buyers stepped in
- The 10-year treasury yield ($TNX) is down a stunning 23 basis points, it's largest one-day drop since March 2020; as a result, the dollar (UUP, -1.35%) is tumbling and gold ($GOLD, +2.05%) is finally showing strength
- Economic reports today showed inventory builds, as I've been discussing recently; this is deflationary, not inflationary
- August pending home sales dropped 2.5x the expected 0.8%, falling 2.0% for the month
- All 11 sectors are higher today, led by energy (XLE, +3.90%), communication services (XLC, +3.29%), and consumer discretionary (XLY, +2.42%)
- Technology (XLK, +0.77%) is lagging as its largest component, Apple (AAPL, -1.67%) is not participating
- Biogen (BIIB, +39.25%) is soaring after a positive announcement on a blockbuster alzheimers drug
Market Outlook
The rally today is right on cue, according to one key sentiment reading that I follow very closely. History tells us to expect a market rally when bearish sentiment reaches extreme levels. Here's a chart showing that the 5-day SMA of the equity-only put-call ratio ($CPCE) and what happens when the .75-.80 level is touched:
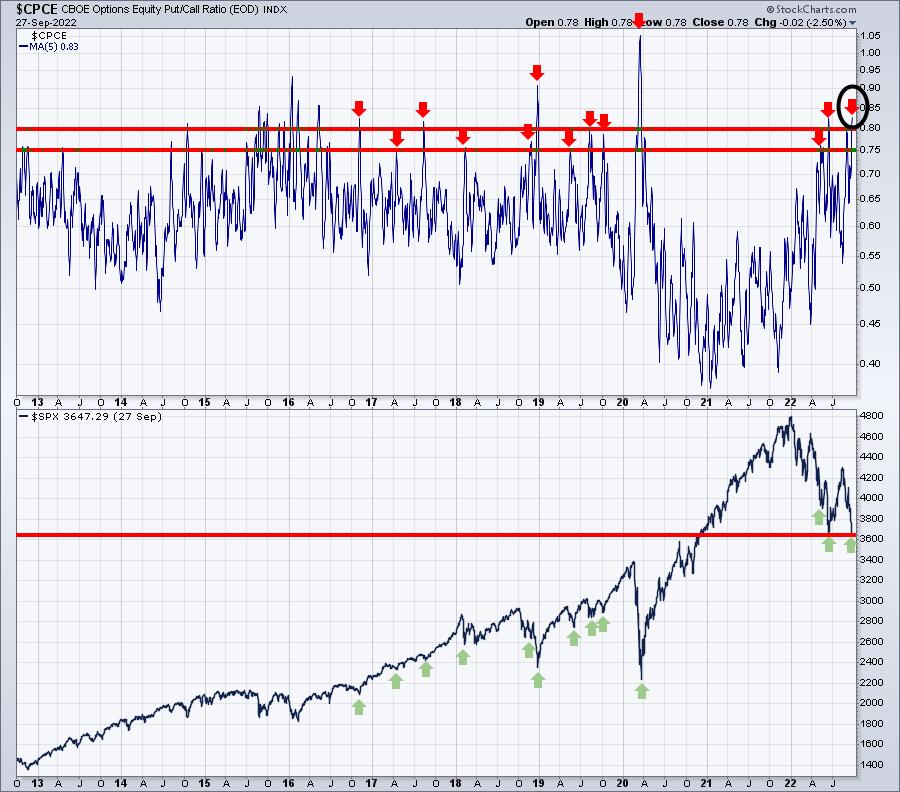
In addition to seeing an extreme 5-day reading of the CPCE, the S&P 500 hit price support and formed a potential double bottom. After today's market rally, this double bottom will be critical support in the future.
Sector/Industry Focus
There's been so much talk about how our economy is going to weaken substantially, because of the Fed's aggressive rate hikes. I don't doubt it, but Wall Street doesn't trade based on what fundamental stories might develop. The 25% drop from the January high to the double bottom low has ALREADY PRICED IN WEAKNESS. Wall Street looks forward, not behind. Are you worried about a potential worsening economy impacting stock prices? I can tell you that Wall Street is not. While we've seen the S&P 500 shed more than 550 points in one month (since Fed Chair Powell's Jackson Hole speech), guess where Wall Street has been repositioning? Well, the good thing about EarningsBeats.com is that we don't have to guess. Here's our Industry Group Relative Strength ChartList that summarizes leadership over the past month - while all that selling took place:
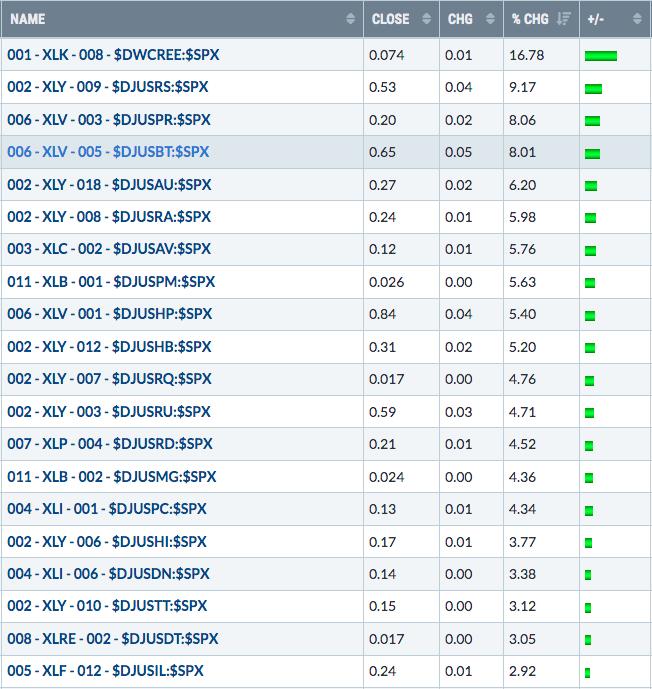
Those are the Top 20 (out of 104) industry groups during this big market selloff. 8 of the top 20 belong to the consumer discretionary group. You think Wall Street is worried about a big recession ahead? If so, then ask why money is rotating HEAVILY into that area? Wall Street feels we're going to be just fine later this year and into 2023. The media is still freaking out, but Wall Street isn't.
Neither am I.
ChartLists/Strategies
Today, I want to talk about our Raised Guidance ChartList (RGCL) and also provide an update on our Model Trades.
We began tracking companies that raised guidance many months ago. We annotate all of the charts on this ChartList, highlighting with a black-dotted vertical line the date the guidance was raised. I also check out the chart, highlighting one or two key areas of price support - generally established after the guidance was raised. One stock on the RGCL that I really like at the current price is Unitedhealth Group (UNH). I would be looking for a pre-earnings push higher and today's reversal couldn't come at a better time:
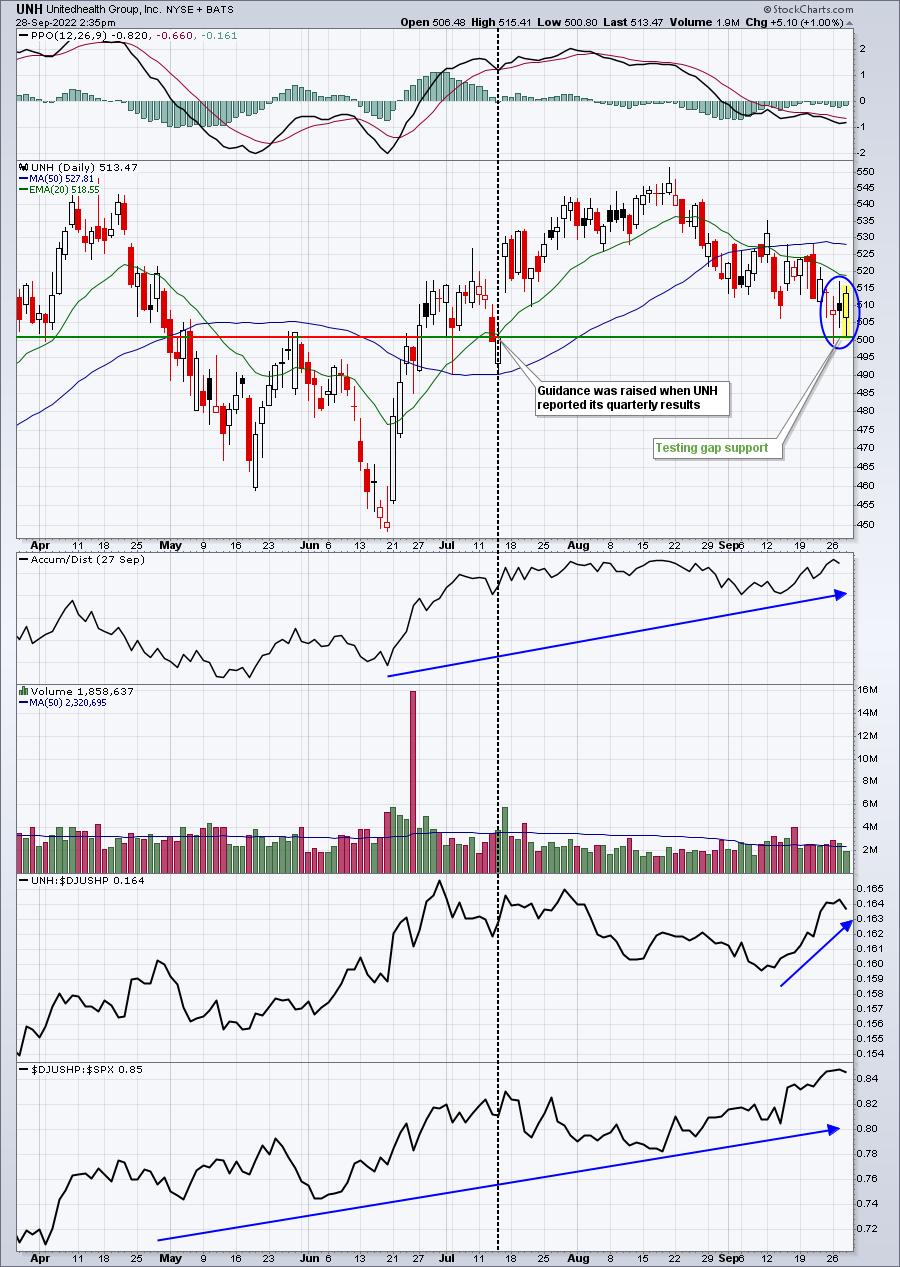
I like entry at the current price and again at 501, should it get there again. I like a rally to carry UNH back to its previous high, so my target would be near 545. My closing stop would be 500 to keep any losses minimal.
Here's an update of our Model Trades:
SJM - had a rough afternoon yesterday and closed beneath our closing stop, so we'll take a small loss here. It performed well on a relative basis, while the S&P 500 was clobbered. Therefore, I'd give the trade a solid grade. It's impossible to make money on every trade, especially during volatile periods.
TXN - continues to trade above our closing stop of 159.79. Let's see if TXN can make a run from here.
ENPH - showing just modest gains here today. We'll keep a target of 297.00 in place.
TH - the 20-day EMA is 13.01 and TH's high earlier was 13.01, so we'll take the profit where we had previously indicated - at the 20-day EMA. That's a solid short-term gain.
Yesterday, I provided an aggressive trading candidate that's worked out quite well. Here's what I wrote yesterday and the chart I provided: "I quickly scanned stocks on the SFECL and found ALT's setup to be interesting. First, it's a biotech ($DJUSBT) stock, so it automatically should be viewed as VERY aggressive. Recently, ALT gapped down to 11.93 and traded as low as 11.16 before rallying strongly throughout the day to finish at 14.87. Clearly, there were plenty of buyers from 11.16-11.93. Today, ALT hit a low of 11.94 and has rallied slightly back to 12.15:
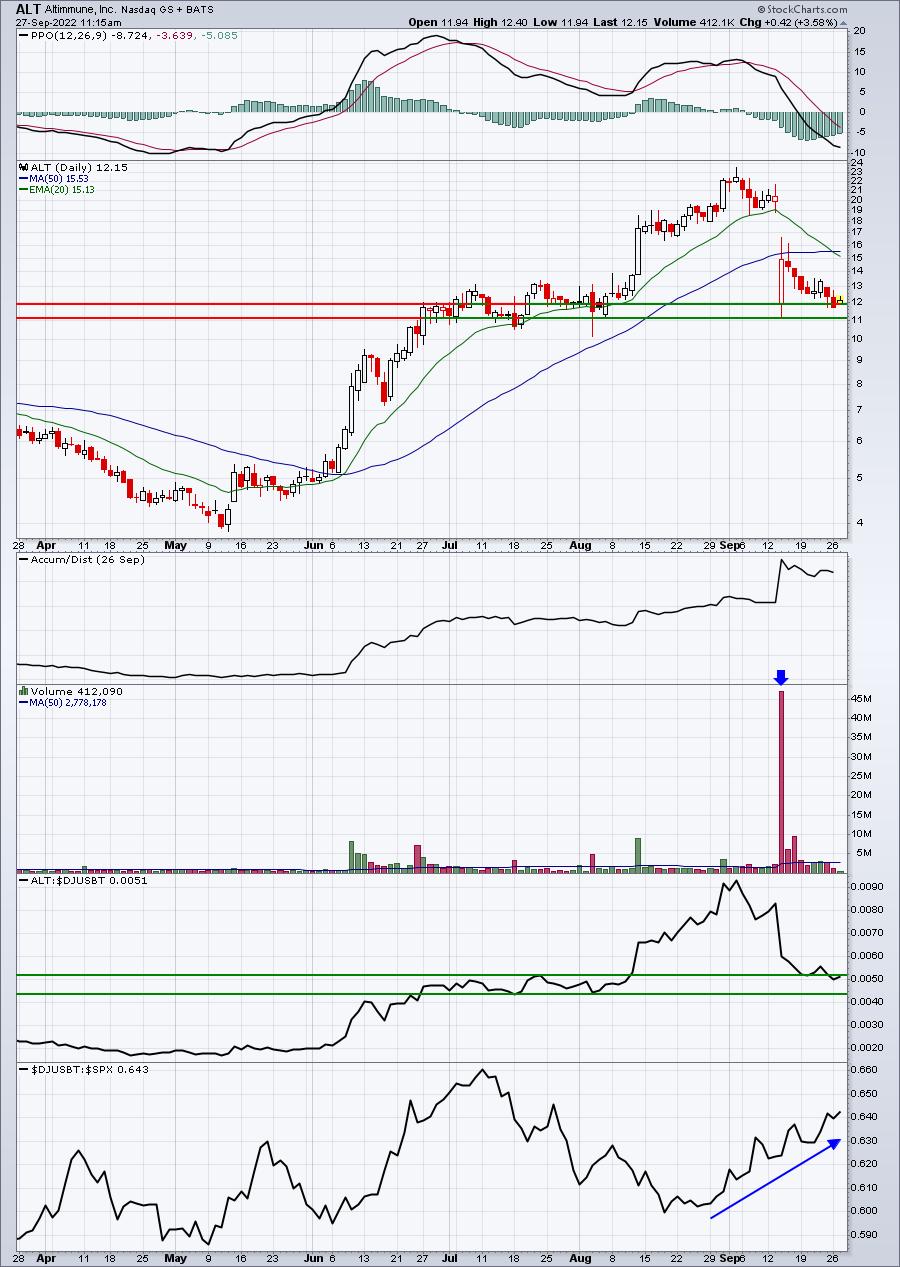
Assuming you're ok with the higher risk of trading biotech stocks, entering ALT at the current price and again at 11.93 with an INTRADAY stop beneath 11.16 would make good technical sense. 14.75-15.00 would be my target. There is always a big risk of big gaps (in either direction) in biotech stocks, because of drug news. But if you're ok with the risk, the return could be substantial."
ALT never triggered the second entry at 11.93, but check out the rebound today:
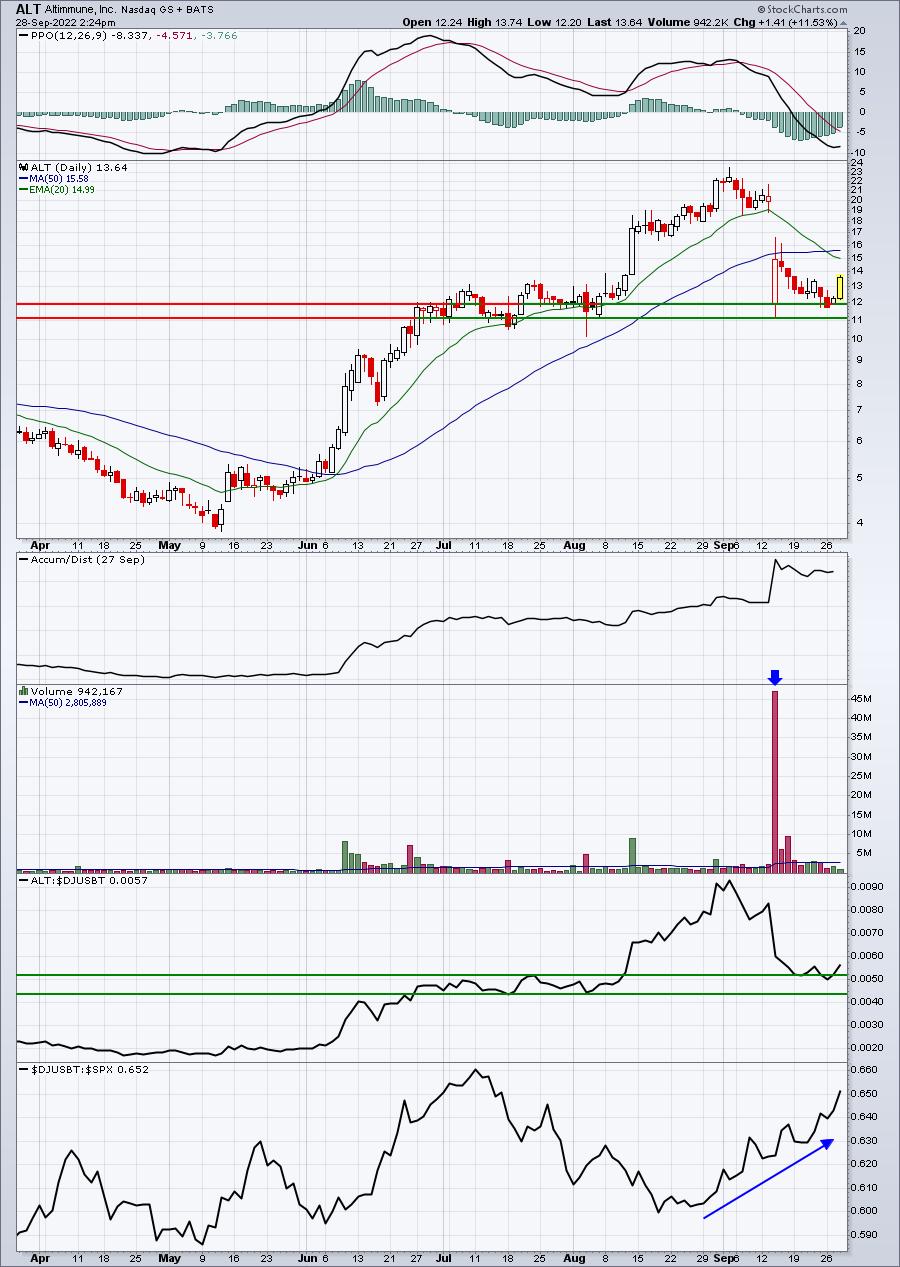
An 11.5% gain in one day is gold for a trader. I wouldn't care how much higher it traded. I'd take the money and RUN!
Earnings Reports
Here are the key earnings reports for the next two days, featuring stocks with market caps of more than $10 billion. I also include several companies with market caps below $10 billion. Finally, any portfolio stocks that will be reporting results are highlighted in BOLD. If you decide to hold a stock into earnings, please understand the significant short-term risk that you are taking. Please be sure to check for earnings dates for any companies you own or are considering owning.
Wednesday, September 28:
PAYX, CTAS, MTN, JEF, CNXC, THO
Thursday, September 29:
NKE, MU, KMX, WOR, BBBY
Economic Reports
August retail inventories: +1.4% (actual) - no estimate provided
August wholesale inventories: +1.3% (actual) vs. +0.4% (estimate)
August pending home sales: -2.0% (actual) vs. -0.8% (estimate)
Happy trading!
Tom