
EB Daily Market Report - Thursday, September 29, 2022
My Schedule
I'm among the 17 technical analysts that StockCharts.com has invited to speak at ChartCon 2022. The event will be held on October 7th and 8th (Friday and Saturday). I will be traveling to Redmond, WA on Thursday, October 6th and will not be returning until Tuesday, October 11th. Our schedule at EarningsBeats.com will obviously be significantly impacted. At this time, I'm expecting to do Trading Places LIVE on Wednesday morning, October 5th, but I will not likely do another show until Wednesday, October 12th. There will be no EB Digest articles on either Friday, October 7th or Monday, October 10th. I will not be writing a Daily Market Report from Thursday, October 6th through Tuesday, October 11th. John Hopkins, if available, may provide a quick update each of those days.
ChartCon is available to everyone, but there is a fee. For more information on speakers, agenda, and cost, you can CLICK HERE. I know there will be a significant savings for StockCharts.com members - as much as 67% off - so taking out at least a free 30-day trial subscription prior to signing up would make good financial sense, if you're not already a StockCharts.com subscriber.
Executive Market Summary
- Futures were weak overnight, but improved until the GDP and initial claims were released this morning
- In the GDP report, personal consumption expenditures (PCE) rose 2.0%, much more than the 1.5% estimate
- Initial claims surprisingly fell below 200,000; both reports triggered fears of higher interest rates
- Selling was everywhere this morning, but the NASDAQ clearly took the biggest blow
- Apple (AAPL, -4.69%) has seen a series of downgrades and received another this morning
- Technology (XLK, -2.83%) is down as all industry groups have moved lower, but computer hardware ($DJUSCR, -4.58%) is the primary culprit due to AAPL
- Consumer discretionary (XLY, -3.28%) is the worst-performing sector, hampered by a very weak automobile group ($DJUSAU, -5.95%)
- Tesla, (TSLA, -6.06%) is testing key short-term price support near 270; if that's lost, gap support at 255 would likely be next
- The 10-year treasury yield ($TNX) initially spiked this morning back to 3.83%, or up 13 basis points, but it's since given much of those gains back; the TNX is currently up 5 basis points to 3.75%
- Carmax (KMX, -23.36%) missed its earnings by a wide margin ($.79 vs. $.1.40); it also came up well short of revenue expectations and is today's worst S&P 500 performer, by far
Market Outlook
The S&P 500 set another 2022 and cyclical bear market low today at 3619, just a few points beneath the prior low of 3623 established on Tuesday. The 5-day SMA of the equity-only put-call ratio hit another high as well at .836. This is an EXTREME reading and underscores the bearish sentiment permeating the stock market. If we look at an hourly chart of the S&P 500, it's clear to me, at least on a short-term basis, what we need to reverse the current bearish momentum. Check this out:
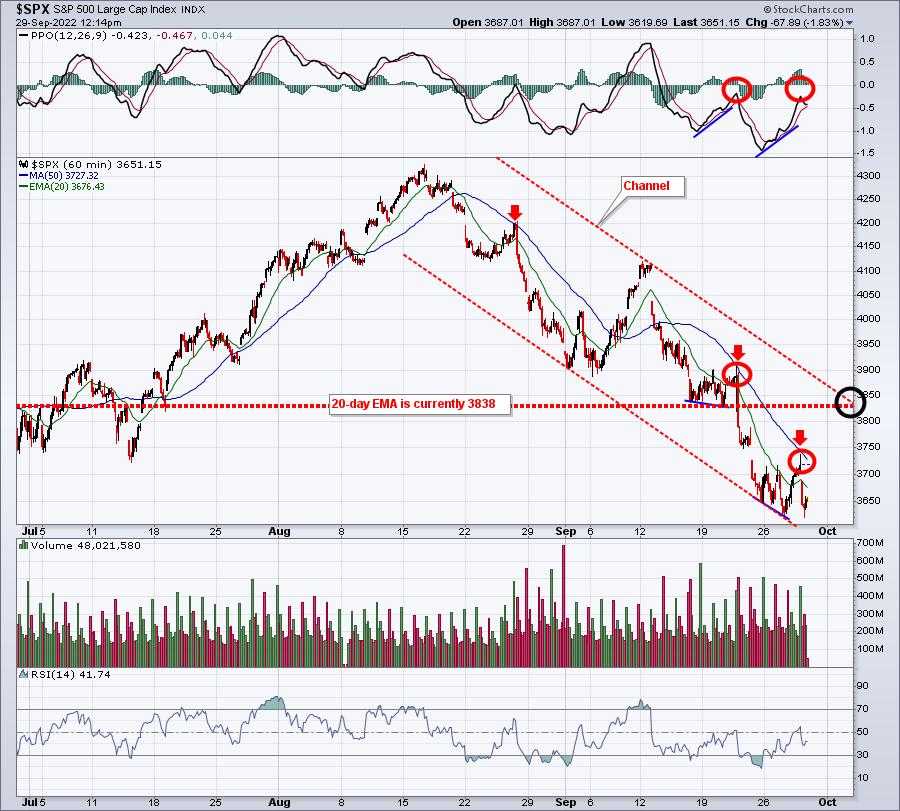
The red circles show how the S&P 500 has failed to negotiate the PPO centerline and the 50-hour SMA after the recent positive divergences formed (red circles). Also, I've drawn red-dotted channel lines to highlight the current downtrend. Finally, the red-dotted horizontal line marks the current 20-day EMA, which is at 3838. A CLOSE back above 3838 (black circle) does a lot of things technically for the chart. To really begin thinking much more bullish thoughts, this is the MINIMUM level that we need to clear. Until that happens, we need to remain somewhat cautious. We can still be bullish and we can still trade on the long side, but just respect the downtrend and keep your "lines in the sand" clearly marked just in case this bear market digs its claws in deeper.
Sector/Industry Focus
I'm about to publish our October Seasonality (should be out tomorrow) and you'll see that financials really love the months of October and November. One of the industry groups in this sector, property & casualty insurance ($DJUSIP), is testing key price support and is already strong on a relative basis:
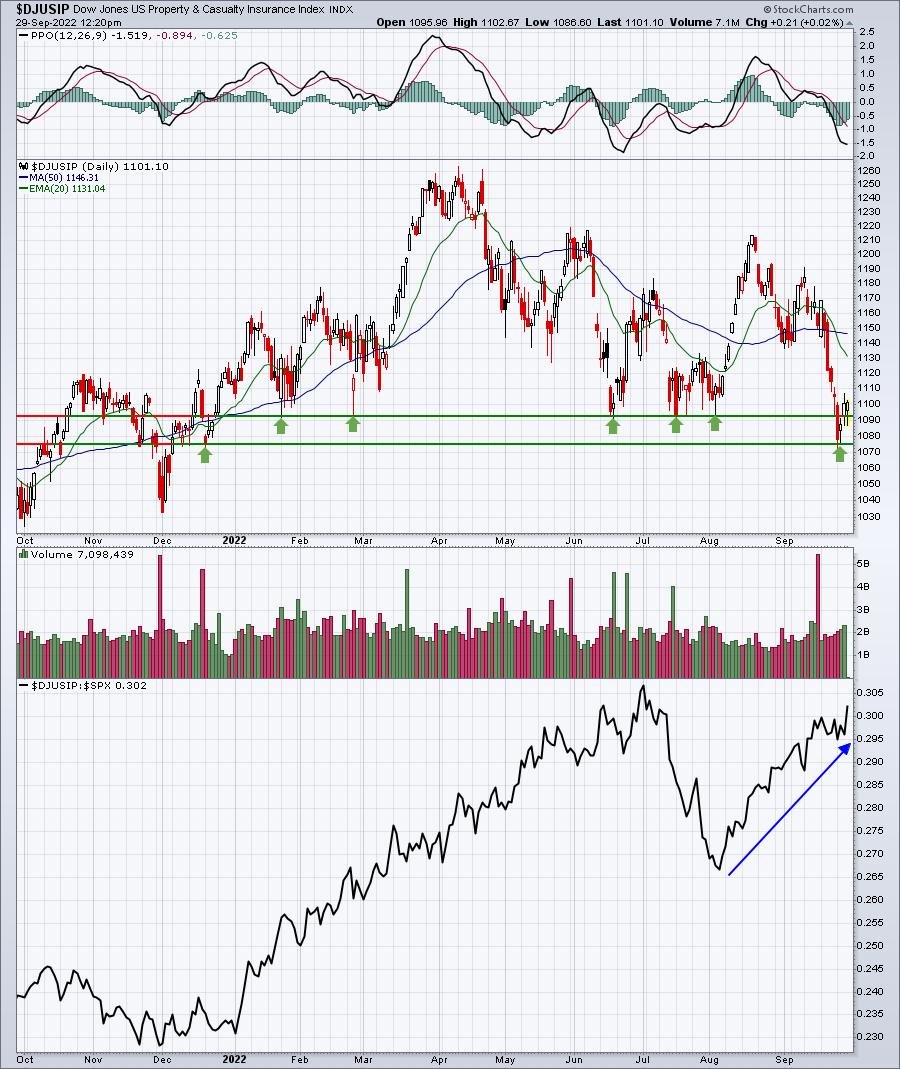
This is a group that I might use to search individual stocks in our various ChartLists for potential trades. The group is showing excellent relative strength, it's bouncing off a support zone, and seasonality favors the financial sector.
ChartLists/Strategies
Today, I want to talk about our Strong AD ChartList (SADCL) and also provide an update on our Model Trades.
The purpose of our SADCL is to uncover stocks that are showing very strong AD (accumulation/distribution) lines. AD lines are generally driven by how stocks finish in the afternoon session. AD lines are calculated by seeing where a stock closes relative to its high and low for the day, and then using volume as the multiplier. To simplify, the AD line will rise when a close is above the midpoint between the intraday high and intraday low. It differs from the On Balance Volume (OBV) indicator in one key respect:
The OBV only considers whether you closed higher or lower from the prior day. ALL volume for that day is either added to or subtracted from the cumulative total based on whether a stock closes higher or lower from the prior day. The AD line can move substantially higher even if a stock finishes the day much lower than the prior day, so long as its close is above that intraday midpoint discussed above. The prior day's close is NOT considered at all in the AD line calculation.
We update the SADCL approximately once per month. There is consideration for relative strength as I generally use a minimum SCTR score of 75. I will also accept stocks with SCTR scores above 75 at prior dates, if I feel there was a significant top in the S&P 500 as of a certain date. I want to know which stocks had SCTRs of 75 or higher at those key dates (leaders), then I can evaluation the AD lines and determine if I want to include each stock in the SADCL. This is a very subjective analysis.
My trading strategy with the SADCL is to look at stocks struggling in the morning that might be testing key price support or a moving average, and look for recovery in the afternoon. Many times, I use these as day trades. I enter in the morning, usually late morning (11am-ish ET), and exit on afternoon strength. Remember, it's this type of trading pattern - morning weakness, afternoon strength - that contributes to a strong AD line. So I try to take advantage of these stocks using this strategy.
Here's what the worst performers on the SADCL look like as of 11:50am ET:
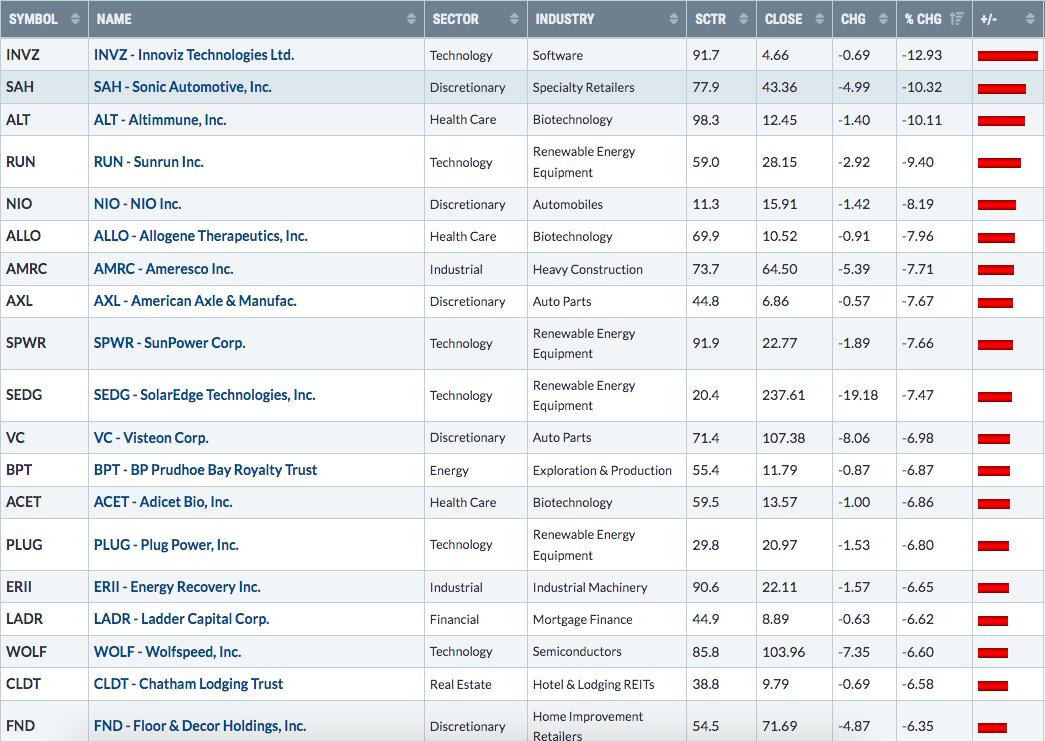
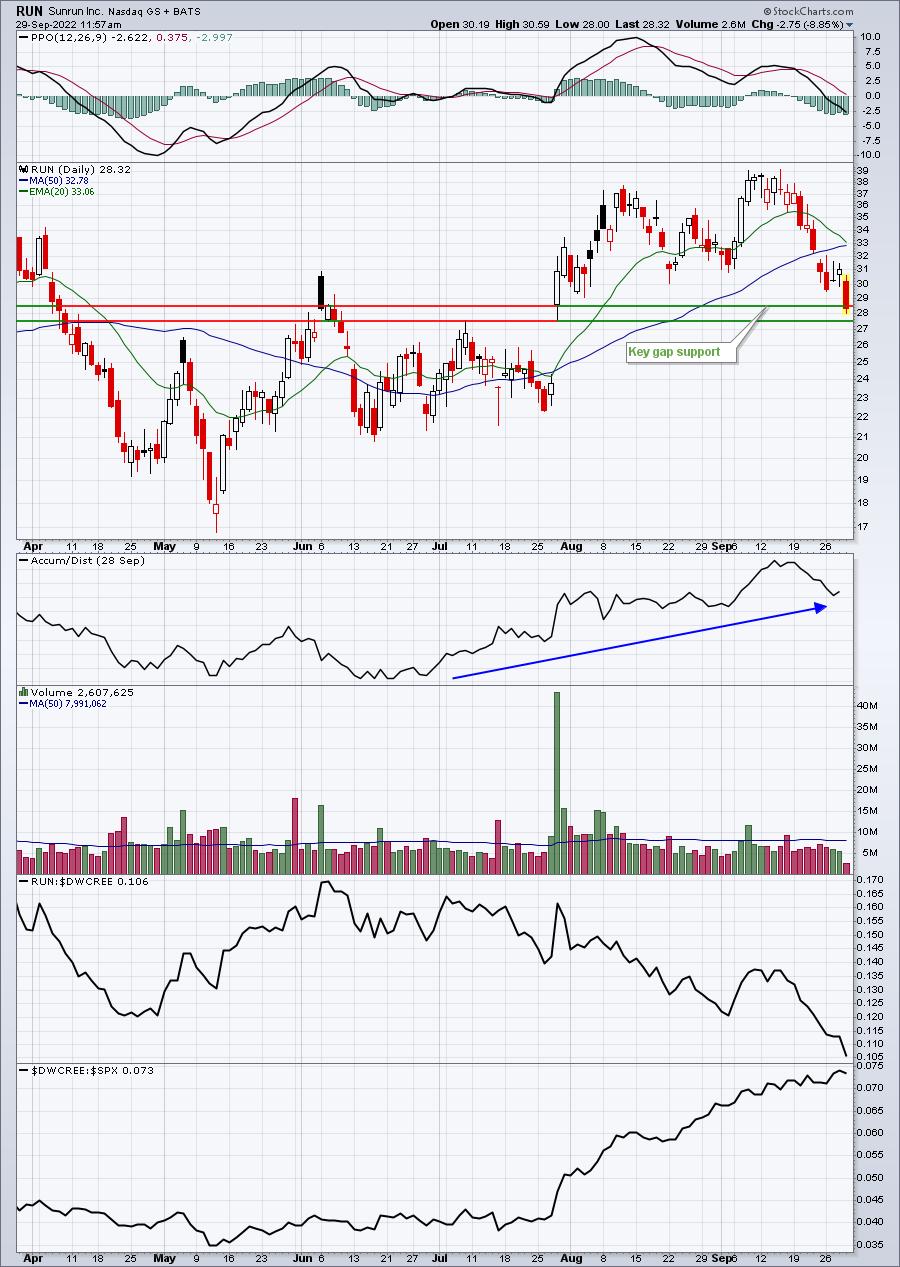
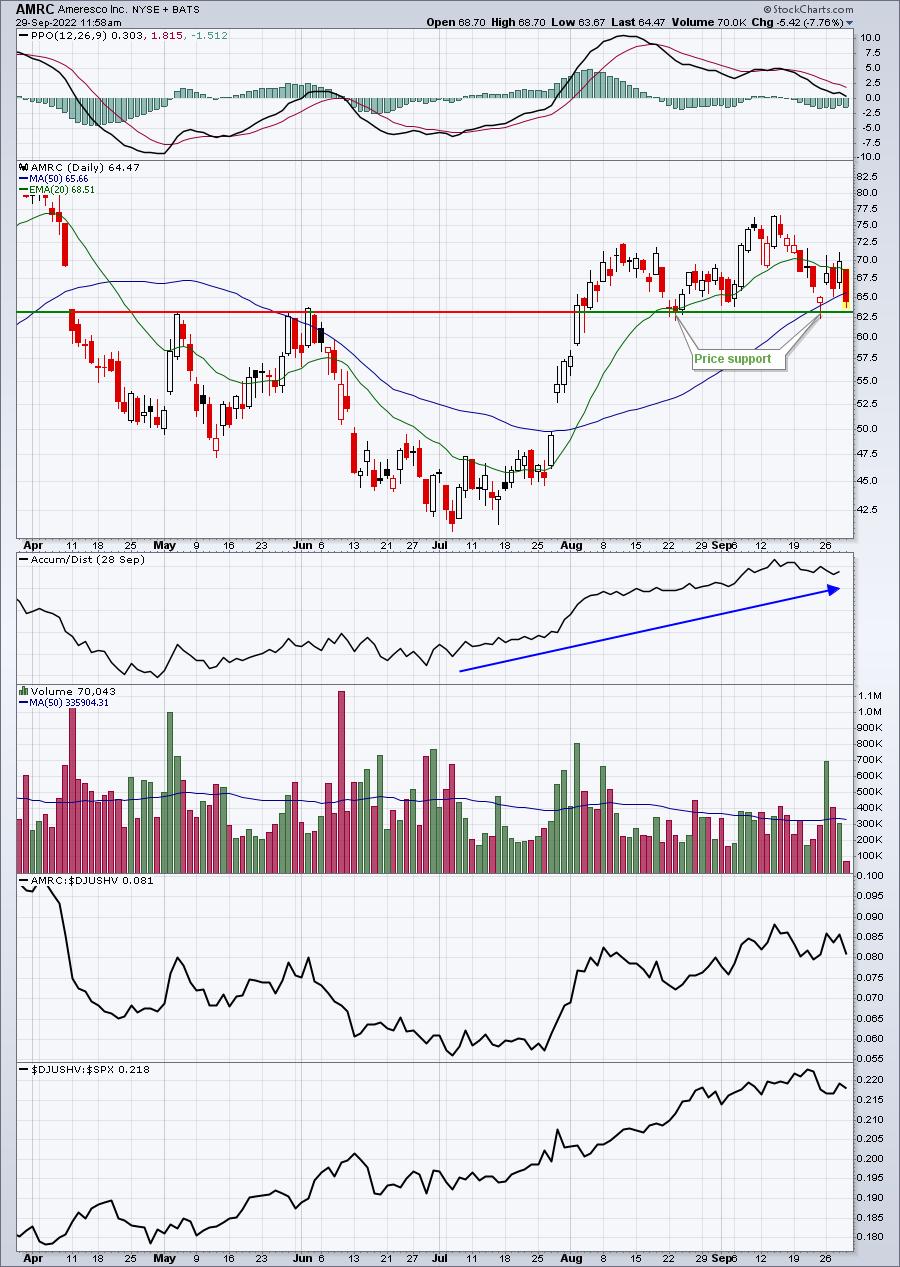
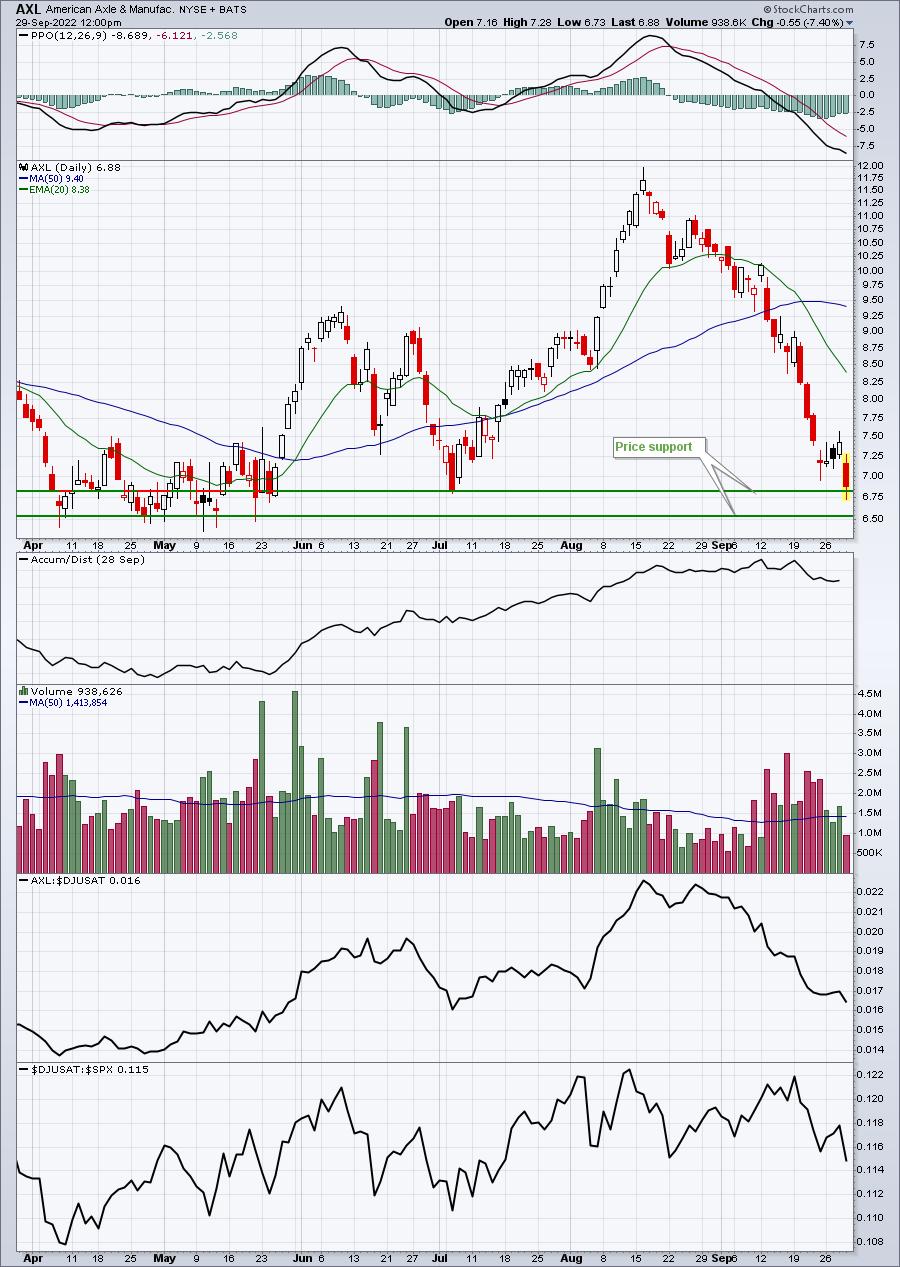
Here are four that look VERY interesting:
RUN:
AMRC:
AXL:
WOLF:
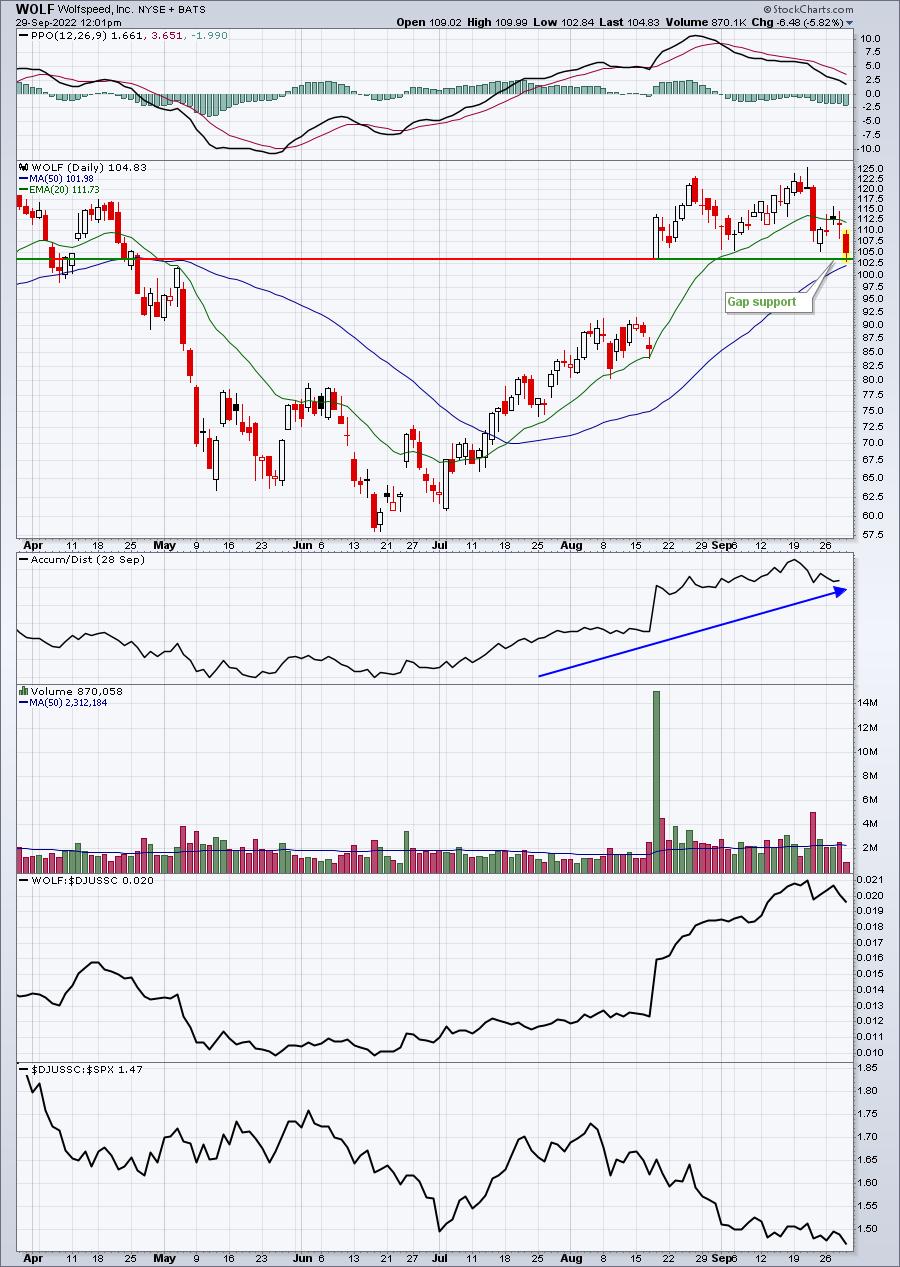
Look at the AD lines on all four stocks. They're rising. They rise because these stocks tend to close in the upper half of their candlesticks. All four stocks are also at or very near key price and/or gap support. My preference of the four is WOLF, because it's one of our portfolio stocks. I've been waiting patiently for this one to test gap support.
(Disclosure: I bought WOLF at gap support and will exit if this support fails to hold at the close. WOLF is a semiconductor and can be extremely volatile, so please understand the high risk if you decide to trade it)
Here's an update of our Model Trades:
SJM - stopped out yesterday with a minor loss.
TXN - Our closing stop is 159.79. TXN is currently trading at 157.59 and will be sold at today's close barring a very strong reversal.
ENPH - for the second day in a row, ENPH traded solidly higher to the 294 level. However, our target was set at 297, so we remain in it. It's fallen back significantly today (-5.10%), and is very close to where it was when we entered.
TH - took profits yesterday on the 20-day EMA test at 13.01.
Earnings Reports
Here are the key earnings reports for the next two days, featuring stocks with market caps of more than $10 billion. I also include several companies with market caps below $10 billion. Finally, any portfolio stocks that will be reporting results are highlighted in BOLD. If you decide to hold a stock into earnings, please understand the significant short-term risk that you are taking. Please be sure to check for earnings dates for any companies you own or are considering owning.
Thursday, September 29:
NKE, MU, KMX, WOR, BBBY
Friday, September 30:
CCL
Economic Reports
Q2 GDP (Final): -0.6% (actual) vs. -0.6% (estimate)
Q2 personal consumption expenditures: +2.0% (actual) vs. +1.5% (estimate)
Happy trading!
Tom