
EB Daily Market Report - Wednesday, October 12, 2022
Trading Places LIVE
I apologize for not doing TP Live this morning. I had every intention to do so, but was exhausted after returning from Seattle late in the day on Tuesday. I'll be back next Monday and Wednesday with Trading Places LIVE at EarningsBeats.com.
ChartList Update
I'll be updating the following ChartLists over the next day or two:
- Strong Earnings (SECL)
- Strong Future Earnings (SFECL)
- Raised Guidance (RGCL)
- Short Squeeze (SSCL)
- Upcoming Earnings (we'll start these as of Friday to coincide with the kickoff of earnings season)
Strong ETF Portfolio - Sneak Preview
This event will be held this afternoon at 4:30pm ET. I'll describe the process I go through in establishing this portfolio, with the ultimate goal being to outperform the benchmark S&P 500. We'll provide you a link later this afternoon. If you cannot make the event live, we'll record it for you and you can view it at your leisure.
ChartCon 2022
What a conference! It was so much fun and it was great getting together with the best of the best, in terms of technical analysis history and skill. I met both Ralph Acampora and Larry Williams for the first time. Perhaps the most interesting discussion I had all weekend was with Jay Woods. You've likely seen Jay if you watch CNBC. He appears on the NYSE floor quite often. Jay is the NYSE Executive Floor Governor and market maker for IMC. What a great chat we had! It was the first time I was able to gain insights into trading from a REAL market maker. Many of my manipulation suspicions were mostly confirmed by Jay - market makers ABSOLUTELY attempt to coerce us into making trades that ultimately benefit the market maker. It gives me the incentive to do even more research to benefit all of us.
I also saw the StockCharts.com new office for the first time, including, of course, their brand new studio for StockCharts TV. Overall, it was AWESOME to see everyone for the first time in four years and we discussed ways that we can work together in the future to benefit all EB.com members.
Executive Market Summary
- Futures were higher overnight as the first key September inflation report approached
- September PPI came in slightly above expectations, while core PPI matched estimates
- Our major indices did gap higher, but then pulled back into negative territory; we've been trading fractionally higher since
- Consumer stocks are strong today as staples (XLP, +1.29%) and discretionary (XLY, +0.41%) are the best and third-best sectors, respectively
- Utilities (XLU, -1.74%) and real estate (XLRE, -1.16%), easily the two worst sectors over the past month, are seeing relative weakness again today
- Renewable energy ($DWCREE, -3.92%) is struggling today as Enphase Energy's (ENPH, -3.05%) weakness continues
- Meanwhile, strength in Moderna (MRNA, +10.71%) is helping health care stocks break to an all-time relative high, meaning that its representation in the S&P 500 has never been higher
- PepsiCo (PEP, +4.38%) reported its latest quarterly results and its stock is jumping
Market Outlook
After piercing the June 17th S&P 500 low of 3636 nearly two weeks ago, the S&P 500 has traded mostly sideways. We are currently about 1% beneath that previous low, which I thought would be the ultimate low, especially after the huge July/August recovery. However, that is not the case - we have a new low. For me, it still comes down to sentiment and rotation, in addition to the very important combination of price and volume. The latter favors the bears, no doubt. Volume has been above average and we've pushed to new lows. That is NOT bullish. On the new lows this week, though, we do see a higher daily PPO (positive divergence) on the daily chart, while we're also printing a positive divergence on the hourly PPO. Check out both positive divergences here:
S&P 500 - daily chart:
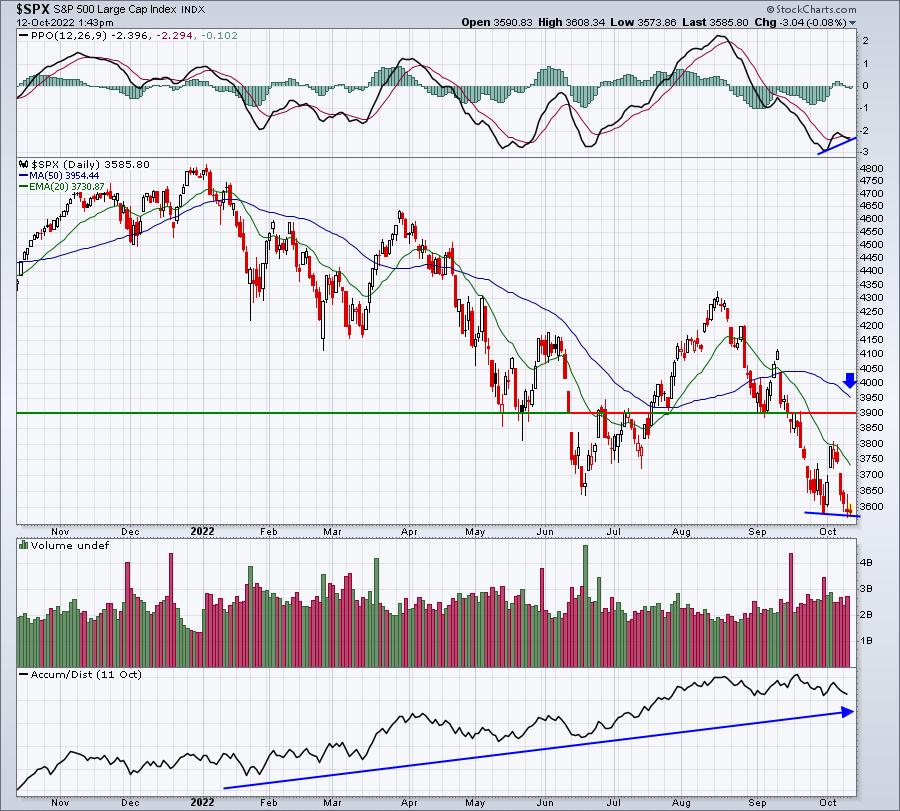
The AD line, I believe, is a signal that big money on Wall Street has no problem buying into all the selling of retail traders. This also lines up with the manipulation research that I've discussed in the past, where buyers seem to pour in during the afternoon session, while much of the selling takes place at the opening bell and in the first 30-60 minutes of trading. Since May, the selling has been all GAPS, with very little actual distribution taking place. That has not changed. That, along with the positive rotation into risk-on areas of the market, tells me that my opinion in June that we were marking a bottom still holds true today.
S&P 500 - hourly chart:
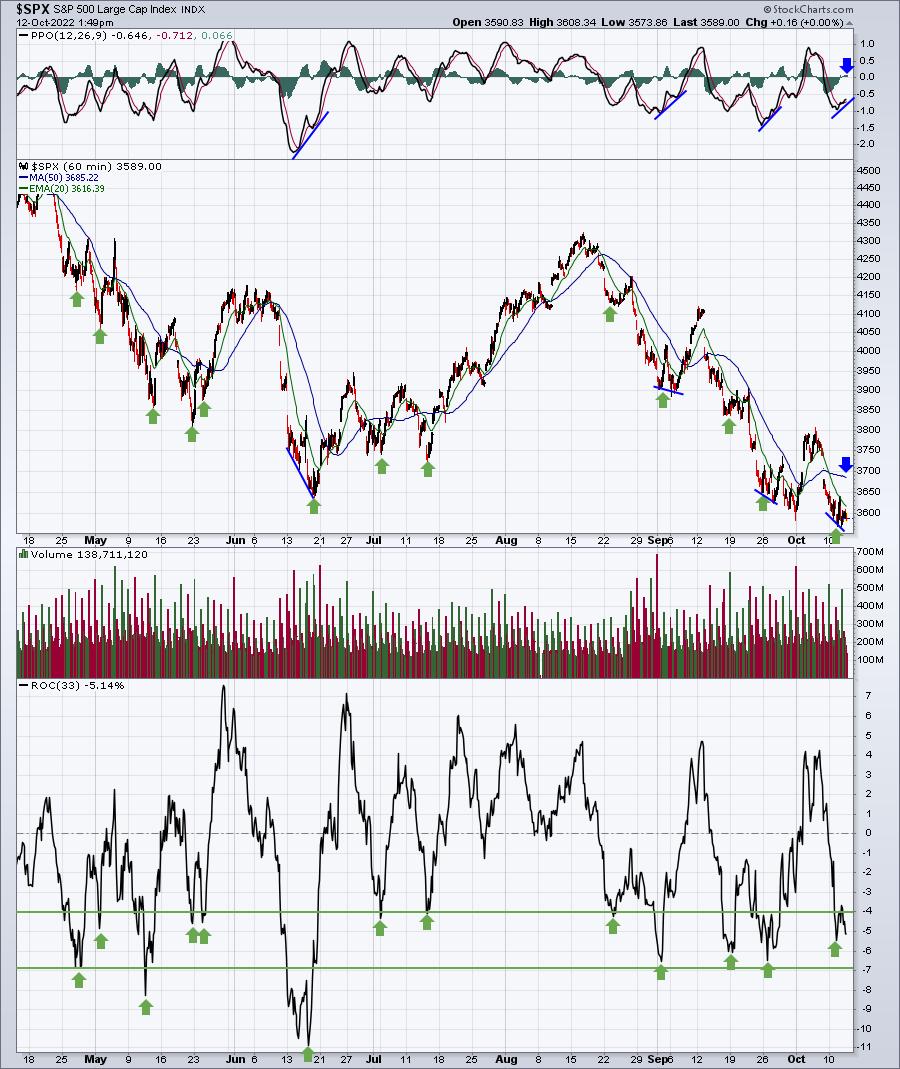
The bottom of this chart is a 33-hour rate of change (ROC), which is essentially one week. Over the past several months, note that 1-week ROC's in the -4% to -7% is generally where we've seen the bulls jump in. We're now at -5% with negative divergences on both the hourly and daily charts. That's a sign of slowing selling momentum.
These charts suggest that downward momentum is slowing. But we have the Fed minutes coming out very shortly (2pm ET) and we'll get the latest CPI data at 8:30am tomorrow morning. Given that traders are paying close attention to inflation and interest rates, these two releases are BIG and could have significant impact on short-term price action.
If there's nothing that shocks traders, we could be in for a "buy on the news" type of rally. We've been selling mostly since mid-August and we essentially have a double bottom in play. If, however, the news is bad and traders push the "panic sell" button, a VERY swift move to the downside is possible. I don't believe that's going to happen, but I can offer no guarantees.
My strategy of late has been consistent. I had a solid first 8 months of the year as I felt we were going to see a significant correction (best case) or a cyclical bear market (worst case) in the first half of 2022 that would take the S&P 500 to 4300 (minimum) or a range of 3500-3800 (maximum). As we now know, the latter cyclical bear market is what's actually occurred, with many traders still wondering if this is a secular bear market. I do not. I had a strong first 8 months of the year, so I'm perfectly content holding the QQQ (ETF that tracks the more aggressive NASDAQ 100) for now. I could potentially move some of the QQQ into the leveraged QLD (2x the NASDAQ 100) if I believe a reversal is at hand and we begin to trend higher. I'm comfortable holding the QQQ as I believe we are going to have a strong rally in Q4 and into 2023, based primarily on a Fed pivot and decreasing treasury yields. We've yet to see either, however, so everyone must make their own call.
Sector/Industry Focus
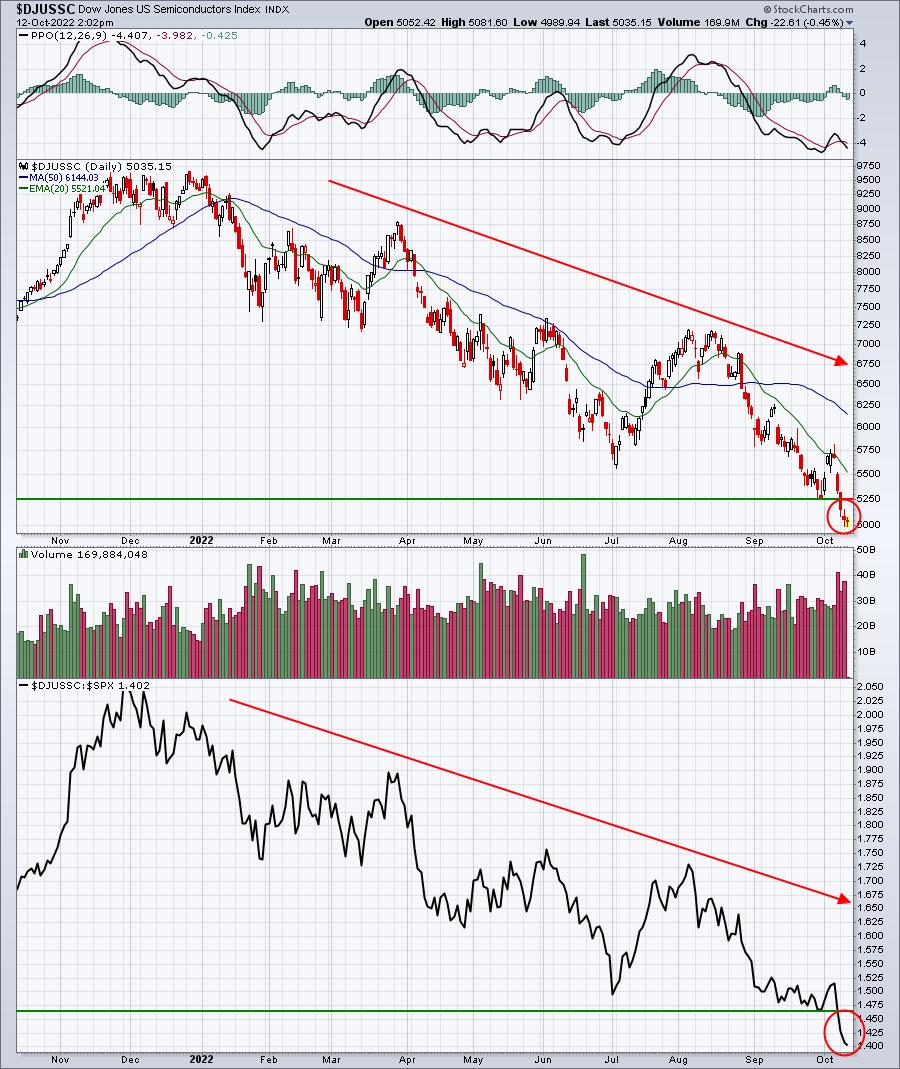
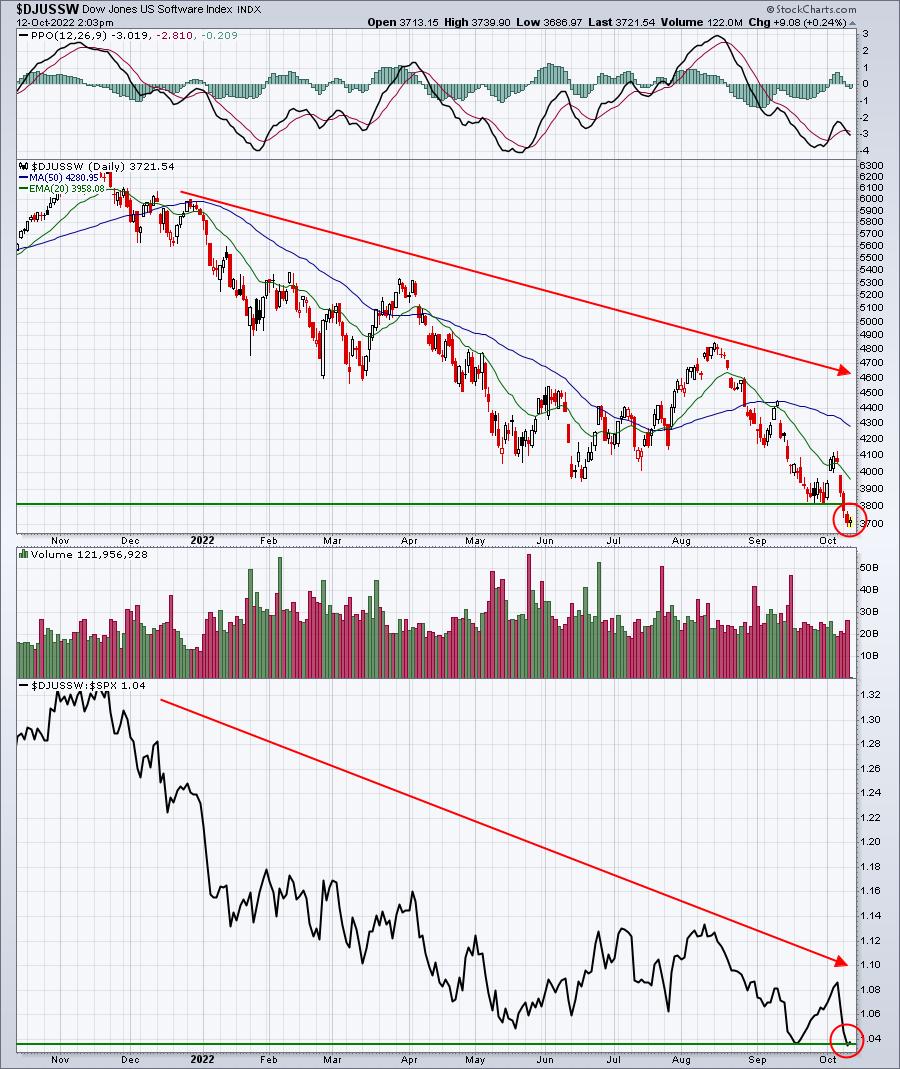
There are 3 key industry groups that I'd like to see bottom and begin moving higher. I suspect, based on their lengthy downtrends and relative weakness, that we're going to see some weak earnings reports this quarter. Advanced Micro Devices (AMD), a semiconductor, already warned about its earnings and I believe there'll be plenty of others. But will it be "sell on rumor, buy on news?" We could see an exhaustive gap lower at some point, but we're not there just yet. Check out these 3 absolute and relative charts:
Semiconductors ($DJUSSC):
Software ($DJUSSW):
Internet ($DJUSNS):
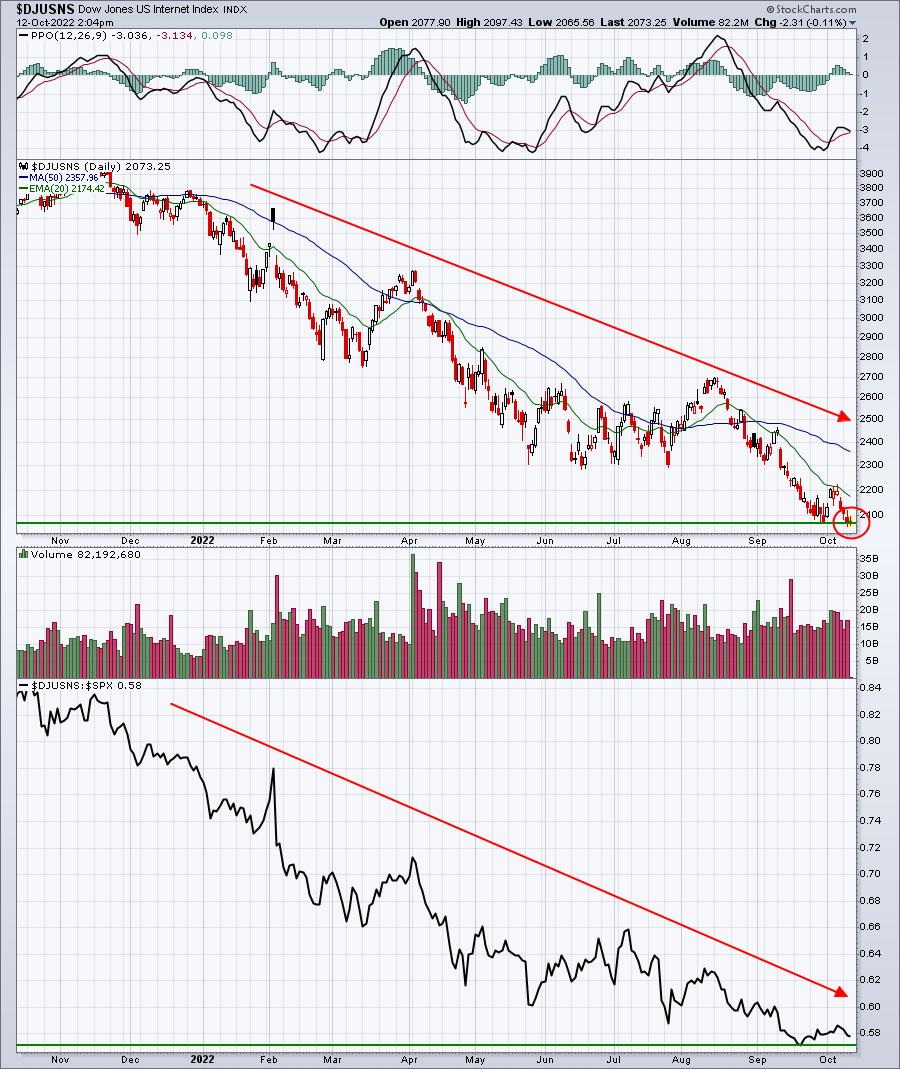
Until these 3 groups begin moving higher, rallies will face headwinds that'll be difficult to overcome in the long-term. We could see short-term rallies, but the sustainability will be called into question without leadership from these 3 secular bull market leaders.
ChartLists/Strategies
Given the state of the market while I've been in Redmond, WA, there was no reason to force trades. Recently, and thankfully, we decided to remove Enphase Energy (ENPH) and take profits when it hit our target at 297, even though I had given though to raising our target to 320. It's currently trading at 251. It can be extremely painful holding growth stocks during volatile periods like the one we're in. It's not a bad idea at all to take profits when given the opportunity. The only Model Trade that we added recently was Cadence Design Technologies (CDNS) on a pullback to its 20-day EMA. We kept a closing stop beneath 160, because of the significance of that price support level. We got stopped out, and we don't like losing trades, but check out the additional carnage since getting stopped out:
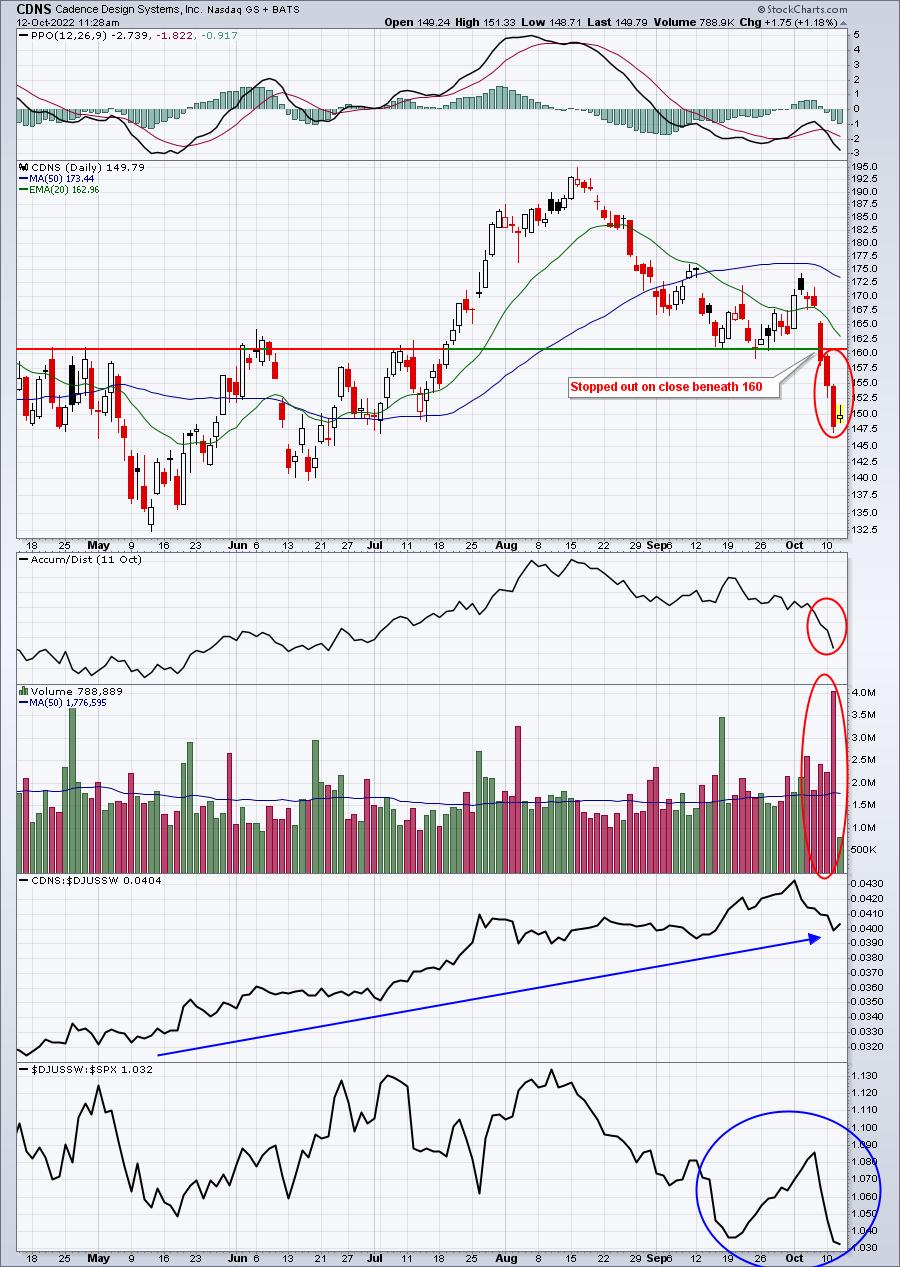
I don't necessarily think that CDNS has become a bad stock. Rather, look at the sudden selloff on both an absolute and relative basis in software stocks ($DJUSSW). The long-term relative uptrend - CDNS vs. software (CDNS:$DJUSSW) - remains intact. So I believe it's more of a case of a bad software group bringing down CDNS, instead of the alternative. But down is down and we need to make sure we keep stops in place as a result, even if we own a leading stock in the group.
Currently, we have no Model Trades at work. There are reasons, however, to be ready to pull the trigger. I discussed those earlier.
Earnings Reports
Here are the key earnings reports for the next two days, featuring stocks with market caps of more than $10 billion. I also include several companies with market caps below $10 billion. Finally, any portfolio stocks that will be reporting results are highlighted in BOLD. If you decide to hold a stock into earnings, please understand the significant short-term risk that you are taking. Please be sure to check for earnings dates for any companies you own or are considering owning.
Wednesday, October 12:
PEP, WIT
Thursday, October 13:
TSM, BLK, INFY, PGR, WBA, FAST, DAL, DPZ, CMC
Economic Reports
September PPI: +0.4% (actual) vs. 0.2% (estimate)
September Core PPI composite: +0.3% (actual) vs. +0.3% (estimate)
FOMC minutes released at 2:00pm ET
Happy trading!
Tom