
EB Daily Market Report - Friday, October 14, 2022
Executive Market Summary
- Futures were higher and we did gap up to extend Thursday's big rally
- However, it didn't last and the NASDAQ has underperformed on a relative basis - not good action
- Commodities are mostly lower, led by crude oil's ($WTIC, -3.92%) drop to $85 per barrel
- The 10-year treasury yield ($TNX) is up 5 basis points and is threatening to close above 4.00%
- All 11 sectors are down, led by consumer discretionary (XLY, -3.43%) and energy (XLE, -3.29%)
- Defensive groups are performing better on a relative basis, with health care (XLV, -0.46%) showing relative strength
- Retail sales were close to expectations, but consumer sentiment was below consensus estimates
- Most earnings reports were met with buyers today, including Wells Fargo (WFC, +2.78%) and JP Morgan (JPM, +2.49%)
- First Republic Bank of San Francisco (FRC, -16.29%) was definitely an outlier, though
Market Outlook
In this morning's EB Digest, I looked at the daily chart of the S&P 500, highlighting the positive divergence and reversing candle. Here's what it looks like currently on a weekly chart:
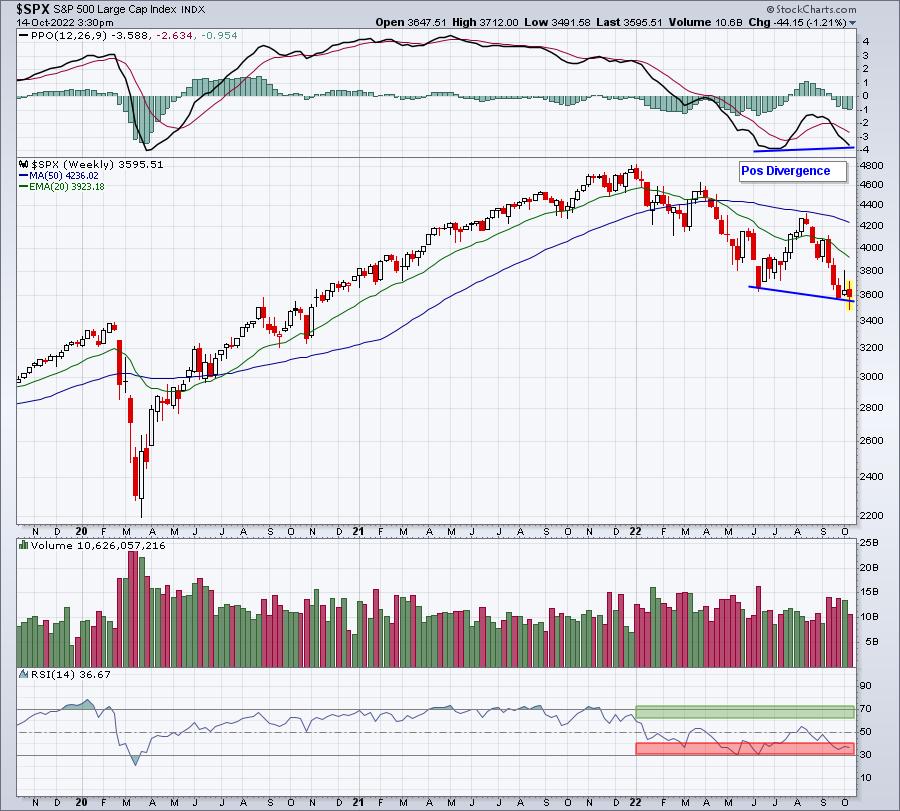
Couple things to keep in mind here. First, the positive divergence is in play currently, but we could see the PPO continue falling until it moves below the low established in early July. That would eliminate the positive divergence. THEY CAN BE ELIMINATED, so please keep this in mind. Second, check out the weekly RSI. Downtrends usually see RSI in the range from 30-60. Uptrends normally see RSI in the range from 40-70. Currently, we remain in that 30-60 range, so the RSI has not confirmed the resumption of the secular bull market.
Sector/Industry Focus
I am watching very closely to see how the market rotates during this current high volume, volatile period. It's not just the move higher, followed by the move lower. We need to really view the "underneath the surface" action objectively to determine whether this market has more downside. I don't believe it does, but conditions change and we have to honestly view these changes and be willing to reassess as we go. Here's the longer-term rotation and sustainability ratios as we look back throughout 2022:
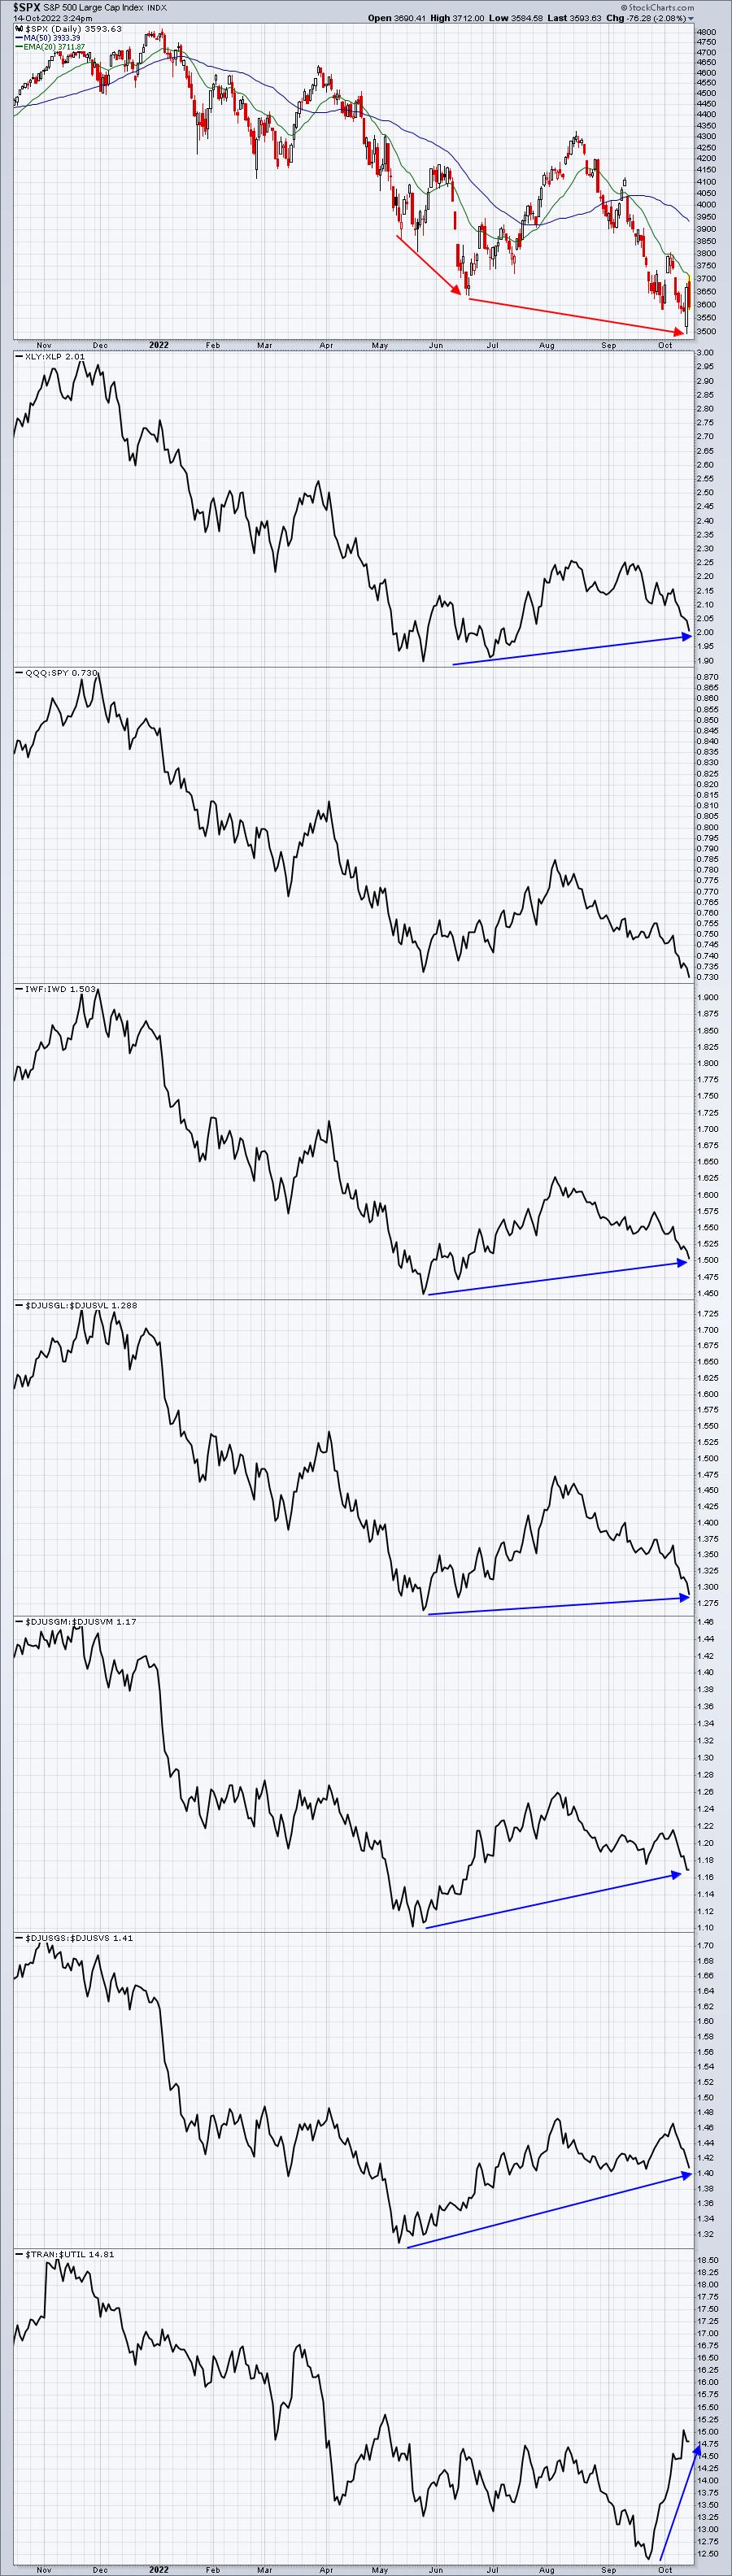
The QQQ:SPY ratio has broken down, but it's the only one. We also still show extremely bearish sentiment and positive divergences abound. It's really difficult for me to feel anything but bullish at this point, though I'm willing to continue watching signals for a possible change there.
ChartLists/Strategies
Because we saw a nice reversal yesterday, we were looking for additional follow-through today and sent out two Model Trades as a result. Here's a quick analysis of both trades:
PDD - our two entries triggered, at the opening bell at 56.20 and our second entry at 53.50. Our closing stop is 53.21 and PDD currently trades just beneath that level. We'll take the short-term loss if PDD doesn't rebound into the close.
ACLS - both entries triggered here too, first at 56.30 and second at 54.00. Our closing stop is 51.90 and we'll honor it. Currently, ACLS is trading at 52.23.
Earnings Reports
Here are the key earnings reports for the next two days, featuring stocks with market caps of more than $10 billion. I also include several companies with market caps below $10 billion. Finally, any portfolio stocks that will be reporting results are highlighted in BOLD. If you decide to hold a stock into earnings, please understand the significant short-term risk that you are taking. Please be sure to check for earnings dates for any companies you own or are considering owning.
Friday, October 14:
UNH, JPM, WFC, MS, C, PNC, USB, FRC
Monday, October 17:
BAC, SCHW, BK, ELS
Economic Reports
September retail sales: +0.0% (actual) vs. 0.2% (estimate)
September retail sales less autos: +0.1% (actual) vs. -0.1% (estimate)
August business inventories: +0.8% (actual) vs. +0.9% (estimate)
October consumer sentiment: 59.8 (actual) vs. 58.8 (estimate)
Happy trading!
Tom