
EB Daily Market Report - Monday, October 17, 2022
Executive Market Summary
- Futures were solidly higher overnight and we saw nice gap ups in our major indices to open the day and week
- Commodities are mixed with crude oil ($WTIC, +0.55%) and gold ($GOLD, +0.78%) higher, while natural gas ($NATGAS, -6.87%) and copper ($COPPER, -0.34%) are lower
- The 10-year treasury yield ($TNX) fell 9 basis points earlier, helping to spur equities higher, but the TNX has since recovered that earlier drop, while equities hang onto their early gains
- Bank earnings have been relatively strong as Bank of America (BAC, +6.34%) is the latest to jump on better-than-expected results
- All 11 sectors are higher today, led by consumer discretionary (XLY, +4.19%); meanwhile, the defensive consumer staples sector (XLP, +1.45%) is up, but the worst-performing sector today - a reversal from Friday
- Real estate (XLRE, +4.09%) has come to life after a brutal 2-month selloff that saw the sector lose nearly 30%
- Netflix (NFLX, +7.90%) is having a solid day, just a day before its quarterly earnings report; it traded as high as 248.29, but hasn't closed above 250 since April 19th, the day before its Q1 earnings were released
Market Outlook
While at ChartCon, I was listening to Linda Raschke's keynote address. I found it interesting that she LOVES the 10-day moving average of the equity-only put-call ratio ($CPCE) - which I've used in the past - and it's her favorite sentiment indicator. Of course, those of you that have followed me for a long time know that my favorite sentiment indicator is now the 5-day moving average of the CPCE. Linda began her professional career in 1981, now has four decades of experience, and is a world-renowned trader. I thought I'd provide two long-term S&P 500 charts, one with the 5-day SMA of the CPCE and the other with the 10-day SMA of the CPCE. Check out the signals of each:
S&P 500 vs. 5-day SMA of CPCE:
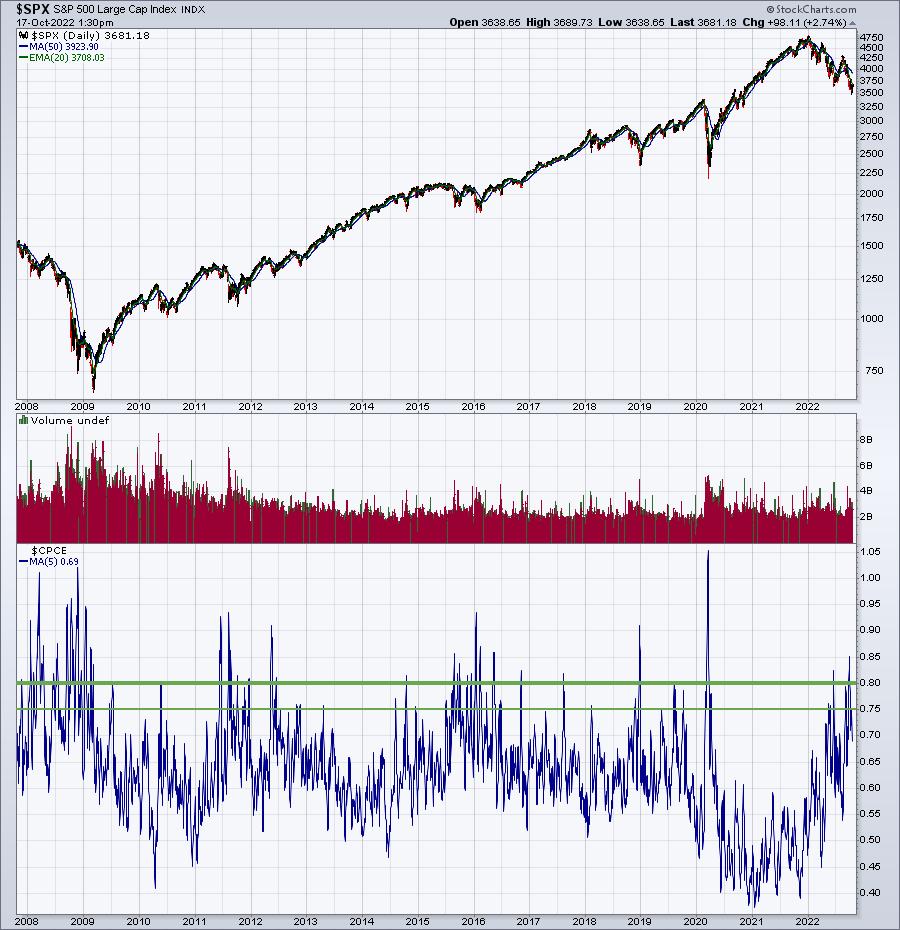
I like to see the 5-day moving average of the CPCE move up to at least .75 and, preferably, .80 to mark a significant bottom. Occasionally, we'll see this 5-day moving average move much higher, but ANY reading above .75 let's us know that the market is growing extremely pessimistic and bearish, usually an excellent sign that a bottom is forming or about to form.
S&P 500 vs. 10-day SMA of CPCE:
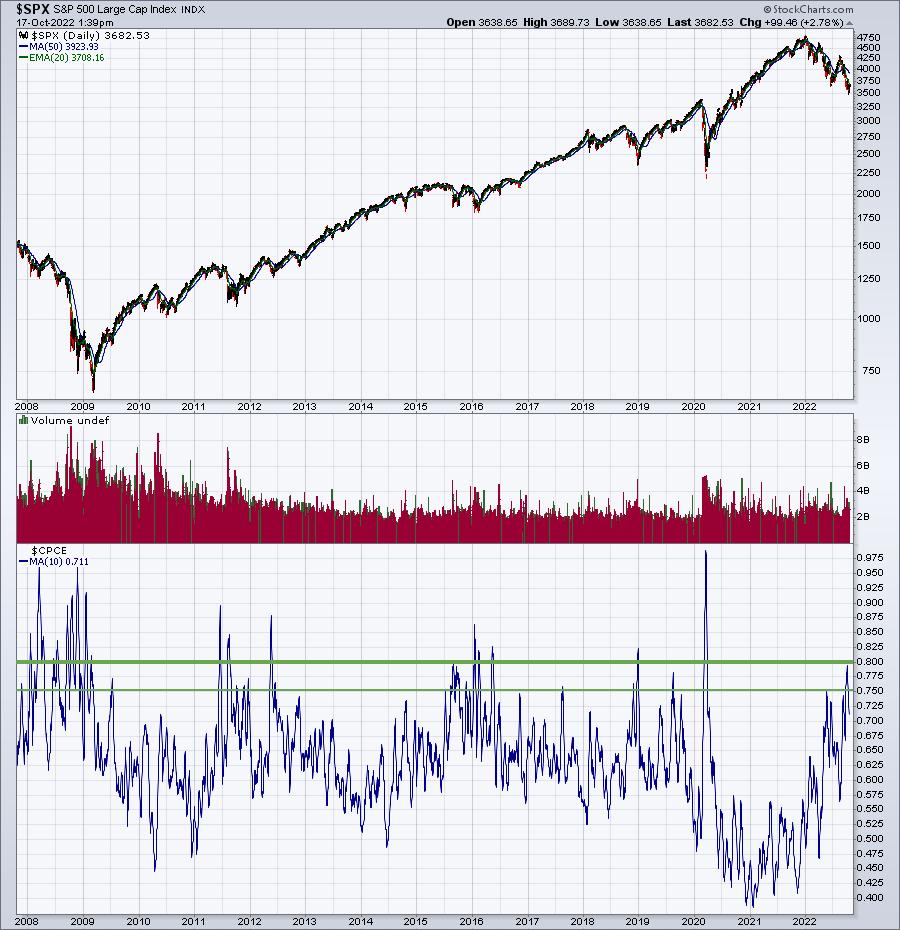
The biggest difference is that the 10-day SMA doesn't generate as many signals. However, the ones they do produce are very solid. I'd be in favor of following either of these sentiment approaches.
Sector/Industry Focus
This might come as a surprise, but the travel & tourism industry ($DJUSTT) is the best-performing industry group within the consumer discretionary sector over the past 3 months. Not only that, but it's also printing a positive divergence currently on its daily chart, a signal that's triggered two fairly significant earlier rallies in 2022:
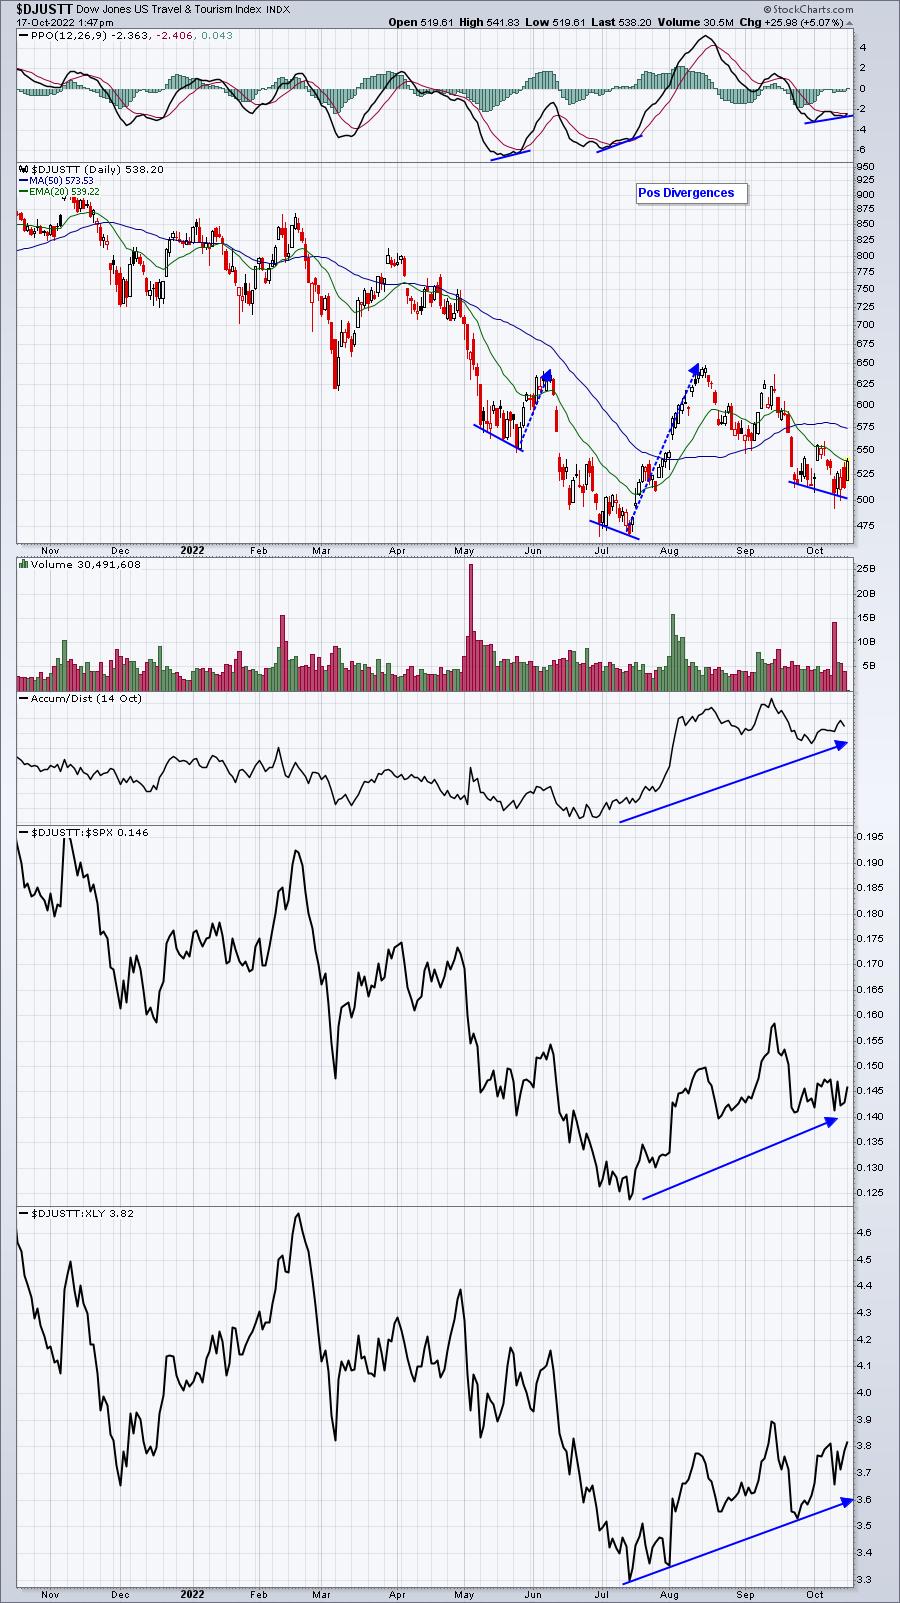
I love that the AD line recently set a new 2022 high as well. This is another chart that makes me shake my head at the current news stories. Everyone continues to talk about how bad the upcoming (or current) recession will be, yet travel & tourism stocks are a leading relative performer over the past few months. Why would Wall Street firms be interested in an area that, from a common sense perspective, would not do well in an upcoming recession?
Think about it.
ChartLists/Strategies
I searched our Strong Earnings ChartList (SECL), Strong Future Earnings ChartList (SFECL), Strong AD ChartList (SADCL), and Raised Guidance ChartList (RGCL), scanning for any stocks setting 52-week highs (which would be bullish in this bear market). Here were the 17 results, sorted by sectors first, then by SCTR score:
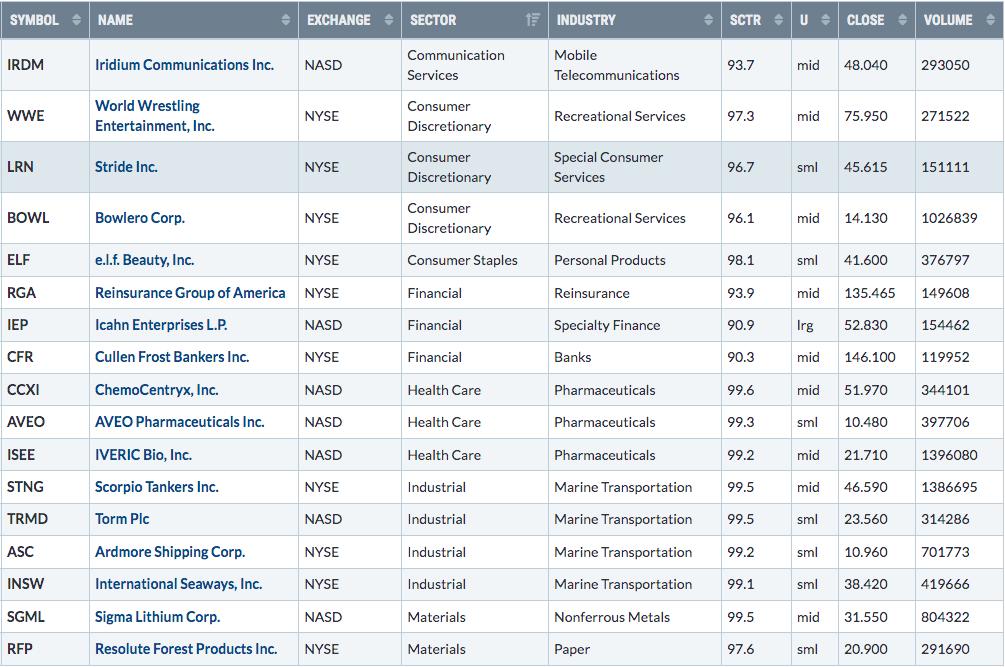
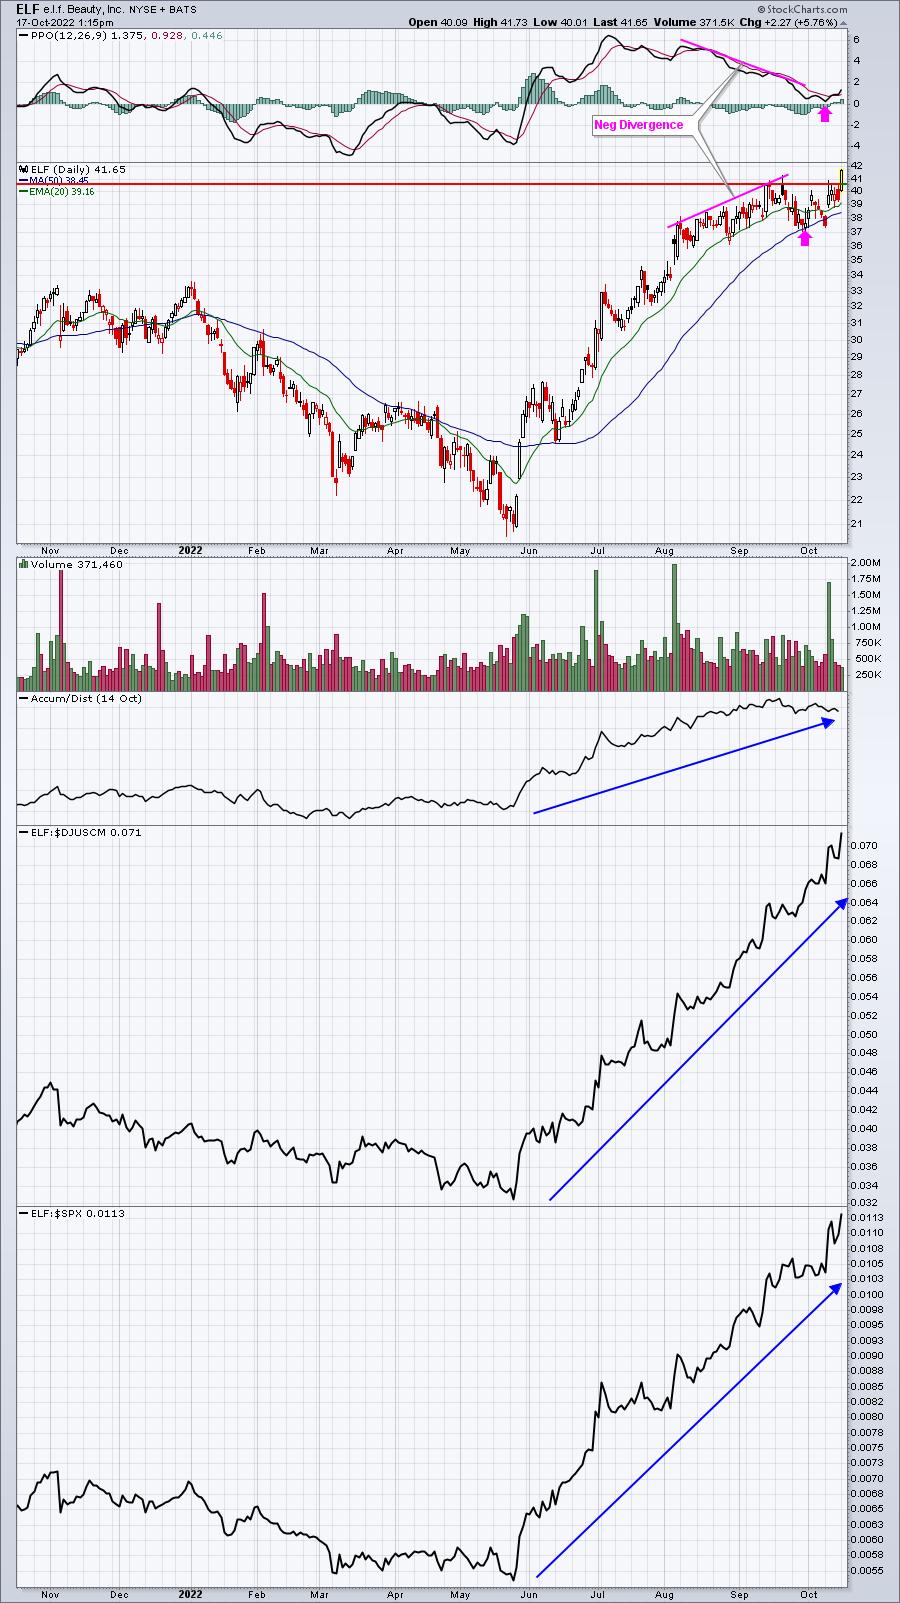
Two that look attractive to me are ELF and SGML. Check out the price and volume combination, AD lines, and relative strength on these two:
ELF:
SGML:
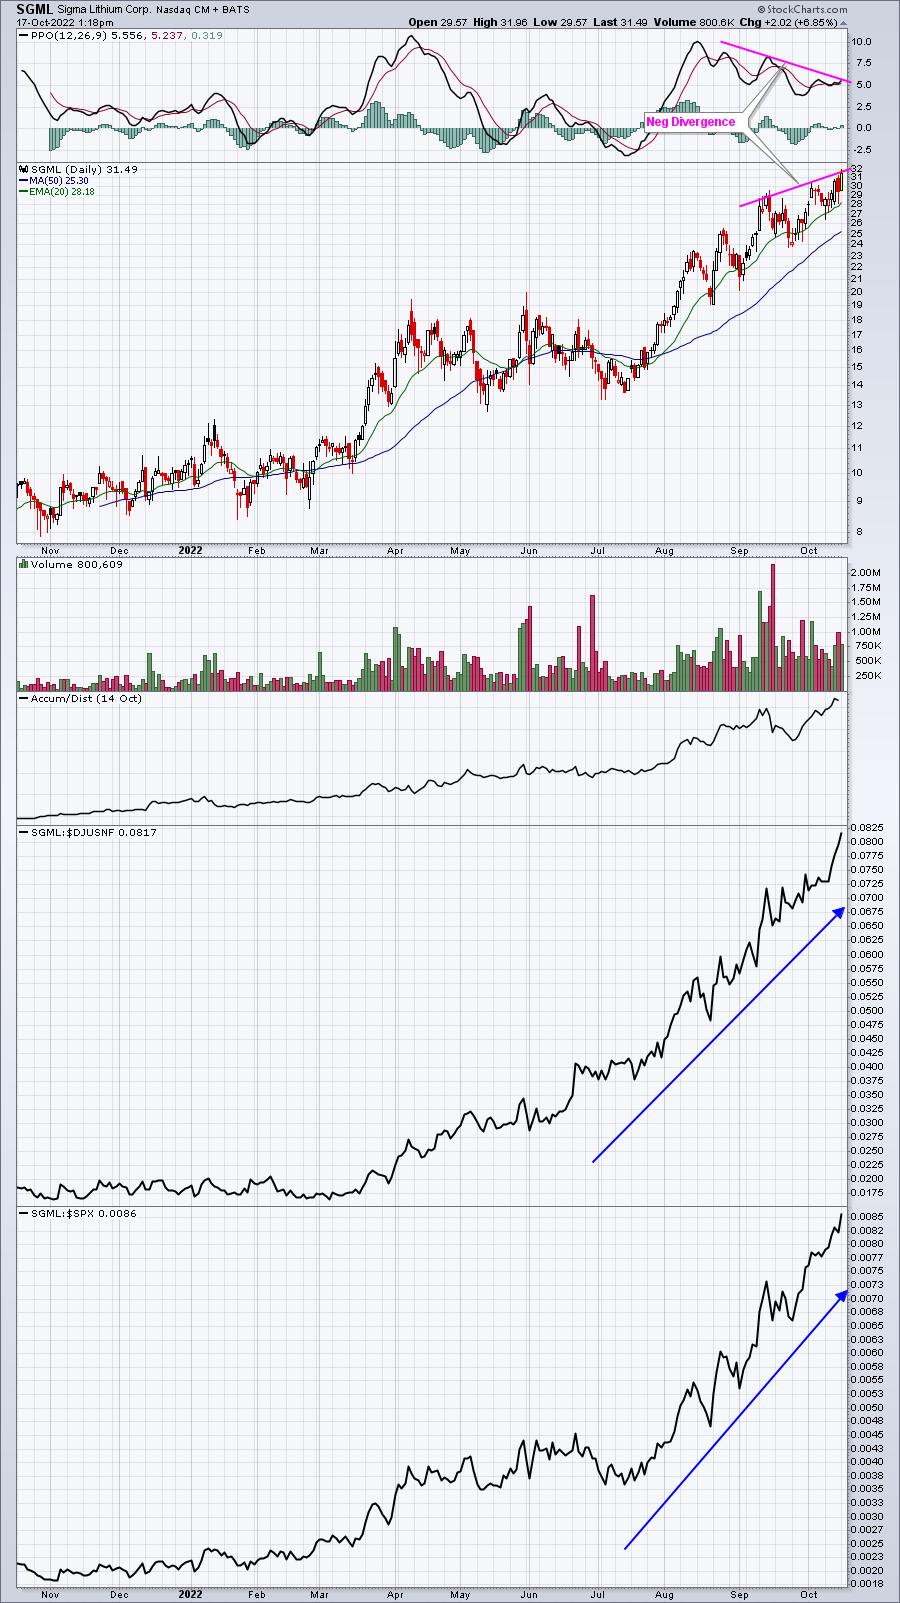
I really like both charts. There is one major difference in these two charts, however. ELF already printed a negative divergence and saw subsequent selling to "reset" its PPO near centerline support and to test its 50-day SMA, the two things I look for to lower the risk of entry. SGML continues to print a negative divergence, so it may take a bit of time to unwind this before the reward to risk improves enough to take a position.
Model Trades - Update
I'm still trying to catch up from last week's travels to Seattle for ChartCon 2022. Again, I apologize for our jumbled schedule, but I believe it was completely worthwhile from both a business and personal perspective. I really enjoyed meeting with many well-respected market technicians, colleagues, and friends. The timing could not have been better as well, given all the market volatility in 2022 and so many differing opinions as to where the stock market is headed.
I finished the EB Weekly Portfolio Report late last night and sent it out, but I was unable to gather all of the Model Trade information from the past two weeks and I indicated I'd share that with you today. So here goes:
Last Two Weeks Model Trade Results:
ENPH (from Aggressive Portfolio, SECL, SADCL, RGCL, EADCL, and BTCL):
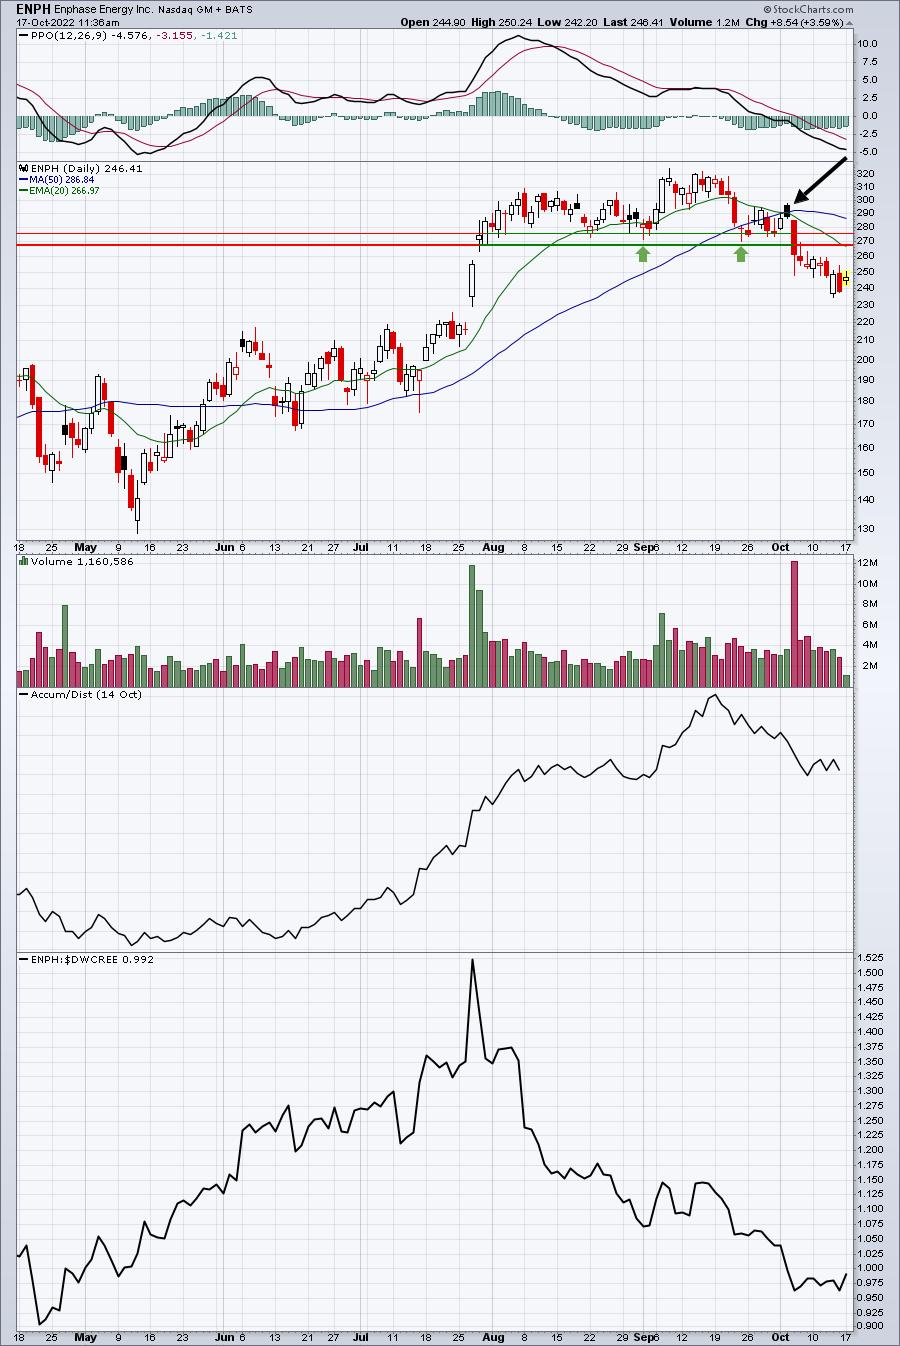
My argument three weeks ago: "ENPH is an extremely aggressive trade. It fell 40 dollars in just two days last week, so please understand the risk you're taking if you decide to trade this one. After the big push higher in late July, ENPH pulled back on a few different occasions in late August and early September, printing its lowest candle body at 276.05 on August 22nd. I'd like to give ENPH a bit more room, because it is volatile, so we'll enter ENPH on the Monday open and again at 277.00, with a closing stop of 268.00. Our target will be the 20-day EMA, currently 298.39." I later adjusted the target to 297.00.
Result: Our two entries were 277.86 and 277.00 on Monday, September 26th, with our average entry being 277.43. The next two days, ENPH saw intraday highs of 294.80 and 294.38, just shy of the declining 20-day EMA. After falling back to 273.40 on September 30th, ENPH soared the next two days, reaching an intraday high of 297.71 on October 4th. We took profits of $19.57, or 7.05% that day after thinking about raising our target. We were fortunate that we didn't, however, as ENPH fell significantly on October 5th and the selling momentum hasn't stopped, reaching a low of 234.58 on Thursday, October 13th.
Grade: A-
CDNS (from SECL, SADCL, RGCL, BTCL, and Model Portfolio)
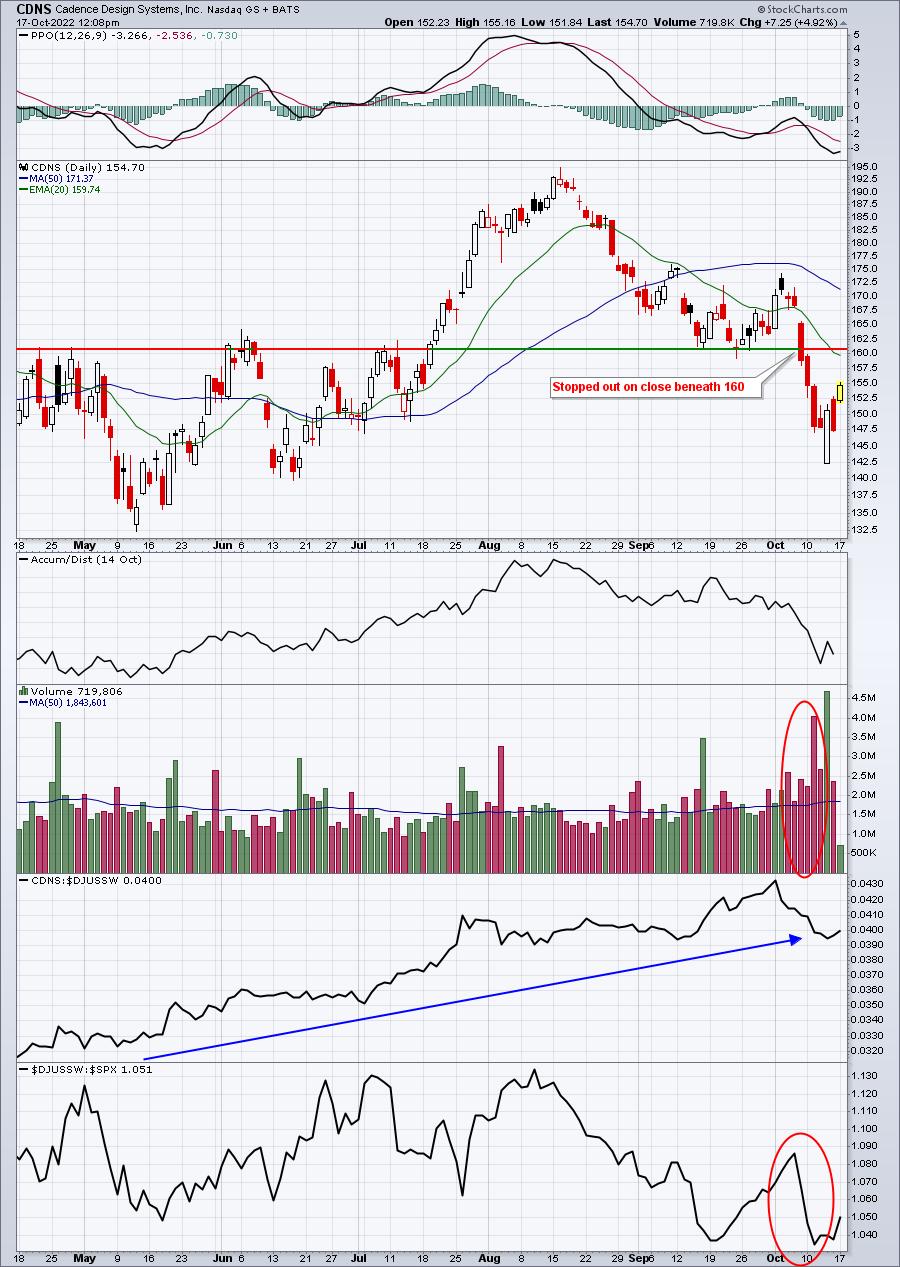
My argument from the October 4th DMR: "I loved yesterday's move above price resistance and the 20-day EMA on solid volume. Today, CDNS gapped higher, but it's since pulled back, providing opportunity for entry. I like it at the current price of 171.64, with a second entry on a 20-day EMA test, currently at 167.97. We'll use a closing stop beneath 160 and our target will be the mid-August high close of 193.09. In addition to improving technical conditions on CDNS, it's performed extremely well during October and November over the past 10 years, so seasonal tailwinds should help as well."
Result: Our two entries were 171.64 and 167.94, resulting in an average entry price of 169.79. CDNS got caught up in the heavy volume selling of software stocks in the second week of October. We were stopped out on the 158.90 close on the Friday, October 7th close. Unfortunately, we took a $10.89 loss, or 6.41%, in just 3 trading days. The only thing keeping this trade from being an F is that the S&P 500 dropped 4-5% during these 3 days, making every long trade extremely challenging.
Grade: D
PDD (from SECL):
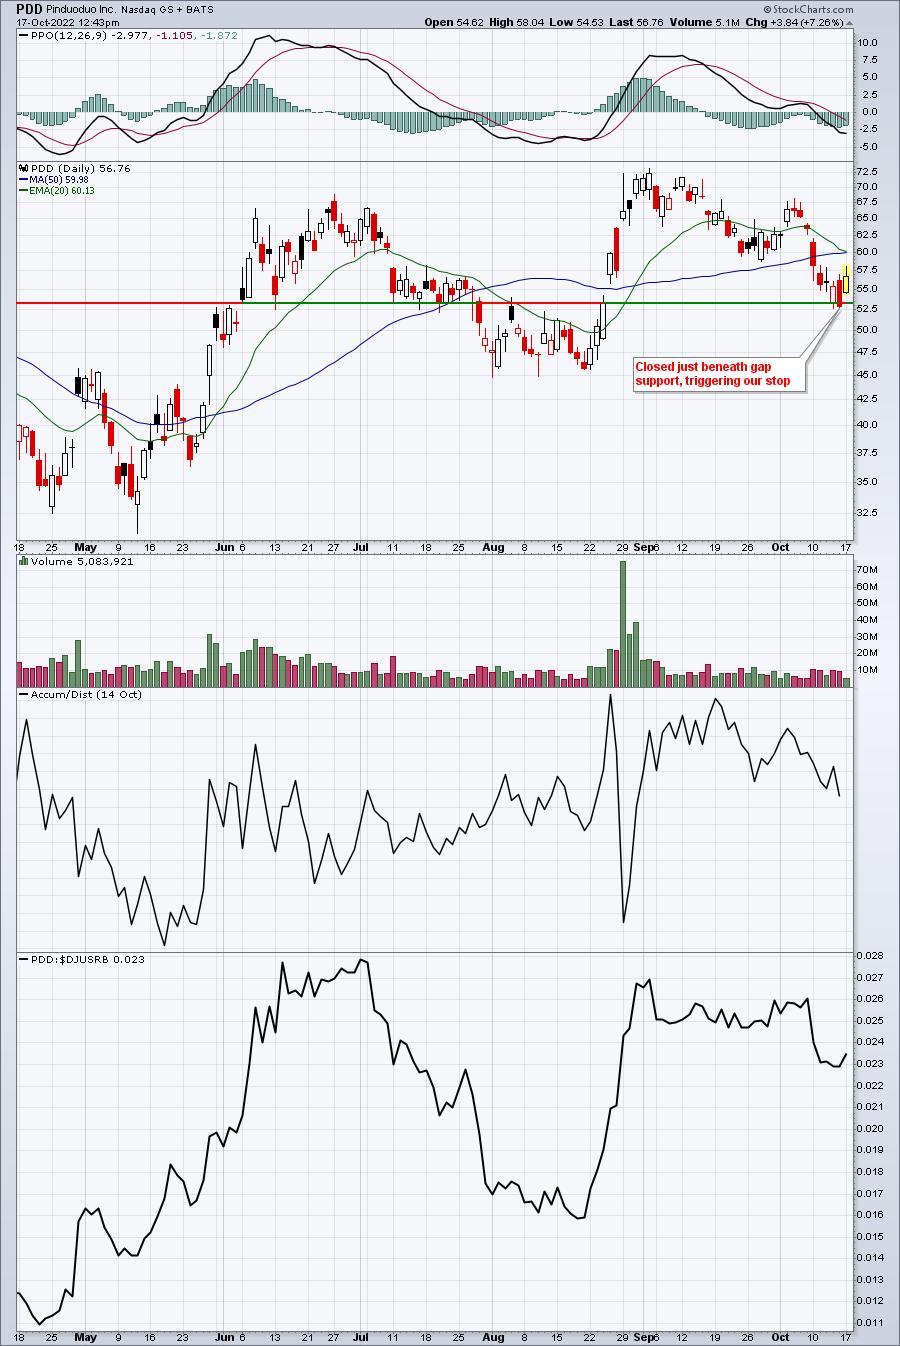
My argument from Friday, October 14th: "I like this one after it printed a reversing hollow candle yesterday in a key gap support zone. I like entry at the open today and again at 53.50 with a closing stop beneath 53.21. I'm looking for a return back to 66.50, my target."
Result: Our two entries were 56.20 and 53.50, resulting in an average entry price of 54.85. Our closing stop was 53.21, which triggered on Friday's close of 52.92. Our loss was $1.93, or 3.52%. The S&P 500's reversal and selling all day on Friday certainly didn't help, but the worst part is seeing PDD up more than 7% today.
Grade: D
ACLS (from SECL and RGCL):
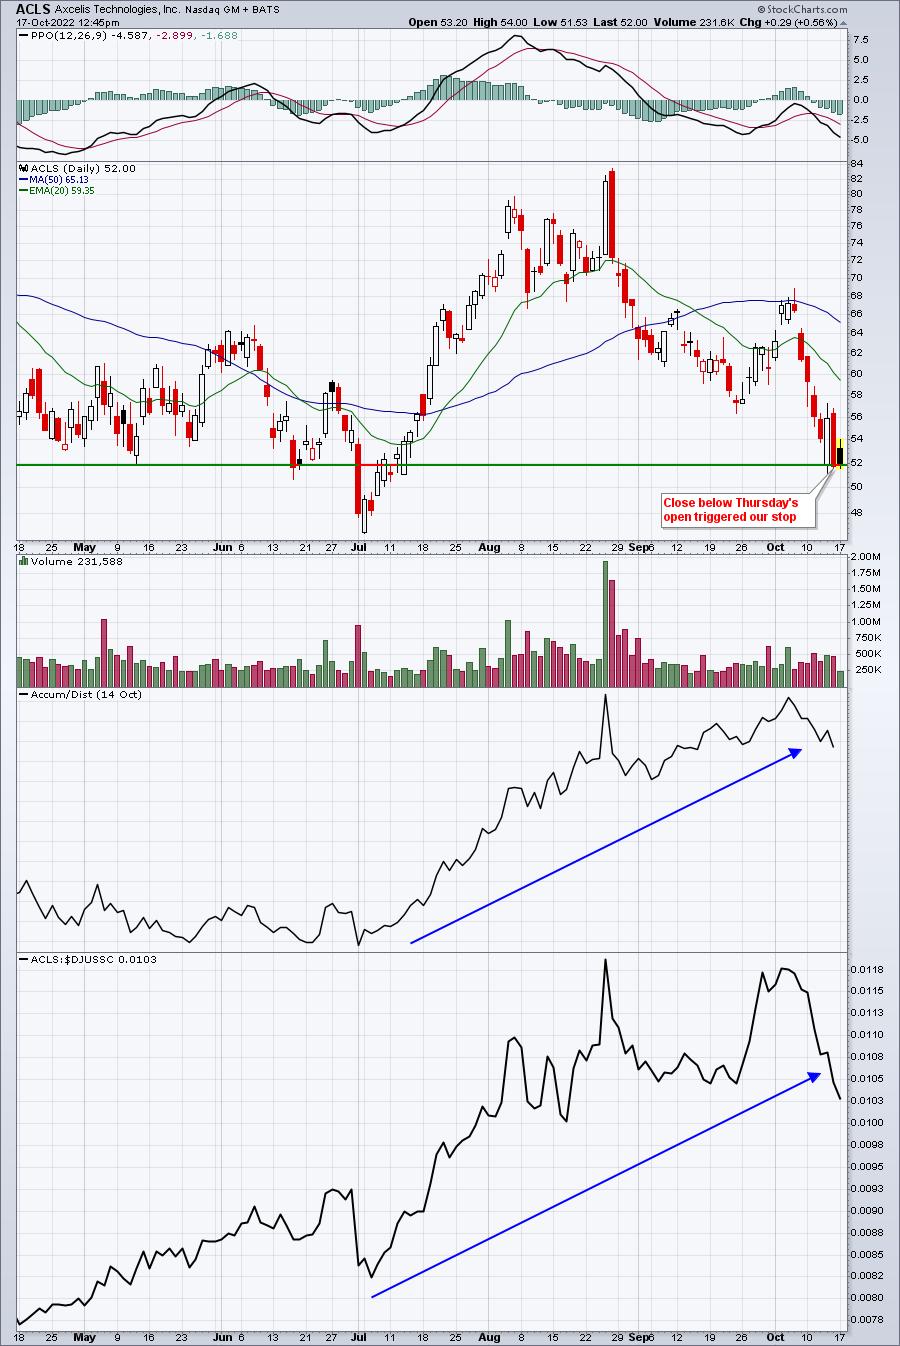
My argument from Friday, October 14th: "I didn't see any industry group that made a better and stronger reversal yesterday than semiconductors ($DJUSSC). The group is so oversold and recently took the double gut punch of AMD and AMAT warnings. Even an oversold bounce from here could be powerful. ACLS has been a leader in the group. I like it at today's open and again at 54.00 on a pullback. Consider a closing stop beneath at 51.90 and a target of 67.00."
Result: Our two entries were 56.30 and 54.00, resulting in an average entry price of 55.15. Our closing stop was 51.90, which triggered on Friday's close of 51.71. Our loss was $3.44, or 6.24%. Losing over 6% on one trade in less than a day is NEVER good, even with the overall market selling off hard. This is our first F on a Model Trade, in my opinion.
Grade: F
Earnings Reports
Here are the key earnings reports for the next two days, featuring stocks with market caps of more than $10 billion. I also include several companies with market caps below $10 billion. Finally, any portfolio stocks that will be reporting results are highlighted in BOLD. If you decide to hold a stock into earnings, please understand the significant short-term risk that you are taking. Please be sure to check for earnings dates for any companies you own or are considering owning.
Monday, October 17:
BAC, SCHW, BK, ELS
Tuesday, October 18:
JNJ, LMT, NFLX, ISRG, TFC, IBKR, STT, JBHT, ACI, OMC, FHN, UAL, SBNY, HAS, CBSH, PNFP, WTFC, FNB, HWC, FULT, SI
Economic Reports
October empire state manufacturing index: -9.1 (actual) vs. -2.5 (estimate)
Happy trading!
Tom