
EB Daily Market Report - October 18, 2022
Max Pain Event
It's that time again! Opposite George week is here. Since sending out our Max Pain spreadsheet this weekend, we've already seen tremendous strength (manipulation?) this week in our major indices and most of the individual stocks that we provided with heavy net in-the-money put premium. At 4:30pm ET, we'll have our latest Max Pain event, this time for October 2022. In addition to discussing our major indices and the weekend spreadsheet, I'll also provide a couple other trading candidates, including NIO, which is featured below as a new Model Trade.
Executive Market Summary
- Futures were significantly higher overnight as the options-related rally continues into a second day
- Unfortunately, the opening strength didn't last; I'm watching the rising 20-day EMAs on our major indices - can we close above them?
- A stronger-than-expected industrial production report for September has spurred yields higher; the 10-year treasury yield ($TNX) is up 2 basis points to 4.03%, threatening to close at yet another 14-year high
- Cryptocurrencies remain weak as bitcoin ($BTCUSD) continues to trade just beneath 20000
- Commodities are weak across-the-board as crude oil ($WTIC, -3.49%) has fallen back to $82.50 per barrel
- Weak sectors are leading this week's rally and strong sectors are trailing - typical options expiration week behavior
- There are mixed reactions to earnings - Lockheed Martin (LMT, +7.55%) is showing plenty of strength after beating its EPS estimate; meanwhile, Silvergate Capital (SI, -19.97%) fell short of its EPS estimate
Market Outlook
We're going to get a few answers on the NASDAQ today. Max pain on the QQQ (ETF that tracks the NASDAQ 100) shows max pain much higher - my calculation this morning is 284.07. That would suggest higher prices ahead this week. Also, the QQQ is in a short-term uptrend with a positive hourly PPO and a test of its rising 20-hour EMA earlier. We've just bounced off that moving average, which is bullish, but does this strength continue?
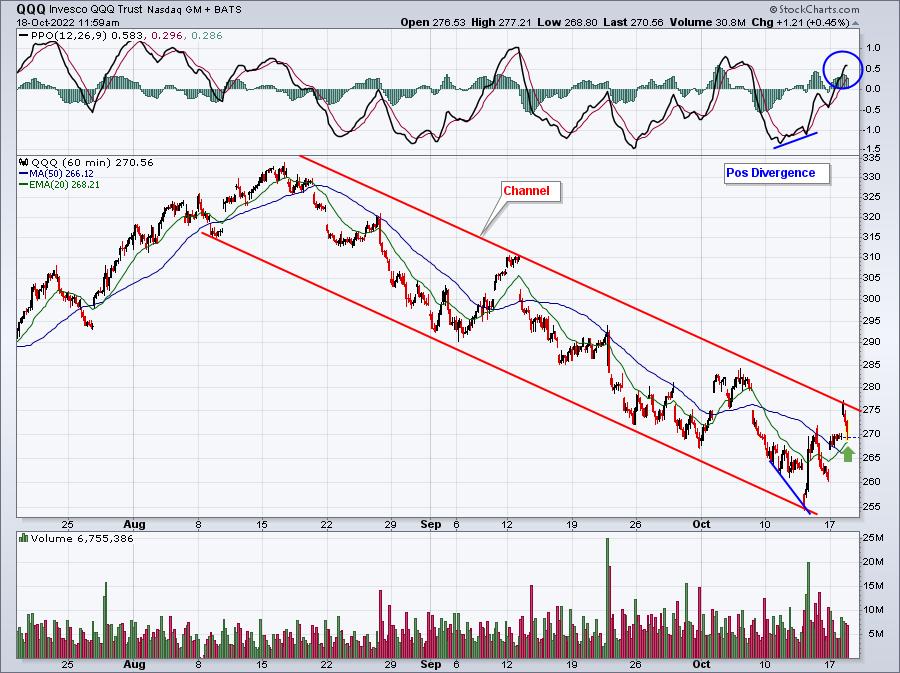
The hourly positive divergence and max pain both would argue for higher prices, but in order to move higher, the QQQ is going to have to clear channel resistance at today's earlier high. A close above 277 would certainly favor the bulls near-term and afternoon buying would be welcome as well. In my opinion, we haven't see a truly bullish afternoon session since September 28th.
Sector/Industry Focus
Well, it's "Opposite George" week (options expiration week), so we should expect the opposite of what has been occurring to occur this week. This morning, on my Trading Places LIVE show, I pointed out that the 3 sectors with the highest SCTR scores (best relative strength) were the three worst performers on Monday. Here's the sector performance today:
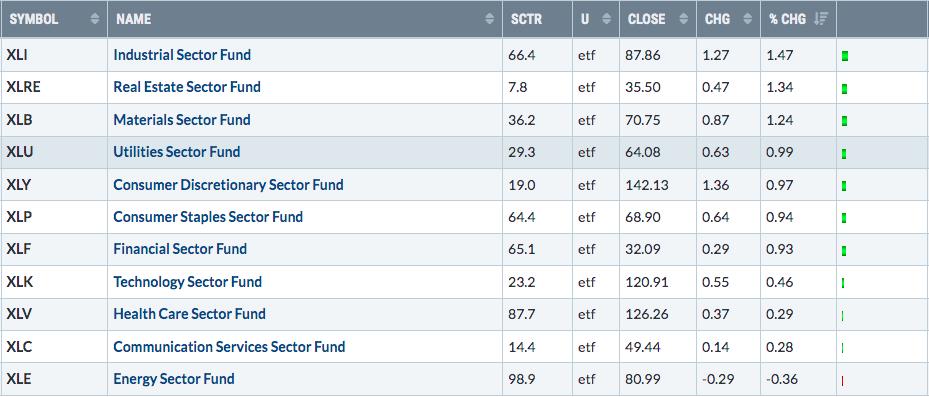
Again, we're seeing the two best sectors near the bottom of the heap today. Meanwhile, real estate (XLRE), the absolute worst sector is in the #2 spot today after leading the market higher yesterday. I don't make this stuff up.
The recently-hot energy sector (XLE) couldn't clear overhead resistance just above 84 and it's been unable to participate in the rally this week:
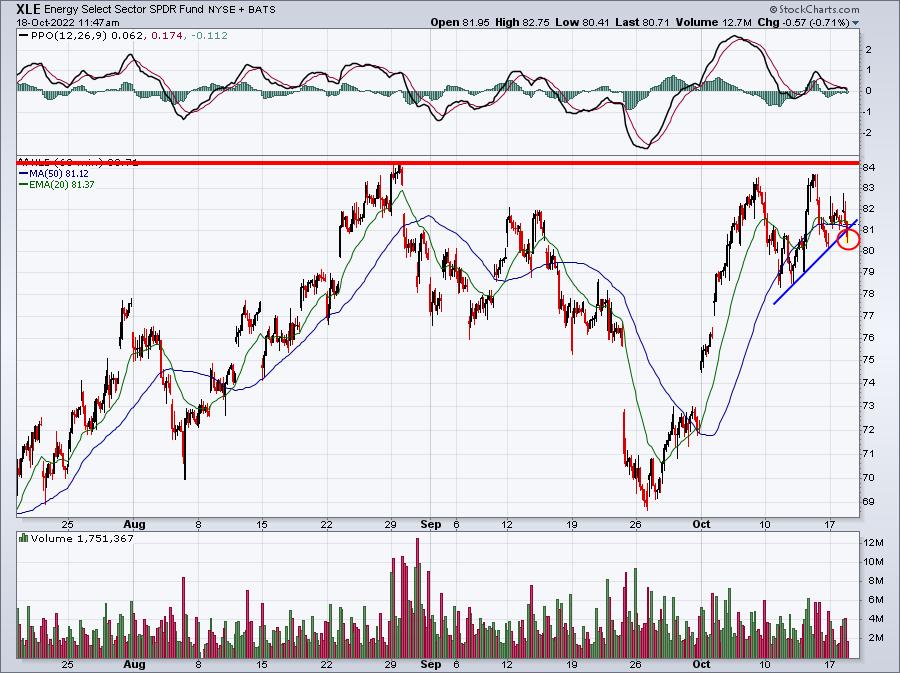
The red circle is highlighting a potential short-term trendline breakdown. I would expect recent lows near 78.50 to hold as support. If not, energy could find itself much lower in the coming days, perhaps down to the 73-75 range.
ChartLists/Strategies
This week is different than most as monthly options expire and short-term manipulation can take over. Stocks that have been working suddenly don't work as well, while stocks that can't seem to catch a bid begin to show leadership. Many times, it's simply a mirage, however, and after options expire, stocks once again start to show their true colors. I'm going to provide one stock that has been crushed of late, but now shows close to $20 million in net in-the-money put premium.
NIO:
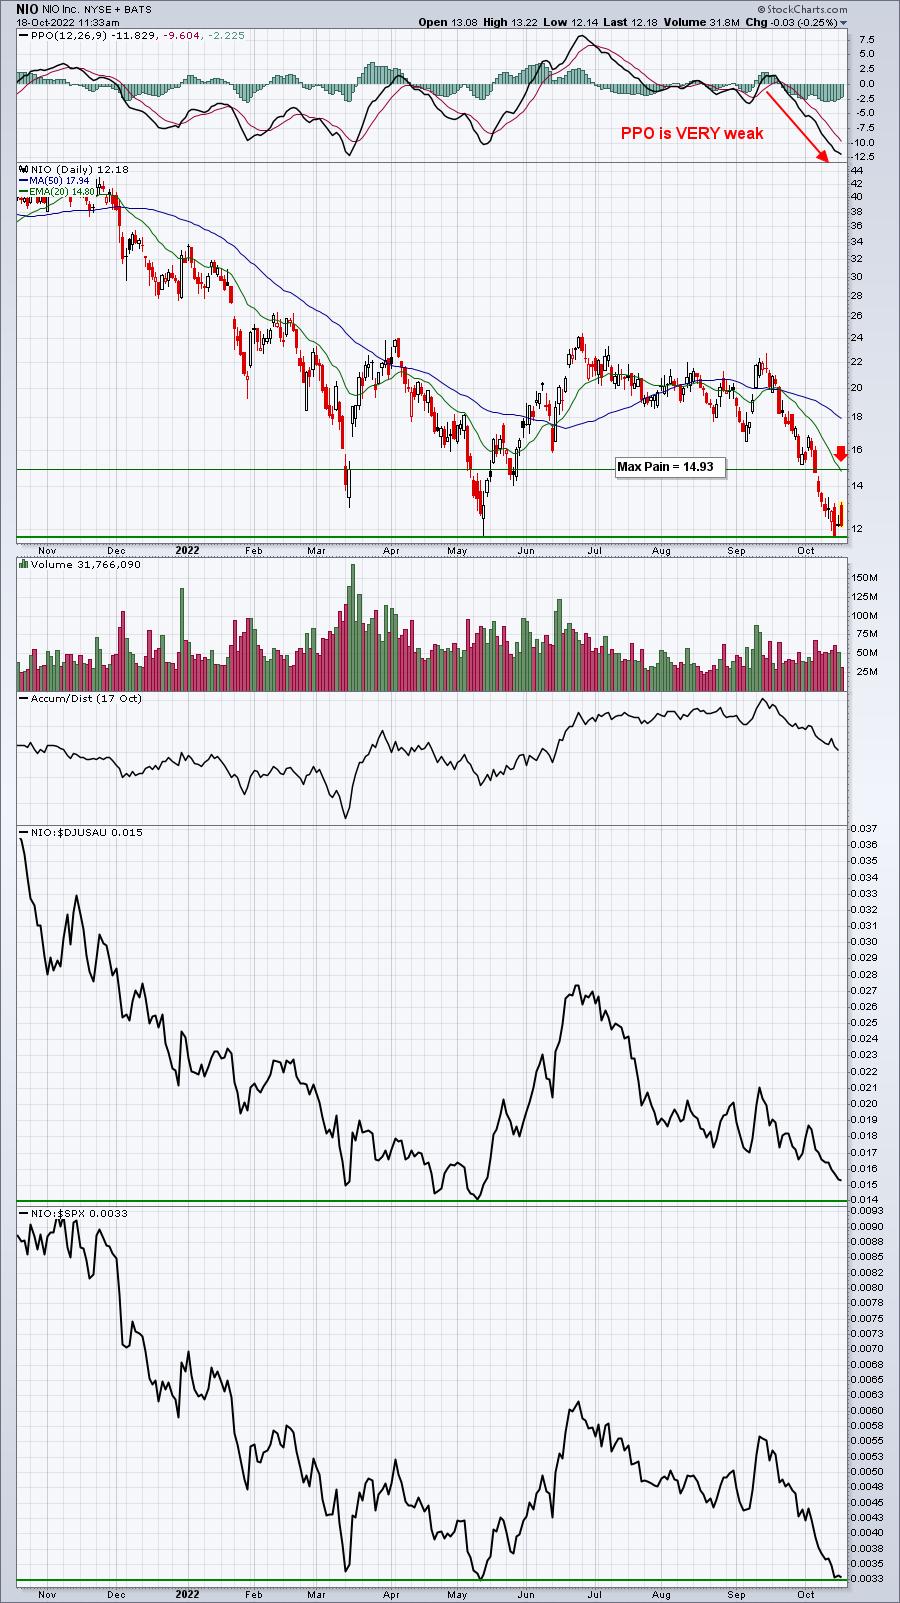
I am going to add NIO as a Model Trade at its current price of 12.18. This is a VERY aggressive, max-pain-related trade. The PPO here is very weak, but the stock is oversold as it reaches key absolute price support. I've calculated max pain to be 14.93, so I believe there is financial incentive for market makers to buy the stock this week. The intraday low was 11.67 in May and the closing low was 11.75 on October 14th (last Friday). Therefore, our stop will be either an intraday low beneath 11.60 or a close beneath 11.75. Our target, meanwhile will be the declining 20-day EMA, currently at 14.80, which is just beneath max pain.
Earnings Reports
Here are the key earnings reports for the next two days, featuring stocks with market caps of more than $10 billion. I also include several companies with market caps below $10 billion. Finally, any portfolio stocks that will be reporting results are highlighted in BOLD. If you decide to hold a stock into earnings, please understand the significant short-term risk that you are taking. Please be sure to check for earnings dates for any companies you own or are considering owning.
Tuesday, October 18:
JNJ, LMT, NFLX, ISRG, TFC, IBKR, STT, JBHT, ACI, OMC, FHN, UAL, SBNY, HAS, CBSH, PNFP, WTFC, FNB, HWC, FULT, SI
Wednesday, October 19:
TSLA, PG, ABT, ASML, ELV, IBM, PLD, CCI, LRCX, TRV, KMI, MTB, LVS, NDAQ, PPG, BKR, EFX, CFG, NTRS, STLD, CMA, ALLY, REXR, MKTX, KNX, AA, SEIC, FR, LAD, LSTR, RLI, UMPQ, CVBF, TCBI, UNF, PACW, CNS, BMI, LBRT, SLG, WDFC, WGO, KALU, HCSG
Economic Reports
September industrial production: +0.4% (actual) vs. +0.1% (estimate)
September capacity utilization: 80.3% (actual) vs. 80.0% (estimate)
Happy trading!
Tom