
EB Daily Market Report - Tuesday, October 24, 2022
BIG Announcement - Mark Your Calendar
I've been discussing market manipulation throughout 2022 and now we've created an event about it. Mark your calendar for Saturday, November 5th. I'll spend much of that morning discussing "amateur hour", the disparity in gaps vs. trading throughout the rest of the day, monthly options expiration, money flows, and other manipulation-related topics. It'll be an eye-opening morning, devoted to uncovering the schemes of market makers.
This is VERY important. EB.com members do NOT need to register. You are automatically registered and we'll send you room instructions the morning of the event. Just mark your calendar. If you'd like to see a bit more information about the event, CLICK HERE. If you do register, you'll simply be subject to promotional emails.
Executive Market Summary
- Futures were mixed overnight, but the NASDAQ showed relative strength this morning and opened higher
- The 10-year treasury yield ($TNX) moved lower for a 2nd consecutive session, dropping 13 basis points today to 4.11%
- Cryptocurrencies are strong today as etherium ($ETHUSD, +11.75%) and bitcoin ($BTCUSD, +5.24%) jump
- Commodities are mixed, though it's worth noting that natural gas ($NATGAS, +8.21%) is trading back above its 5.40-5.50 range - where we saw a significant breakdown occur on Friday
- The S&P 500 has climbed back above 3850; 3900 remains a critical resistance level
- The Volatility Index ($VIX, -4.46%) has dropped back to 28.50
- Only energy (XLE, -0.26%) is down as real estate (XLRE, +3.54%) leads the other 10 sectors higher
- Earnings will continue to accelerate; on deck this afternoon are Microsoft (MSFT) and Alphabet (GOOGL)
Market Outlook
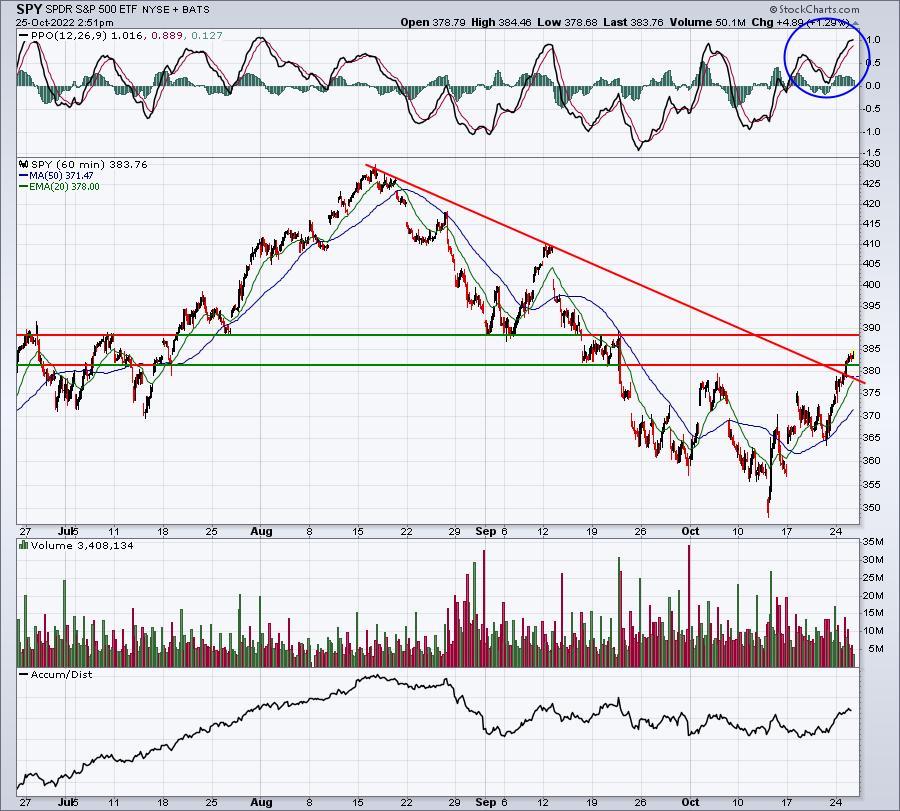
The battle is on. Both the SPY and QQQ, ETFs that track the S&P 500 and NASDAQ 100, respectively, are at or rapidly approaching key price resistance and 50-day SMAs. If the bears cannot slow down the upward momentum at these key resistance levels, then we could see a lot more money coming in from the sidelines. Check out these two charts:
SPY:
QQQ:
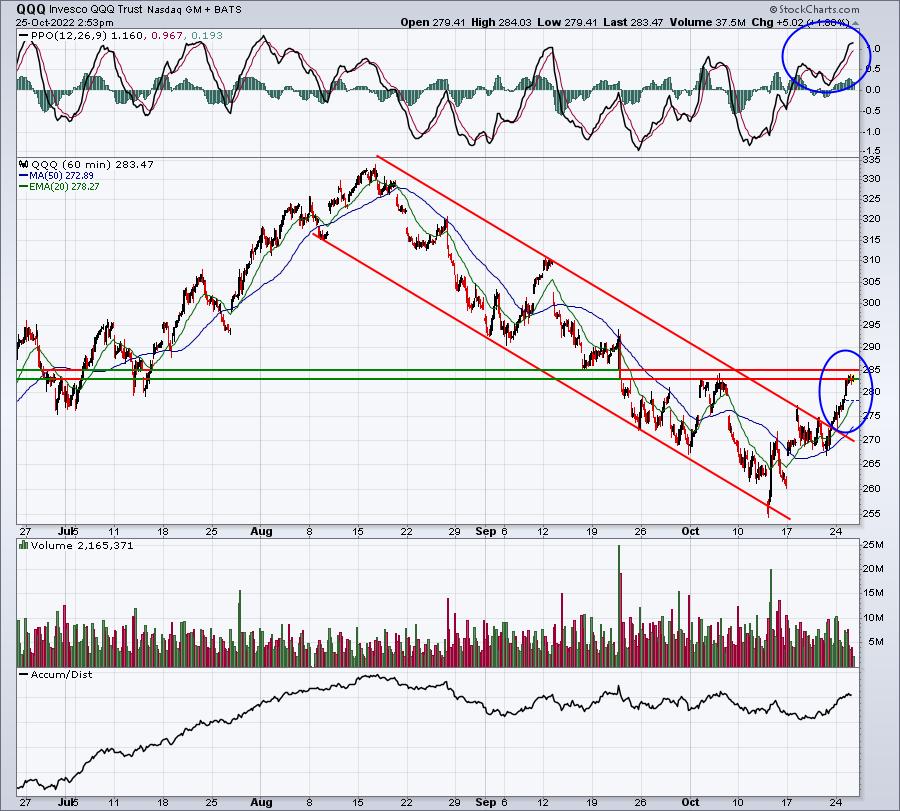
The hourly PPO looks as strong as it has since the Jackson Hole debacle on August 26th. We've seen bullish breakouts above recent downtrend lines on both ETFs as well. The key overhead price resistance will be key as will clearing 50-day SMAs. Currently, that moving average (not pictured on hourly chart above) on the SPY and QQQ is 385.27 and 289.28, respectively.
Sector/Industry Focus
Apparel retail stocks ($DJUSRA) have suddenly become very hot and are SURGING on a relative basis. Here's the year-to-date chart of the DJUSRA, but with the relative strength reflected in the bottom panel:
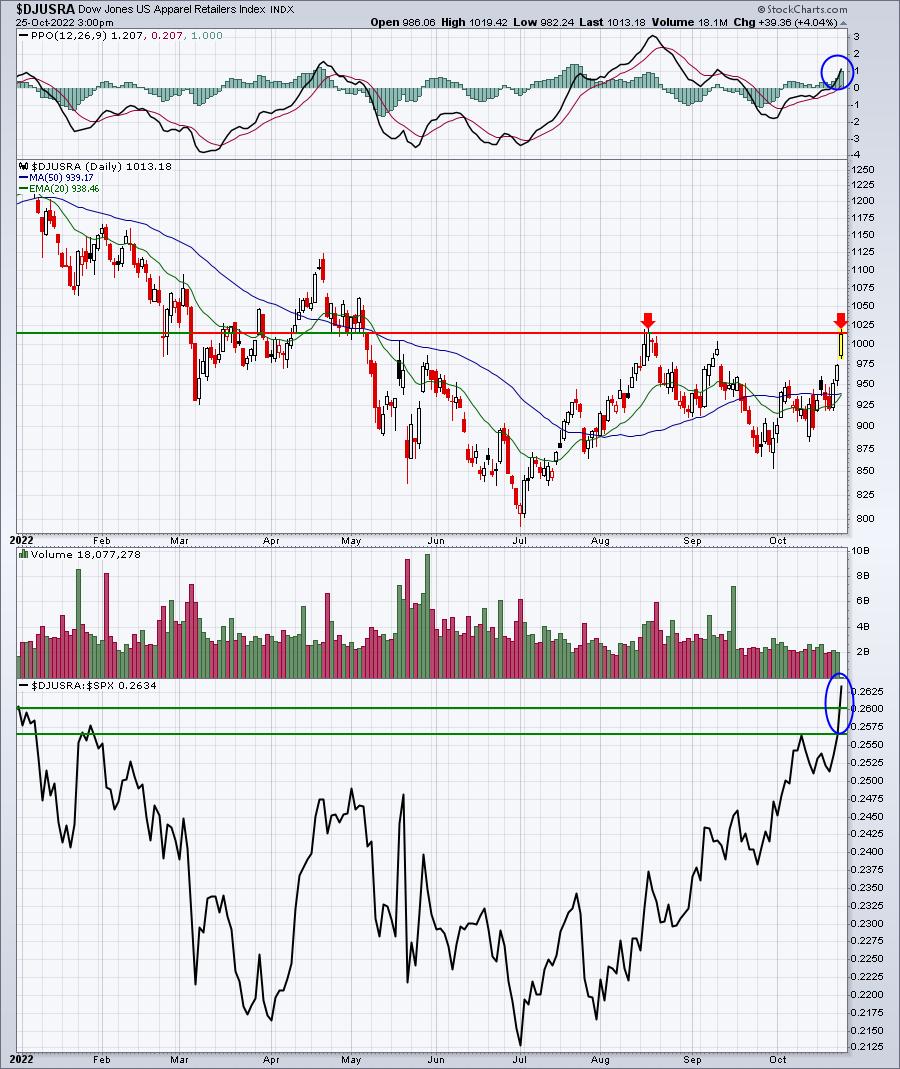
The big hurdle here is clearing the 1014.74 high on August 17th. This industry should not fare well if Wall Street was truly concerned about runaway inflation and a big recession ahead. Is it possible that the worst of the news has ALREADY been priced in? Yes, it's quite possible. I believe it's likely.
ChartLists/Strategies
Long is currently the side to be on, and I believe it'll remain that way. I enjoy trading earnings-related setups, but primarily AFTER earnings, not before. I like to find leading stocks in leading industry groups that report better-than-expected results, and anticipate a solid reward-to-risk entry in the event there's a "sell on the news" type of pullback. Today, I've traded both WR Berkley Corp (WRB) and Cadence Bank (CADE), the former with success, the latter not so much yet. Here's how WRB looks on its daily chart:
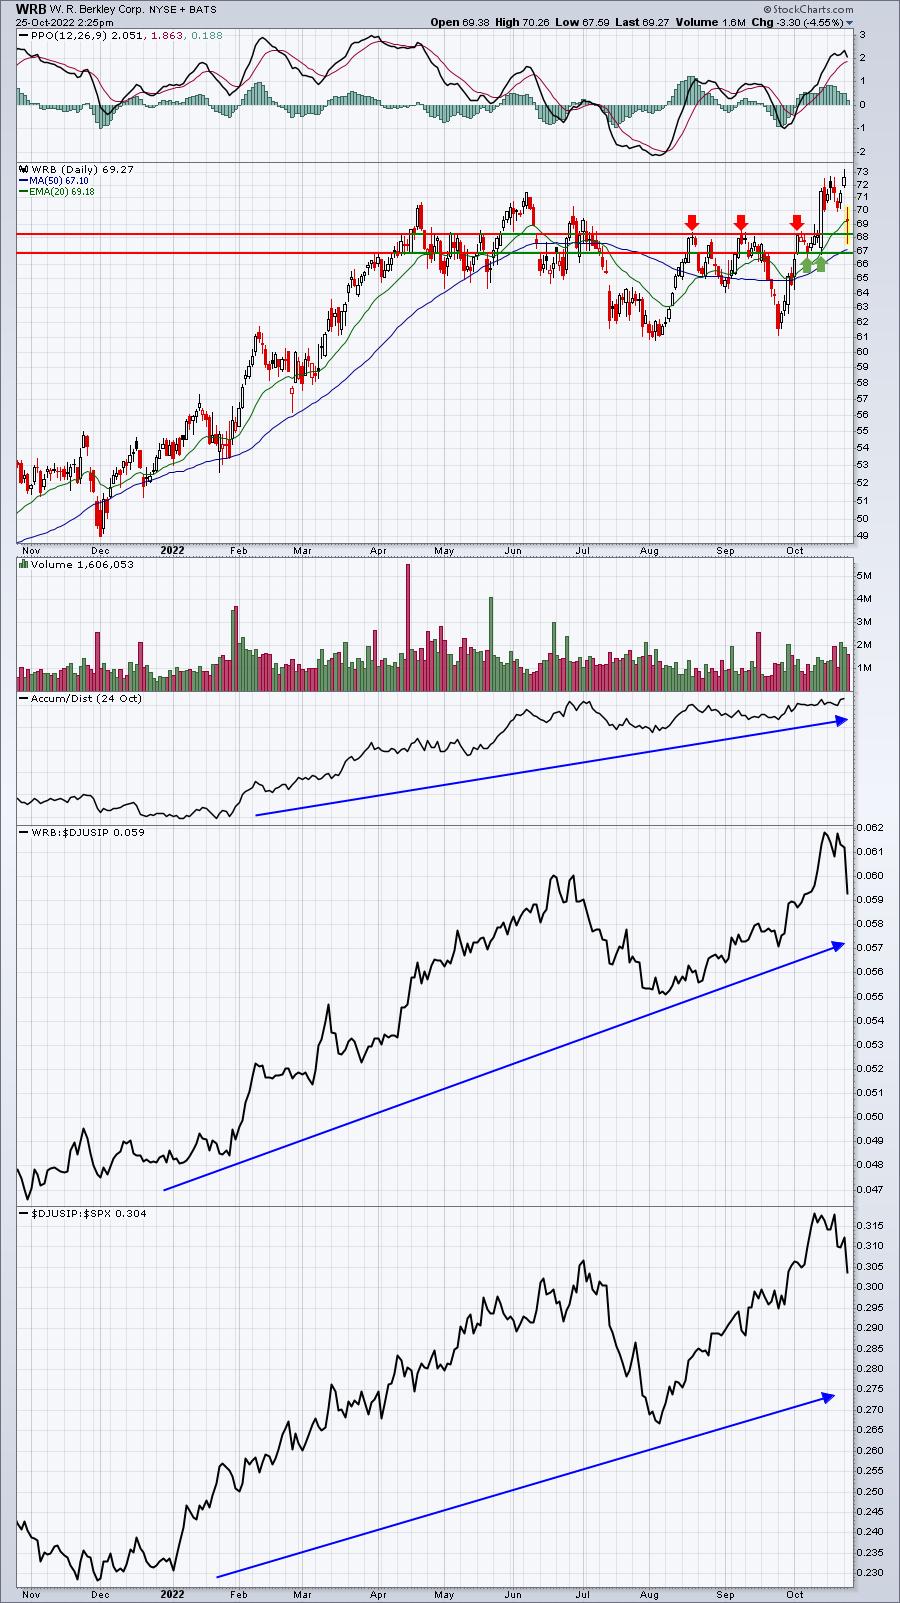
I prefer trading leading stocks in leading industry groups. I have found that my win % is much stronger when I stick with leaders. Buying leaders on pullbacks works especially well for me. WRB reported quarterly results last night that topped both revenue and EPS expectations, yet the stock sold off on the news. I said during last night's Q3 earnings webinar that WRB in the 67-68 range was a solid reward-to-risk entry point. I had placed a limit buy order this morning at 68, which triggered fairly early. I set a sell order just beneath the early morning high of 70.26. WRB hit 70 or just above 70 on 3 separate occasions, but never hit my limit sell price. I decided to take profits at 69.85 (close to 3% profit) a couple hours ago, then bought WRB back when it pulled back to 69.20, saving 1%. I am still holding, looking for a solid finish. I'll see if WRB closes beneath its 20-day EMA, which is currently at 69.18. Otherwise I'll hold.
As I look to companies reporting results tonight after the close or tomorrow before the open, I'm eyeing TXN, IEX, HES, TKR, WING, and WFRD. If they report better-than-expected revenues and EPS and pull back to test recent price support and/or their rising 20-day EMAs, I will seriously consider buying them. I'm still sticking with the QQQ as my primary long investment, but I'll look to trade more and more stocks on the long side as technical conditions improve on our major indices.
One last mention. If this strength continues and you're a VERY aggressive trader, you should be looking at the Short Squeeze ChartList (SSCL). As market conditions improve, more and more shorts will look to minimize losses - at least the smart short sellers will. If the S&P 500 negotiates 3900 resistance, I would not be at all surprised to see some of our SSCL stocks soaring.
Earnings Reports
Here are the key earnings reports for the next two days, featuring stocks with market caps of more than $10 billion. I also include several companies with market caps below $10 billion. Finally, any portfolio stocks that will be reporting results are highlighted in BOLD. If you decide to hold a stock into earnings, please understand the significant short-term risk that you are taking. Please be sure to check for earnings dates for any companies you own or are considering owning.
Tuesday, October 25:
MSFT, GOOGL, V, KO, NVS, TXN, UPS, RTX, HSBC, SAP, CB, GE, CNI, MMM, ITW, SHW, UBS, GM, VLO, ADM, MCO, CMG, CNC, BIIB, KMB, TWTR, ENPH, MSCI, PCAR, HAL, AMP, CSGP, GLW, EQR, CJ, FE, SPOT, SYF, IEX, AGR, KB, NVR, TER, HUBB, BXP, TRU, JNPR, ARCC, FFIV, PHM, CLF, MANH, MAT, GPK, PNR, PII, SKX, TENB, XRX, JBLU, LRN, SSTK, NBR
Wednesday, October 26:
META, TMO, BMY, EQNR, KOF, ADP, BA, NOW, GD, WM, CP, CME, BSX, F, NSC, ORLY, KHC, APH, HES, KLAC, ROP, SCCO, HLT, IQV, ODFL, OTIS, DLR, FTV, RJF, MOH, INVH, URI, AEM, DB, ROL, ACGL, MAA, BMRN, AZPN, TDY, ALGN, GRMN, UMC, ESS, EQT, TYL, AVY, BG, WOLF, UDR, STX, GL, RE, VFC, GGG, MAS, AR, OC, OLN, FBHS, MUSA, SEIC, INFA, DRVN, HOG, PPC, VRT, SLGN, SLAB, TDOC, R, WING, ALSN, QS, TMHC, MTH, GPI, PI, FORM, BOOT, UPWK, IRBT, UCTT, GSHD, LC, OII
Economic Reports
August Case-Shiller home price index: -1.3% (actual) vs. -0.8% (estimate)
August FHFA house price index: -0.7% (actual) vs. -0.7% (estimate)
October consumer confidence: 102.6 (actual) vs. 106.0 (estimate)
Happy trading!
Tom