
EB Daily Market Report - Friday, October 28, 2022
DMR Clarification
I received a large number of questions about the @SPYQQQ chart that I provided yesterday. I created a User-Defined Index (UDI) to track what I believe is a MUCH better indicator of rotation between the S&P 500 and NASDAQ 100. The SPY and QQQ simply are the ETFs used to track this. @SPYQQQ is simply the name I used for this UDI. The calculation itself is an indication of intraday rotation and is based on QQQ:SPY. I wasn't thinking ahead as to how this would appear on the chart when I named it @SPYQQQ. My bad. I've asked StockCharts if there is a way to change the name of a UDI. If there is, I'll change the name. If not, I'll likely create a new one with the name being @QQQSPY, because I think this will be a question asked over and over again in the future. Sorry for the confusion.
But rest assured, the calculation is based on the QQQ:SPY relationship, similar to what I showed in the bottom panel of the chart yesterday. The only difference between the two charts is that the top chart reflects INTRADAY rotation where the bottom chart includes the opening gaps.
BIG Announcement - Mark Your Calendar
I've been discussing market manipulation throughout 2022 and now we've created an event about it. Mark your calendar for Saturday, November 5th. I'll spend much of that morning discussing "amateur hour", the disparity in gaps vs. trading throughout the rest of the day, monthly options expiration, money flows, and other manipulation-related topics. It'll be an eye-opening morning, devoted to uncovering the schemes of market makers.
This is VERY important. EB.com members do NOT need to register. You are automatically registered and we'll send you room instructions the morning of the event. Just mark your calendar. If you'd like to see a bit more information about the event, CLICK HERE. If you do register, you'll simply be subject to promotional emails.
Executive Market Summary
- Futures were mixed overnight after another slew of earnings reports were released
- The biggest names are seeing mixed reactions as well
- Apple (AAPL, +6.94%) initially moved lower after the bell yesterday, but clearly its record revenues convinced more buyers
- Amazon.com (AMZN, -10.25%), on the other hand, is one of the worst S&P 500 performers today after missing on its quarterly revenues and EPS
- These two reactions are largely the reason for an outperforming and leading technology sector (XLK, +3.54%) and a lagging discretionary group (XLY, -1.57%)
- The 10-year treasury yield ($TNX) is up 7 basis points to 4.01%, clinging onto 20-day EMA support at 3.96%
- Nearly every commodity is lower today, led by natural gas ($NATGAS, -4.90%) and copper ($COPPER, -2.67%); crude oil ($WTIC, -1.58%) is back beneath $88 per barrel
- Intel (INTC, +9.55%) had a very strong earnings report, where EPS easily beat expectations, $.59 vs. $.34; but can it clear its 50-day SMA?
Market Outlook
The earnings this quarter have not been very good. Guidance, in many cases, has been weak. Interest rates are higher and the Fed seems more determined than ever to keep raising rates. The pace of inflation has adamantly remained high. Recession fears are growing. All of these things have grown worse since I called a market bottom on June 17th, when the S&P 500 hit a low of 3636. Despite conditions worsening throughout the summer, the S&P 500 now sits at 3870, about to challenge a key price resistance level of 3900.
THIS IS SCREAMING AT US THAT EVERYTHING IS ALREADY PRICED IN.
Wall Street firms are positioning for MUCH BETTER conditions ahead. They will once again take advantage of retail traders. This is how they stay in business and pay outrageous salaries and bonuses to the greediest people on earth. I have spent much of my adult life analyzing the stock market. I'm not talking about from 9 to 5. I am EXTREMELY PASSIONATE about researching EXACTLY what makes the stock market tick. I don't do this for nothing. I have learned so much over the years and I want to help ALL of you negotiate investing as much as I absolutely can. You don't have to believe any of what I say, but I sure hope you'll consider it. Wall Street firms CANNOT buy and sell stocks at opening gaps. There is not enough liquidity. Instead, they will buy or sell, via market makers, throughout the trading day. Intraday rotation is ABSOLUTELY CRITICAL to understanding what is truly taking place in the stock market.
Prepare NOW for higher prices ahead. Could I be wrong? YESSSSSSSSSS!!!! But as I said at the market top in early January, it's all about reviewing ALL of the signals and MANAGING RISK. I am 100% convinced that the RISK of being short or in cash is MUCH GREATER than being in the stock market. I do prefer ETFs to limit damage in the event I'm wrong, but I want to be fully invested right now. Personally, I'm doing it with more leverage, but that's not for everyone.
Sector/Industry Focus
Technology (XLK) is beginning to show much more bullish characteristics as you can see on the daily chart below:
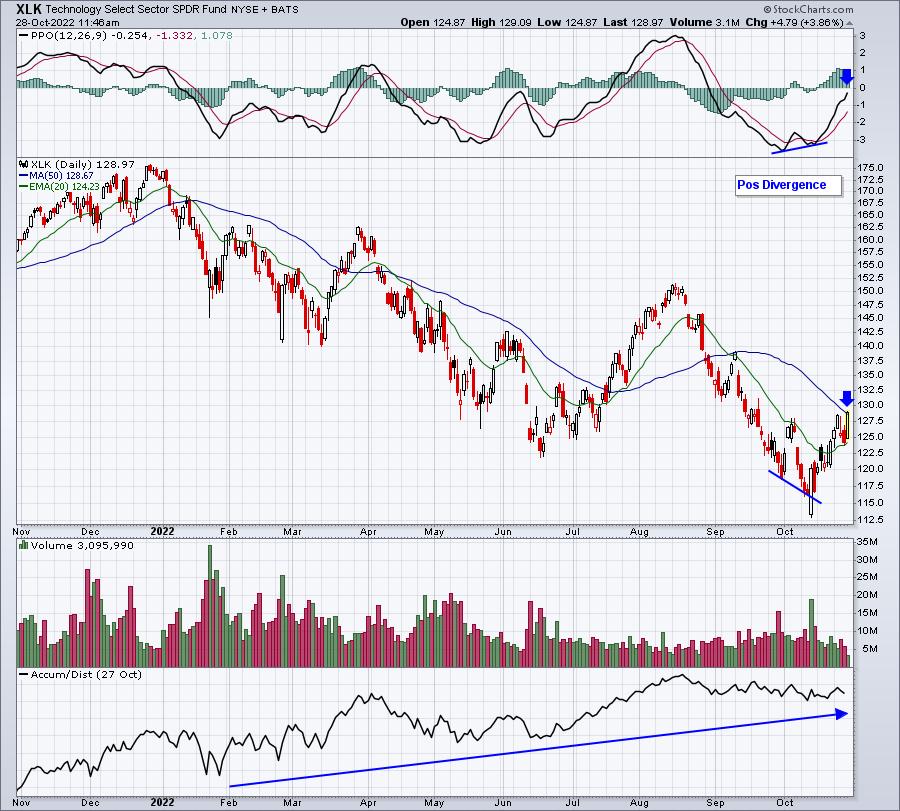
Any time I see a positive divergence, I think 50-day SMA test and/or PPO centerline test. We are getting both now. So is this run over? Well, I don't believe so for many reasons, mostly dealing with intraday accumulation. But if we stick to just technical indications, let's move on to the XLK weekly chart:
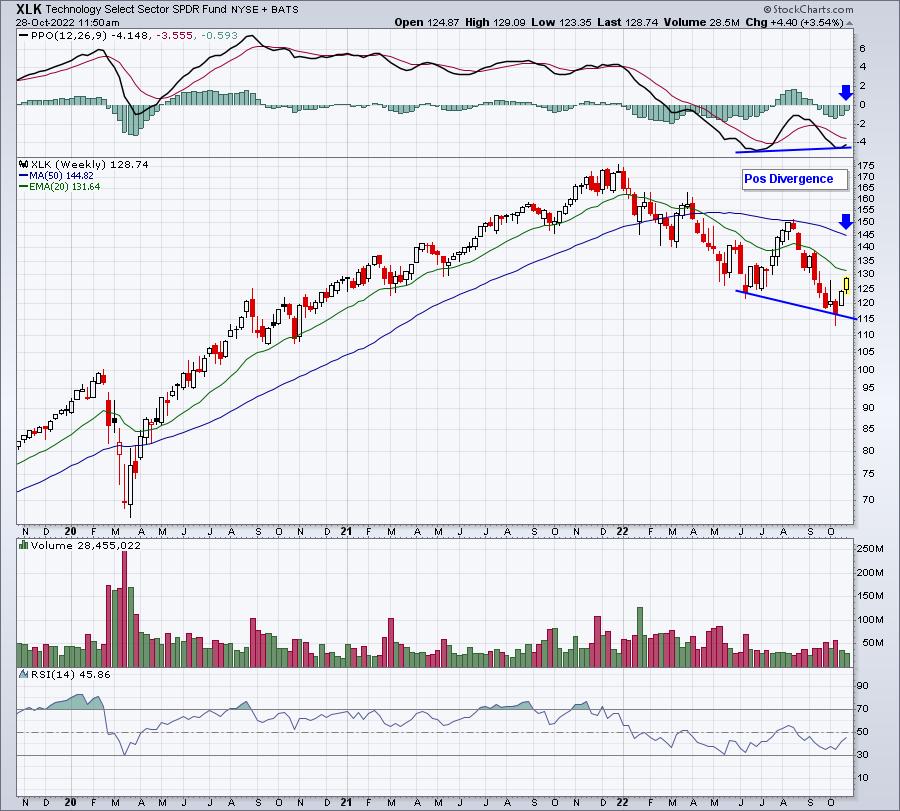
The positive divergence on this weekly chart suggests there's still another 10% upside to the 50-week SMA. Divergences are powerful reversal signals and to see both daily and weekly positive divergences across so many charts right now is quite comforting as we head into the most bullish time of the year.
Those staying on the bearish side right now are being heavily influenced by the news, which admittedly remains SO bearish. Just remember the stock market looks ahead. All the bad stuff we're experiencing right now, in my opinion, was priced in throughout the first six months of 2022. That's why rotation has turned more bullish. Prices are heading higher. But again, it's just my opinion. Everyone must decide what makes sense for them.
ChartLists/Strategies
I've discussed several short-term trading strategies around earnings recently, but I believe we're going to be entering a much more bullish period for U.S. equities. Despite the rising rate environment, I continue to see signs that lower prices on our major indices will not last. Wall Street firms are betting on a reversal. Therefore, so am I. My philosophy with the stock market during a more bullish phase is to stick with leading stocks in leading industry groups. It's really a quite simple strategy. As I looked through our Strong Earnings ChartList (SECL) this morning, I found 3 companies that help to illustrate what I'm looking for in trading candidates. Just keep in mind that I'm a momentum trader, not a bottom fisher. I put my money in "what's working", not "what I hope will start working". Here are 3 examples of what I like in my trading candidates:
WRB:
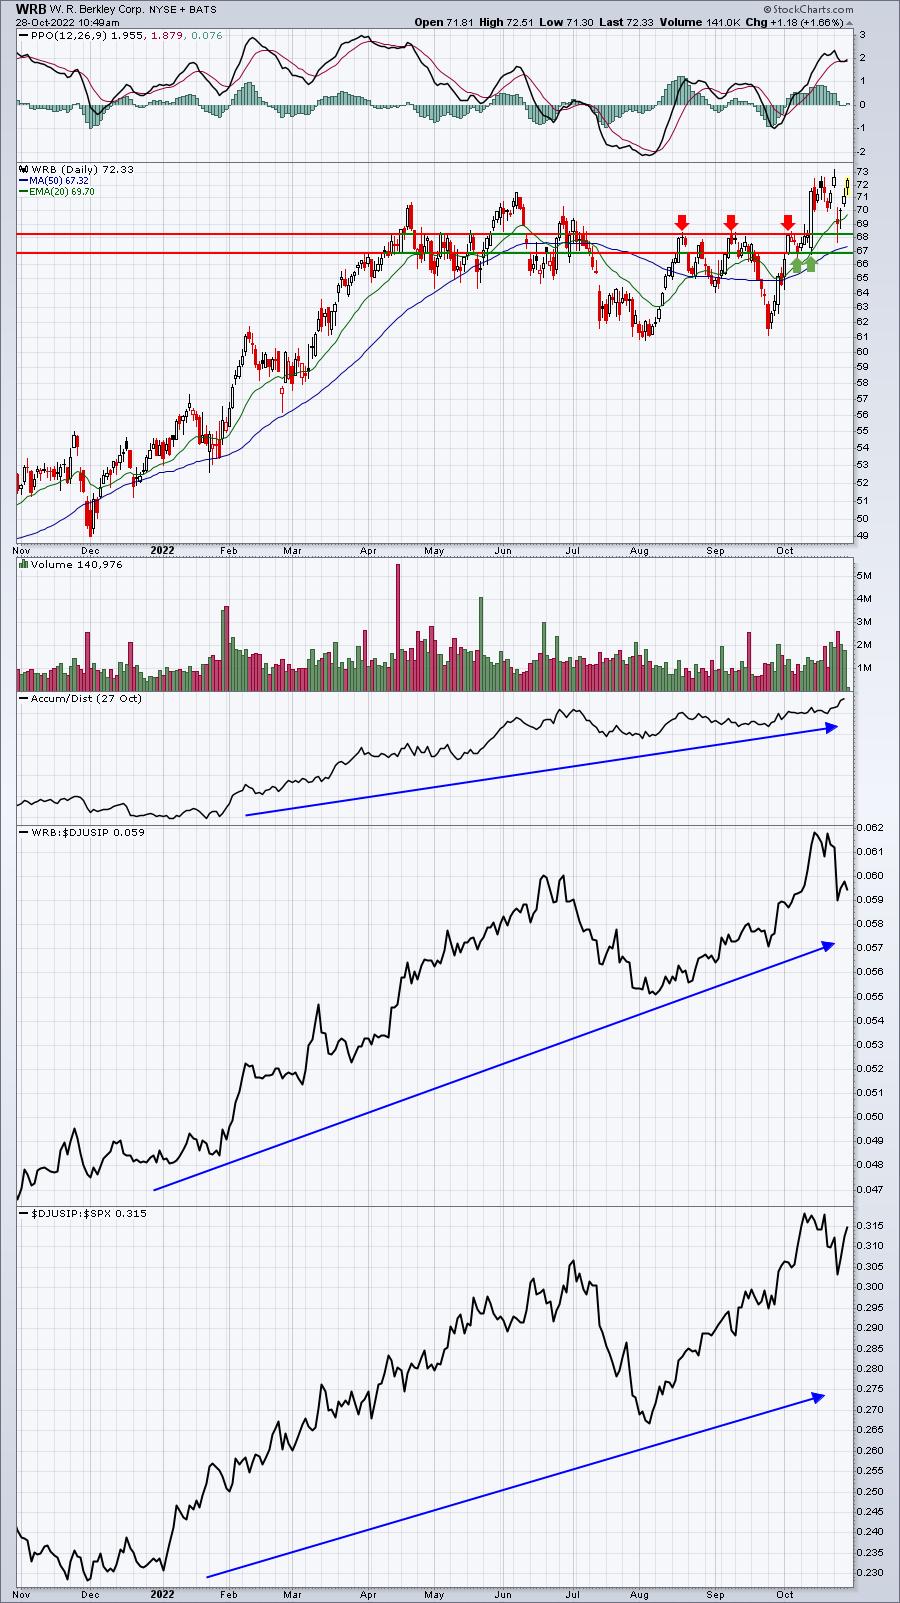
I highlighted WRB a few days ago. After reporting excellent quarterly results, it pulled back to its 20-day EMA, providing an entry opportunity. It certainly appears to be in uptrend mode now, as opposed to its recent sideways consolidation. Financials love this time of year and insurance stocks have been leaders. WRB is leading its peer group higher and its AD line is excellent. I like to ride momentum and strength like WRB. UNM is another insurance company (life insurance) that is absolutely on fire. UNM is one of our Income Portfolio stocks.
WTI:
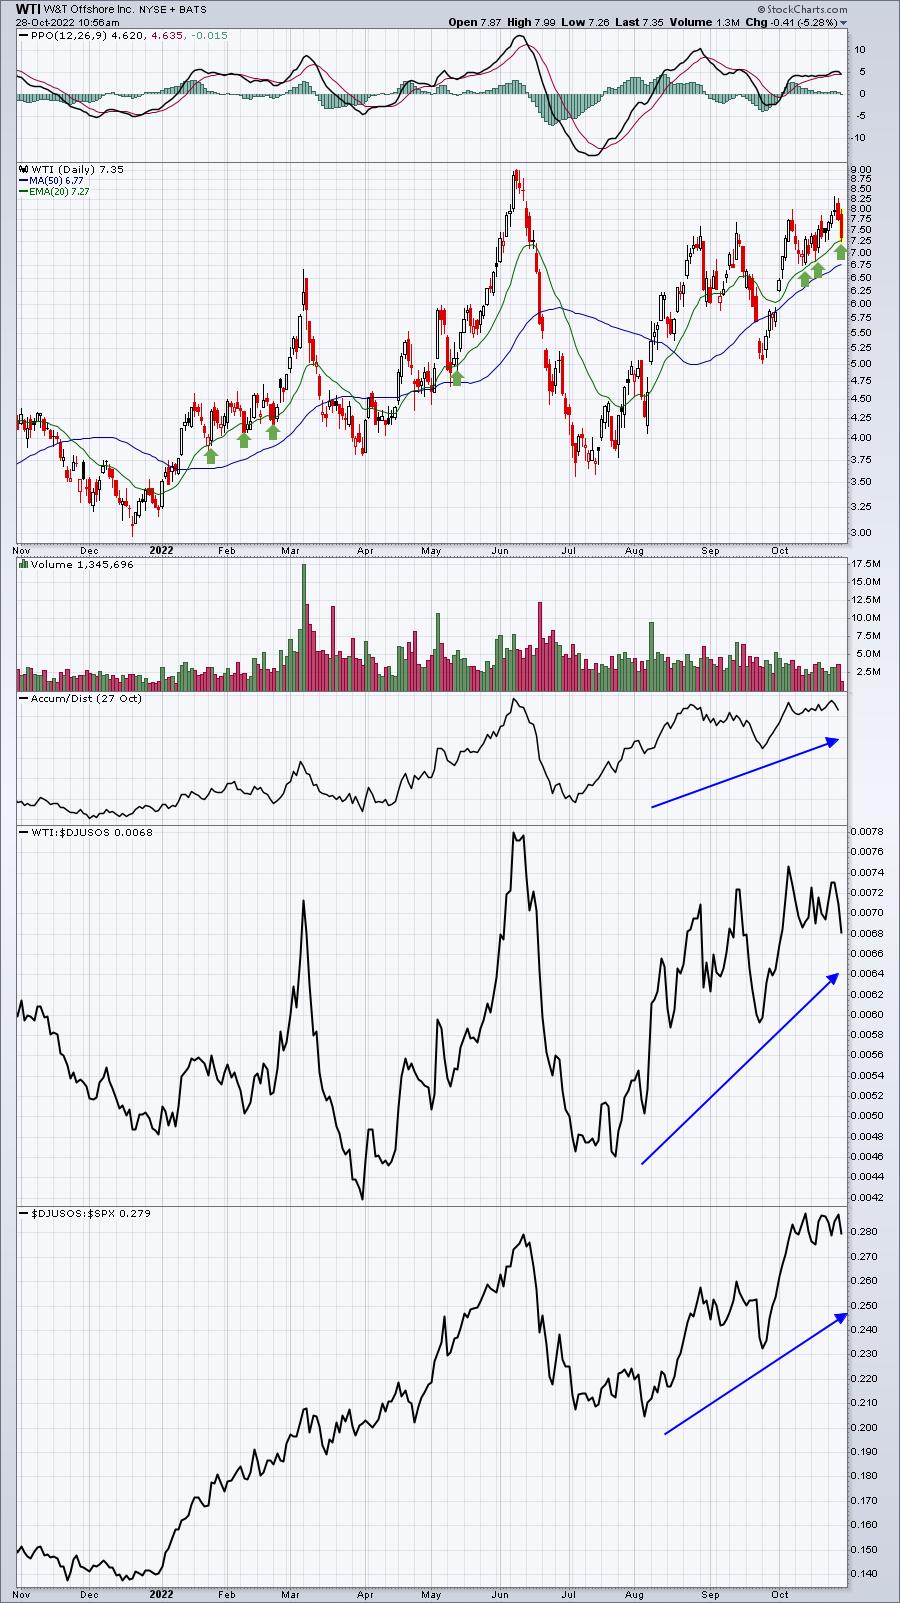
I generally stay way from low-dollar stocks, but this was a pretty good example of how leading stocks will pull back to present short-term trading opportunities. WTI is a nice leader in the energy sector and it pulled back 10% from yesterday's high to test its rising 20-day EMA. The strong AD line tells me that morning weakness is not likely to last - and if it does, I can set a fairly tight stop. Buying into strength yesterday leaves a much bigger loss and, potentially, a more emotional trade. I like to buy leading stocks at or near key support to manage risk. PBR is a much larger energy company ($86 billion market cap) that has also pulled back of late and is now testing its uptrend line (if you connect recent lows).
CSGP:
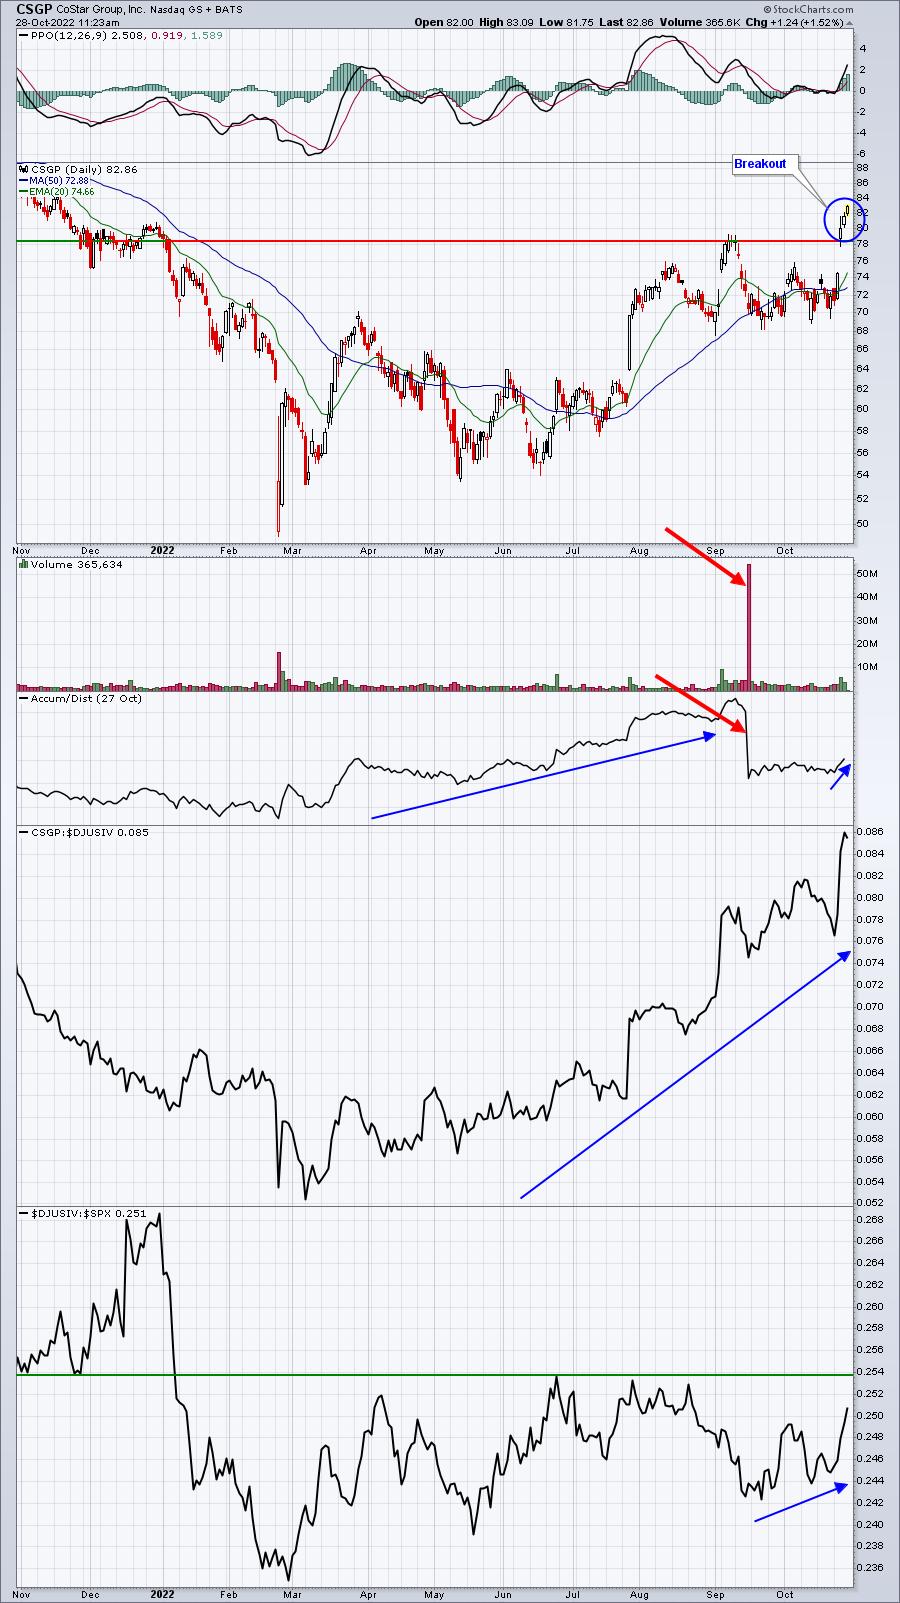
Here's another leader. CGSP is in the industrials sector, which has been very solid on a relative basis throughout much of 2022. I love the breakout on increasing volume. Also, I view this AD as very strong. The drop occurred from one day in September. Volume is a multiplier, so when you have one day's volume that's completely "off the charts", it can have an extreme impact on the AD. CSGP had a secondary offering in September, which accounted for the large volume that day. Unfortunately, there's no way that I'm aware of to adjust a stock's AD line for a one-time event like this. If a company reports earnings and there's large volume to push down the AD line, I wouldn't be interested in ignoring that. That's likely a true signal of distribution. But when the only thing being impacted is liquidity (more shares offered), I don't think that's a reason to suggest there's a lot of distribution that's taking place. Therefore, I believe this big drop in the AD line is very misleading. CMI is another industrials stock that also has been exceptionally strong. Pullbacks in stocks like these create great trading opportunities.
Earnings Reports
Here are the key earnings reports for the next two days, featuring stocks with market caps of more than $10 billion. I also include several companies with market caps below $10 billion. Finally, any portfolio stocks that will be reporting results are highlighted in BOLD. If you decide to hold a stock into earnings, please understand the significant short-term risk that you are taking. Please be sure to check for earnings dates for any companies you own or are considering owning.
Friday, October 28:
XOM, CVX, ABBV, NEE, EQNR, SNY, CL, AON, CHTR, E, NWG, GWW, LYB, CHD, AVTR, BAH, DVA, RDY, GTLS, NWL, GNTX, NVT, CRI, JKS, BLMN, CRTO
Monday, October 31:
SYK, WMB, AFL, NXPI, GPN, ANET, ON, SBAC, PEG, AWK, HOLX, CINF, HWM, L, CAR, CNA, RRX, ACHC, LSCC, SON, XPO, SAIA, AMKR, VNO, NSP, AXNX, GT, RMBS, VRNS, HLF, KMT, HLIT
Economic Reports
September personal income: +0.4% (actual) vs. +0.3% (estimate)
September personal spending: +0.6% (actual) vs. +0.4% (estimate)
October consumer sentiment: 59.9 (actual) vs. 59.7 (estimate)
September pending home sales: -10.2% (actual) vs. -3.8% (estimate)
Happy trading!
Tom