
EB Daily Market Report - Tuesday, November 1, 2022
ChartLists Updated
Several ChartLists have been updated over the past few days. They are:
- Strong Earnings ChartList (SECL)
- Strong Future Earnings ChartList (SFECL)
- Short Squeeze ChartList (SSCL)
- November Seasonality ChartList (SEASCL)
- All Upcoming Earnings ChartLists, including the Upcoming Earnings Relative Strength ChartList
In addition, both the Monthly Seasonality Report and Monthly Short Report for November have been published over the past 24 hours. There's plenty to chew on as we await the Fed, the jobs report, and a plethora of earnings reports the balance of this week.
BIG Announcement - Mark Your Calendar
I've been discussing market manipulation throughout 2022 and now we've created an event about it. Mark your calendar for Saturday, November 5th. I'll spend much of that morning discussing "amateur hour", the disparity in gaps vs. trading throughout the rest of the day, monthly options expiration, money flows, and other manipulation-related topics. It'll be an eye-opening morning, devoted to uncovering the schemes of market makers.
This is VERY important. EB.com members do NOT need to register. You are automatically registered and we'll send you room instructions the morning of the event. Just mark your calendar. If you'd like to see a bit more information about the event, CLICK HERE. If you do register, you'll simply be subject to promotional emails.
Executive Market Summary
- Futures were higher across the board overnight as our major indices looked to reverse the Monday losses
- The NASDAQ has underperformed since the open, likely due to the significant reversal in the 10-year treasury yield ($TNX) intraday
- After starting the day deep in negative territory (the TNX was down nearly 16 basis points when the bond market opened), it climbed all the way back to breakeven and is currently down just 2 basis points to 4.05%
- Sector performance suggests a very cautious market ahead of the Fed announcement tomorrow afternoon
- Energy (XLE, +1.06%) and utilities (XLU, +0.51%) are strong today, while consumer stocks are weak - discretionary (XLY, -0.85%) trails the other 10 sectors and staples (XLP, -0.32%) are down as well
- Commodities are mostly higher, with crude oil ($WTIC, +2.47%) spiking back to near $89 per barrel
- Earnings reports are accelerating, reaching a peak by Thursday of this week
- All eyes are on the Fed with its 75-basis-point hike awaiting tomorrow, and the nonfarm payrolls report, due out on Friday morning; throw in the HUGE number of earnings reports and we could see significant whipsaw action this week
- Johnson & Johnson (JNJ, -0.62%) agreed to acquire Abiomed (ABMD, +50.22%) in an all-cash deal valued at more than $17 billion
Market Outlook
As a refresher, the most important reason I gave back at the beginning of the year that we'd likely see a significant decline in U.S. equities was that sentiment NEEDED to be reset. EVERYONE was buying calls and acting as if the stock market was an ATM machine. I've been around the block a few times and understand that market environment not only doesn't last forever, but that it's also EXTREMELY dangerous. The equity-only put-call ratio ($CPCE) has been rising steadily throughout the year. After nearly two years with few CPCE readings over .60 and most beneath .50, I want you to look at how this reset has taken place ALL YEAR LONG:
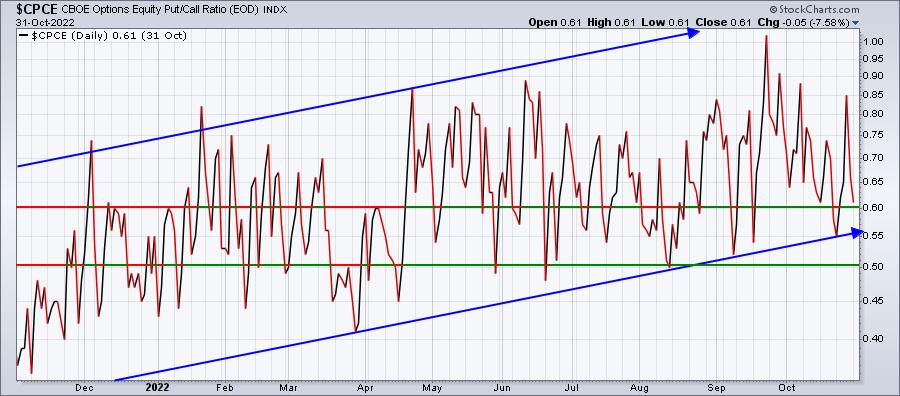
I drew a horizontal line at .50 and .60, because this range is the level that we mostly stayed below throughout 2020 (after March) and during much of 2021. Since April of this year, however, nearly every single daily reading has been above .50 and the overwhelming majority have been above .60.
Here's what this same exact chart looked like in 2020 and 2021 for reference:
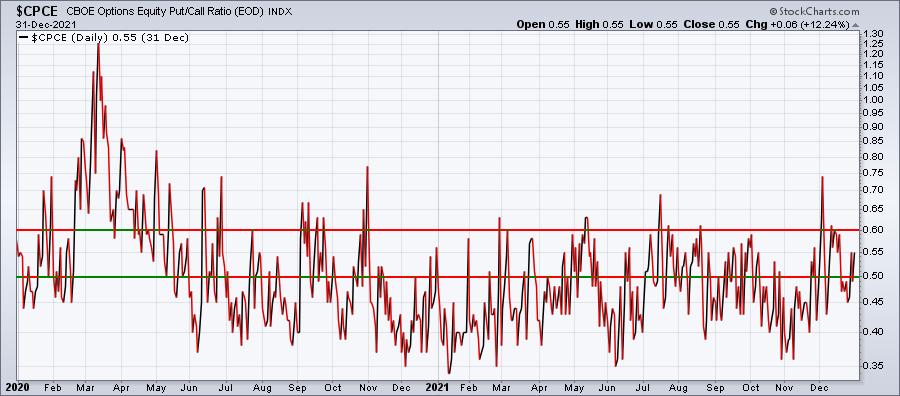
Do you see how much sentiment has shifted? Options traders couldn't buy enough calls the past two years as the biggest 22-month rally in the past 7 decades unfolded. That needed to change and it did. The bearish sentiment has now reached a level where bull markets can begin anew. And that's exactly what I'm expecting will occur. We simply have to remain patient.
Sector/Industry Focus
Pharmaceuticals ($DJUSPR) may not be a bad area to be invested in as we head into the Fed announcement tomorrow at 2pm ET. They're a defensive industry group within mostly a defensive sector - health care (XLV). I ran a scan of 20-day EMA tests against our Strong Future Earnings ChartList (SFECL) below in ChartLists/Strategies and several pharmas were returned as the group got off to a rough start this morning. The daily chart of the DJUSPR looks pretty solid, though. Check it out:
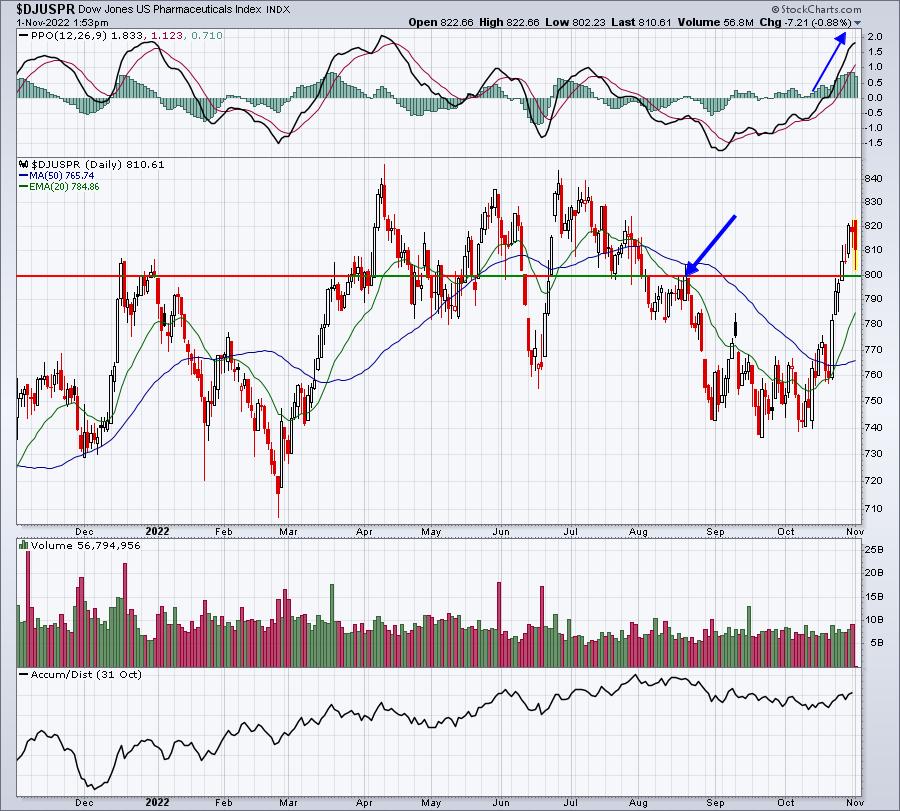
It's been a strong run and I do think we'll rotation out of this group and into more aggressive industries later in the year. But for right now, this is a leading group. As long as the overall market continues to struggle at key levels, there'll be a push into more defensive areas. Pharmas should benefit from that.
ChartLists/Strategies
We do a LOT of research for our members, hoping to help you uncover stocks that fit your own trading styles and strategies. If you like strong fundamentals, sticking with our Strong Earnings ChartList (SECL) probably makes a lot of sense, especially when the stock market is trending higher. If you're more interested in strong technical conditions without regard for fundamentals, then the Strong Future Earnings ChartList (SFECL) may be a better fit. Both were updated yesterday. Stocks in leading industry groups with SCTR (StockCharts Technical Rank) scores above 75 will be on our SFECL - IF they're not already on our SECL. Look at the SFECL as a Watch List of the most technically-sound stocks that did NOT beat their most recent revenue and/or EPS estimates. There should never be a stock that's on both ChartLists.
We also have pre-defined scans on our website that you use. If you're signed into your StockCharts.com account, simply click on the scan code on our website and it'll automatically enter this coding into the StockCharts.com scan engine. The only thing you'll need to do is use the drop down menus beneath the scan criteria to select the ChartLists that you want to scan. For instance, to scan 20-day EMA tests on the SFECL, the scan will look like this:

Just keep one thing in mind. In MY StockCharts.com account, the SFECL is "favorites list is 232". It won't be the same in your StockCharts.com account. It likely will have a different favorites list number. So if you try to run the scan above verbatim, you'll very likely get zero results OR it will run the scan against whatever ChartList in your account that has the favorites list as 232. Also, I deleted the requirement for the SCTR to be above 75. I just updated the SFECL on Friday, so nearly every stock on this ChartList has a SCTR score above 75.
Here were the results - 24 stocks were returned:
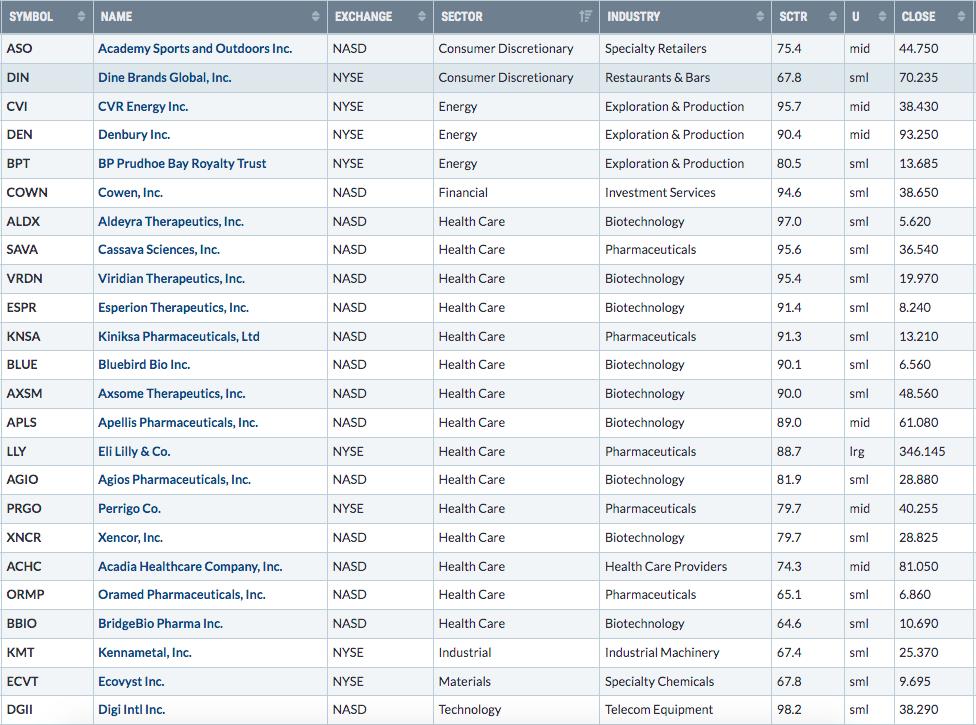
I sorted this FIRST by SCTR score, highest to lowest. I then sorted SECOND by the sector. Note how many health care stocks were returned from this scan (15). Given that so many have pulled back, I'd be picky and look for those that show strong leadership and excellent AD lines. I like two of them - LLY and PRGO. Let's look at the charts:
LLY:
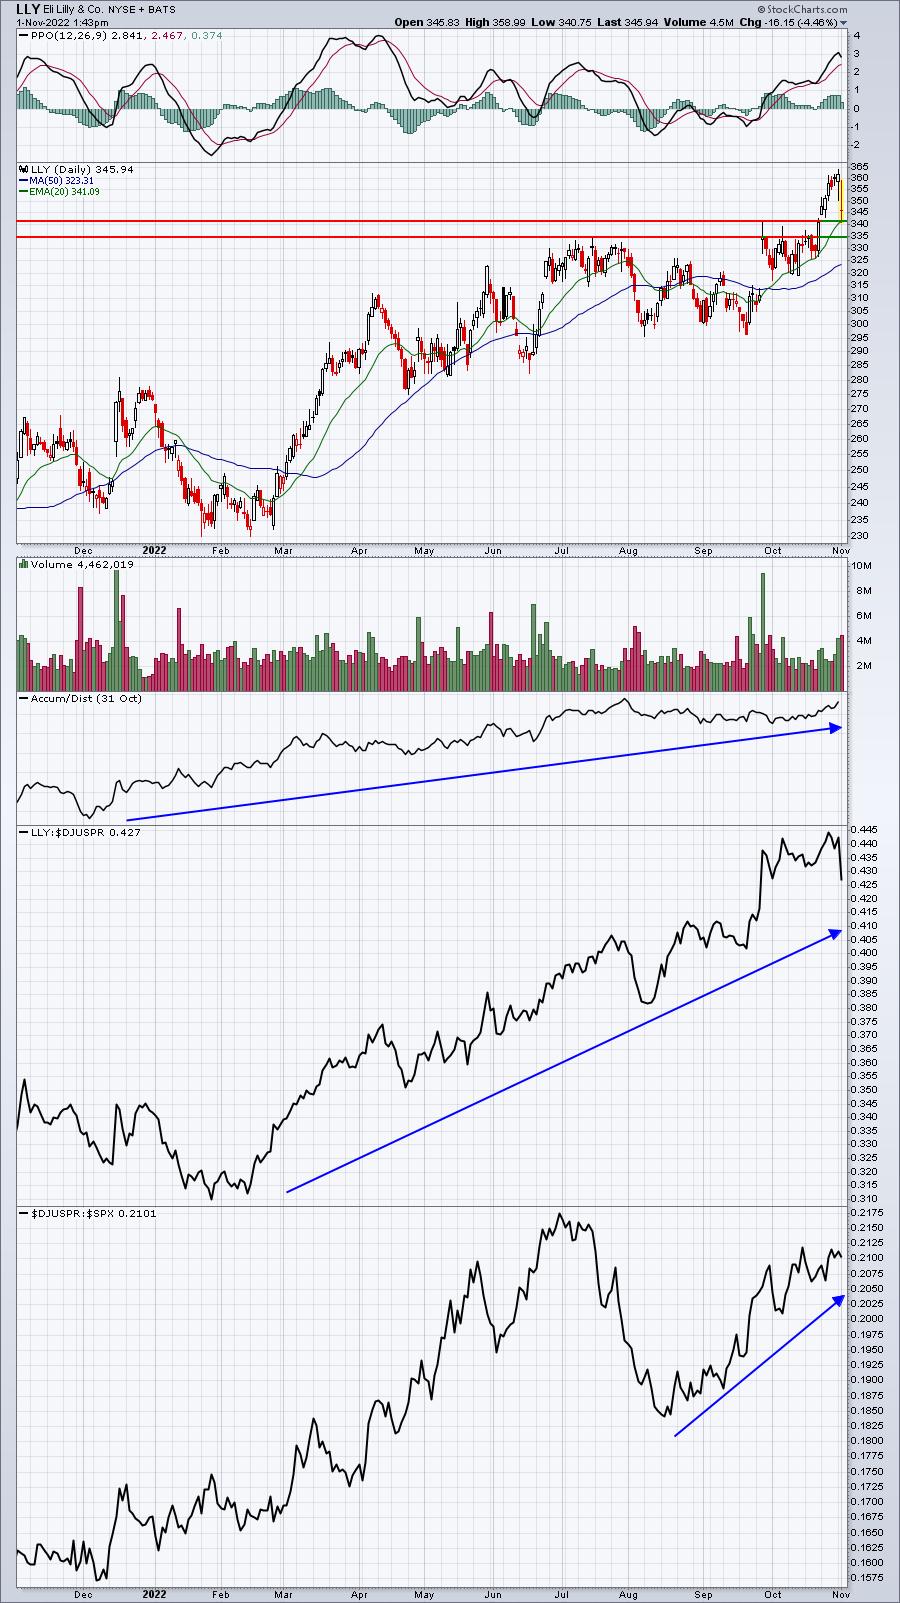
I believe I mentioned the 20-day EMA test as key support on my Trading Places Live show this morning. LLY is a leader among the pharmas and reported quarterly results today. They beat on both revenues and EPS, yet sold off hard back to test that 20-day EMA. The strong AD line suggested we'd likely see some recovery throughout the trading day. (Disclosure: I bought LLY this morning)
PRGO:
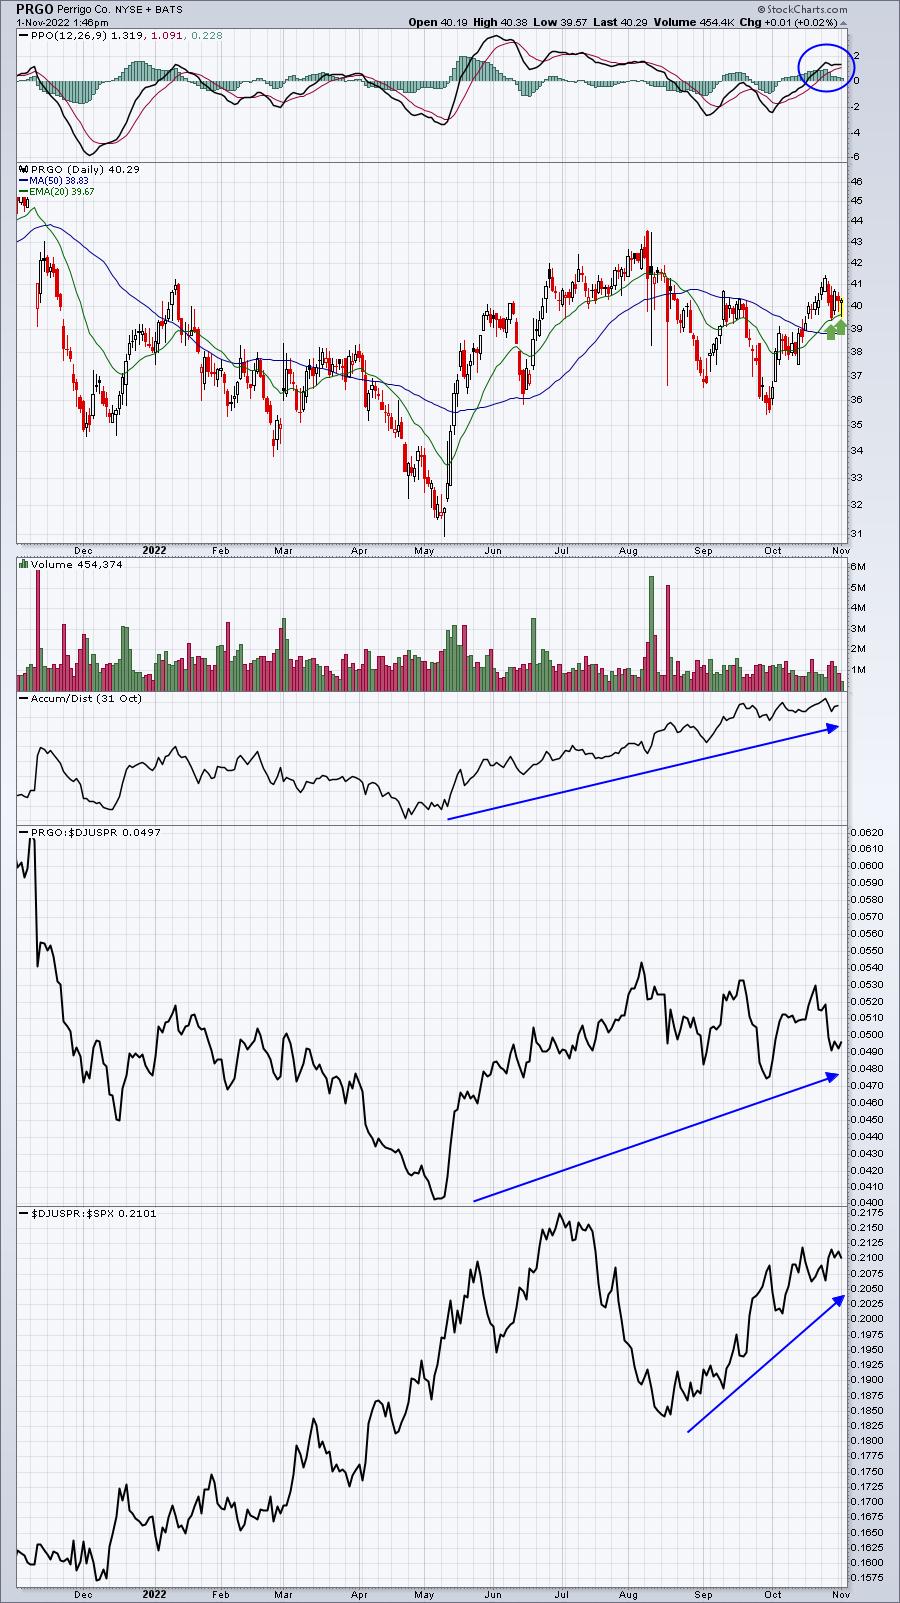
PRGO hasn't been on quite the same type of run as LLY, but it also hasn't dropped as much today. The test of the rising 20-day EMA is an opportunity for entry without a whole lot of risk. Its AD line is also excellent and PRGO has bounced as expected off its 20-day EMA test. I don't currently own PRGO.
Earnings Reports
Here are the key earnings reports for the next two days, featuring stocks with market caps of more than $10 billion. I also include several companies with market caps below $10 billion. Finally, any portfolio stocks that will be reporting results are highlighted in BOLD. If you decide to hold a stock into earnings, please understand the significant short-term risk that you are taking. Please be sure to check for earnings dates for any companies you own or are considering owning.
Tuesday, November 1:
LLY, PFE, TM, BP, AMD, MDLZ, SONY, ABNB, ETN, MCK, MPC, PSA, UBER, EPD, TRI, PSX, DVN, ECL, SYY, AIG, KKR, PRU, ET, SPG, EA, NEM, MPLX, IDXX, AME, WEC, VRSK, OKE, CHT, SIRI, EXR, IT, EIX, PAYC, XYL, CLX, ZI, CNP, WAT, AMCR, YUMC, WAB, INCY, MKL, FOXA, FOX, ZBRA, FMC, LDOS, MTCH, CTLT, CHK, BEN, ABMD, TECH, TAP, NBIX, RGEN, SCI, HSIC, CZR, UNM, LEA, SEE, HRB, WU, SOFI, LPX, SUN, IRTC, SMCI, AYX, MSTR, AMRC, LGIH, ARNC, ATRC, SIMO, MYGN, TGH, ATEN, BCOR, WTI, PERI
Wednesday, November 2:
NVO, QCOM, CVS, BKNG, EL, HUM, GSK, MET, EQIX, SU, FTNT, NTR, TEL, CVE, O, TT, RACE, ALL, WCN, YUM, ALB, CTSH, APO, ROK, CLR, ES, SLF, ZBH, CDW, EBAY, VMC, ETR, MRO, MLM, CF, IR, ANSS, TS, TPL, BR, BIP, ICLR, TRMB, APA, HZNP, FLT, MGM, HUBS, PTC, HST, ETSY, PARA, AFG, CHRW, ENTG, EQH, WES, CRL, UTHR, NI, DT, HOOD, SRPT, CDAY, WSC, LSI, LNC, QRVO, ZG, CFLT, ROKU, GNRC, NNN, PCOR, NCLH, PDCE, YNDX, CLH, CW, RGLD, QDEL, QLYS, PYCR, MKSI, RUN, WK, POWI, TNDM, TWNK, STAA, LPL, TXG, VSH, SMG, RPD, RIG, FROG, WERN, MLCO, FSR, ELF, PLMR, NUS, SITM, ACLS, XHR, GOOS, EVOP, IRBT, EAT, CCRN, VCYT, INFN, FSLY
Economic Reports
October PMI manufacturing: 50.4 (actual) vs. 49.9 (estimate)
October ISM manufacturing: 50.2 (actual) vs. 50.0 (estimate)
September construction spending: +0.2% (actual) vs. -0.5% (estimate)
FOMC meeting begins
Happy trading!
Tom