
EB Daily Market Report - Thursday, November 3, 2022
Executive Market Summary
- Futures were weak overnight, extending the heavy selling from Wednesday afternoon
- The Fed hiked the fed funds rate by 75 basis points, as expected, but its hawkish tone sent traders for the exits
- We opened lower and sold off in the first 30 minutes - like so many other times in 2022 - before rebounding a bit; how do we close? That's the bigger question
- Gold ($GOLD, -1.23%) has fallen hard since shortly after the Fed announcement, which makes little sense if you believe in the inflation rhetoric
- Most commodities are lower today, led by crude oil's ($WTIC, -1.30%) pullback beneath $89 per barrel
- The 10-year treasury yield ($TNX) has spiked 9 basis points to 4.15%, but it has fallen from its earlier high of 4.22%, aid a slight recovery in U.S. equities
- Energy (XLE, +2.23%) and industrials (XLI, +1.62%) are leading today's sector performance, while technology (XLK, -1.95%) and communication services (XLC, -1.80%) are easily the weakest sectors
- Etsy, Inc. (ETSY, +16.07%) is today's S&P 500 leader after reporting excellent quarterly results
- Not faring quite so well is Lincoln National (LNC, -32.03%), a life insurer, one of the stronger industry groups; however, LNC has been a poor relative performer in the group and now we see why
Market Outlook
We've seen a nasty downturn again, as the S&P 500 failed once again at 3900 price resistance. That's obviously a short-term negative, making it difficult for the bulls to find much support. There are always two sides to every stock market story, though, and I find it quite interesting that the put option buyers were out in full force after the Fed decision yesterday. Check out this daily chart of the equity-only put-call ratio ($CPCE):
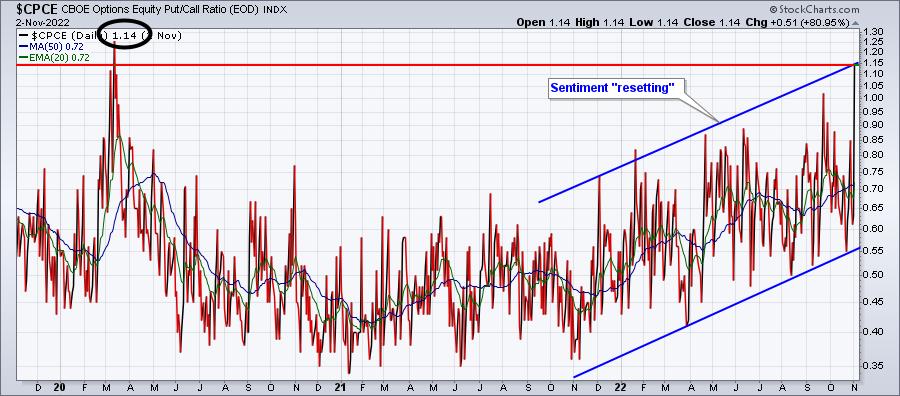
The 1.14 reading yesterday was the highest this year, by far, and it was the highest reading since the pandemic in March 2020. Retail options traders are jumping ALL OVER the puts, making it difficult to believe we'll sustain the near-term selling much long. Another favorite sentiment indicator of mine is the Volatility Index ($VIX), which uncharacteristically dropped on Thursday afternoon, while the stock market was selling off hard. Today, we're seeing similar action in the VIX. Check out this 5-day 10-minute chart:
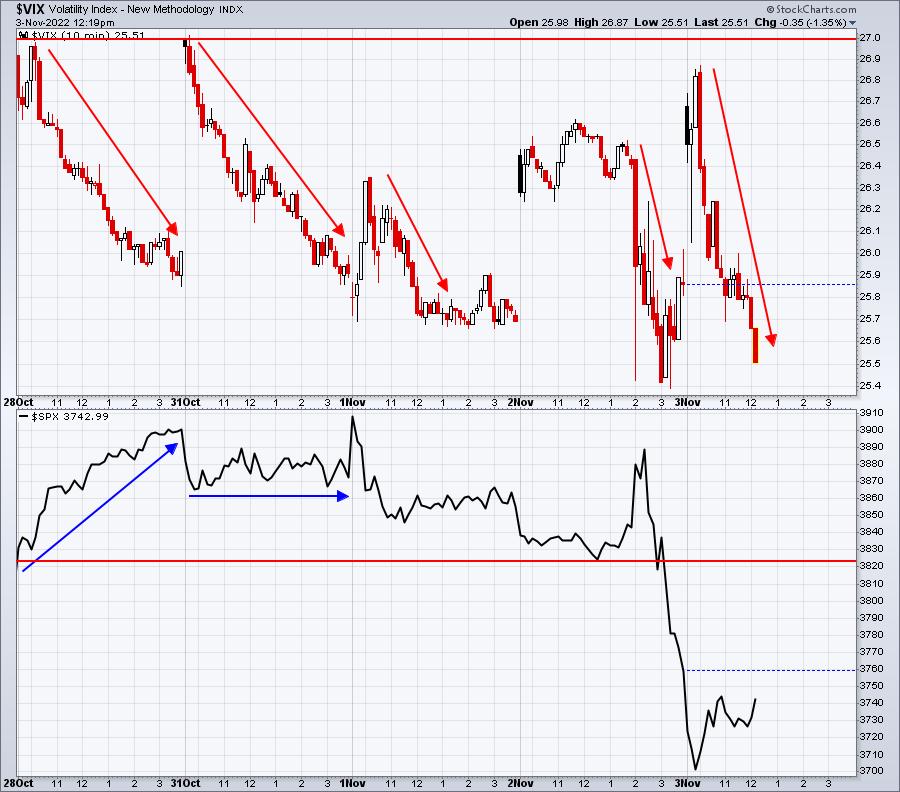
This makes VERY LITTLE sense. The VIX usually soars when impulsive selling kicks in - like we've seen since 2:30pm ET. Yet the VIX is almost at its 5-day low. Remember the VIX is priced based on the premiums on short-term S&P options. When the VIX comes down, it's because the stock market volatility is expected to decline. That ALMOST ALWAYS coincides with a rising market. So options are being priced cheaper, in anticipation of higher stock market prices, yet retail options traders are POURING into puts. This isn't going to end well for those buying puts - all in my humble opinion.
Sector/Industry Focus
Financials (XLF) have been strong, but do need to push through key downtrend line resistance. The same goes for materials (XLB). Check out these charts:
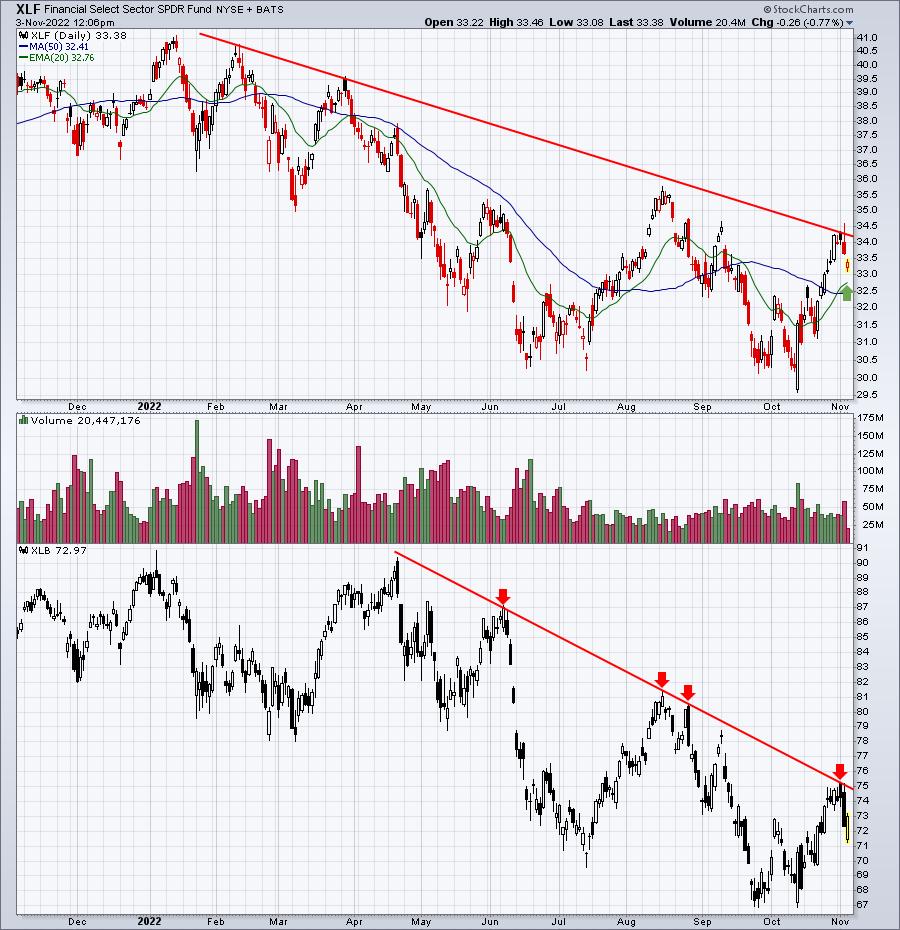
Both of these sectors have outperformed the S&P 500 over the past week, month, and three-month periods; however, neither has broken the downtrends by connecting highs in 2022. One big question for me is whether the XLF holds onto 20-day EMA support. Financials LOVE the fourth quarter, as I pointed out recently in the November Seasonality report, but they'll need a breakout of this downtrend line in order to post further gains.
ChartLists/Strategies
I believe it's prudent to remain quiet on the trading front. The LLY trade off the rising 20-day EMA was a solid one, but keep in mind it's in the more defensive health care sector (XLV), which offers up more conservative trades - to hopefully avoid the massive declines that we're seeing in many technology (XLK) and consumer discretionary (XLY) stocks. I'd focus individual stock trades on industrials (XLI), financials (XLF), and consumer staples (XLP), along with health care - for now.
Earnings Reports
Here are the key earnings reports for the next two days, featuring stocks with market caps of more than $10 billion. I also include several companies with market caps below $10 billion. Finally, any portfolio stocks that will be reporting results are highlighted in BOLD. If you decide to hold a stock into earnings, please understand the significant short-term risk that you are taking. Please be sure to check for earnings dates for any companies you own or are considering owning.
Thursday, November 3:
COP, AMGN, SBUX, CI, PAYPL, PBR, REGN, EOG, ZTS, CNQ, MRNA, ITUB, APD, ICE, MAR, FIS, MNST, TEAM, CTVA, SRE, MELI, LNG, BBD, BCE, MSI, JCI, ING, EXC, PH, CMI, MCHP, ILMN, SQ, ABC, ED, CQP, MTD, GOLD, K, DDOG, APTV, AVB, CTRA, AEE, PWR, EPAM, PODD, LYV, NET, QSR, PBA, AES, IEP, DASH, BALL, TRGP, VTR, EXPE, WPM, IRM, COIN, SWKS, BILL, TWLO, RKT, RCL, AER, WLK, PCTY, GDDY, AMH, REG, CE, H, HII, TEVA, WMS, RGA, SWCH, DBX, MUR, YNDX, EXAS, INGR, GIL, PENN, GH, LNTH, TPX, OLED, CROX, MTSI, SRCL, NTLA, W, APPN, SYNA, ATHM, BTU, UA, SPT, PTON, OUT, CVNA, LSPD, YELP, BHC, SHAK, KTB, GOGO, TDS, FTDR, MDRX, SWTX, SWI, NKLA, SPCE, IHRT, FNKO
Friday, November 4:
BRK/A, ENB, DUK, D, HSY, HMC, TU, CAH, PPL, MGA, WPC, OWL, EVRG, DKNG, CBOE, SJR, LAMR, HUN, SYNH, FLR, GTN, PRLB
Economic Reports
Initial jobless claims: 217,000 (actual) vs. 222,000 (estimate)
Q3 productivity: +0.3% (actual) vs. +0.5% (estimate)
September factory orders: +0.3% (actual) vs. +0.3% (estimate)
October ISM services: 54.4 (actual) vs. 55.4 (estimate)
FOMC meeting begins
Happy trading!
Tom