
EB Daily Market Report - Wednesday, November 9, 2022
ChartLists Updated
The following ChartLists have been updated and will be available for viewing/downloading later today or early tomorrow:
- Strong AD ChartList (SADCL)
- Raised Guidance ChartList (RGCL)
Executive Market Summary
- Futures were weak overnight and our major indices gapped lower
- There's been consistent selling throughout the day with the NASDAQ down more on a relative basis
- Cryptocurrencies are under significant selling pressure with etherium ($ETHUSD, -9.66%) and bitcoin ($BTCUSD, -8.37%) leading the selling again one day after a crypto massacre
- Commodities are mostly lower as crude oil ($WTIC, -3.53%) tumbles
- Energy (XLE, -4.64%) is the worst performing sector, though all 11 sectors are lower
- The 10-year treasury yield ($TNX) is up just one basis point as bond traders (and stock traders) await the latest inflation report; the October CPI report will be released tomorrow at 8:30am ET
- Walt Disney (DIS, -12.51%) reported its quarterly results and is today's worst performer in the S&P 500
Market Outlook
I've received questions recently, asking about my sustainability ratios. I did discuss these in my EB Weekly Portfolio Report on Sunday and they're no longer bullish. They've mostly broken down beneath the lows established in June and have been trending lower the past 4-6 weeks, despite the S&P 500 rallying. That tells me that IF the S&P 500 breaks beneath its earlier lows, these sustainability ratios support a further decline. We need to be aware of that and remain cautious as a result.
On Sunday, I highlighted these ratios over the past month. Here's what they look like on a 1-year chart:
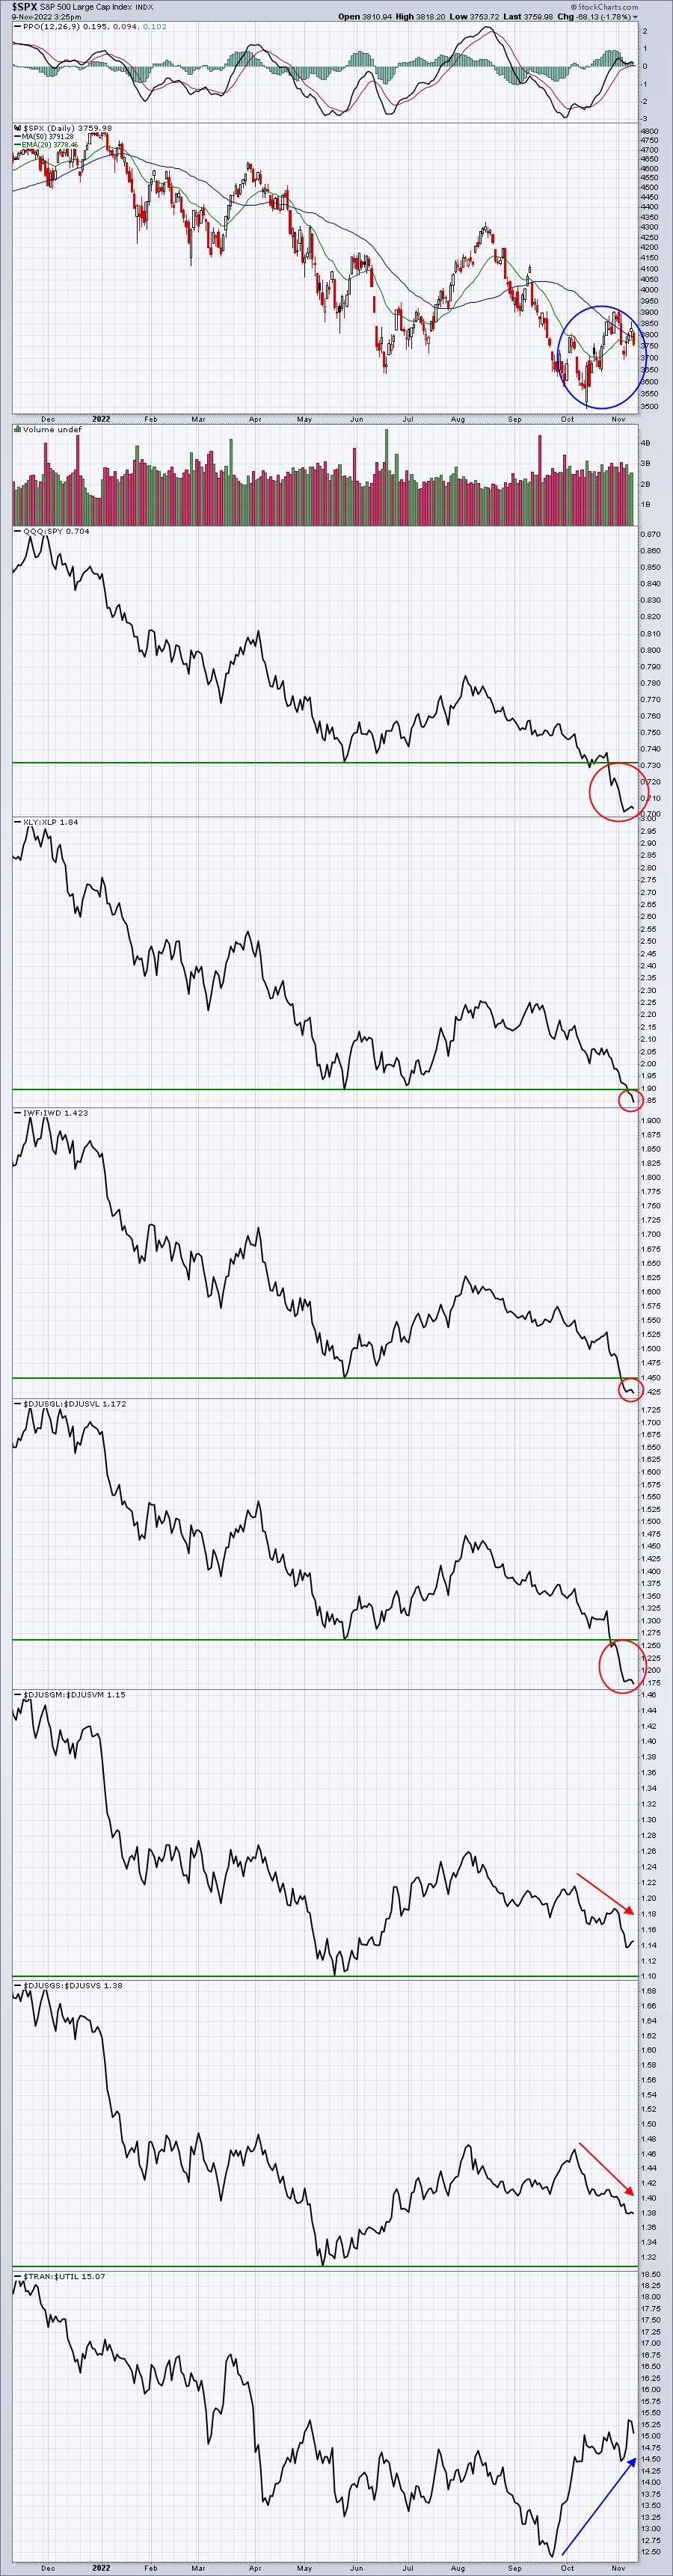
While the S&P 500 has performed fairly well since late-September, the rotation here speaks volumes about the market's unwillingness to accumulate those high risk areas.
Sector/Industry Focus
I'm ready to begin posting more bullish charts and a more bullish outlook, but the stock market isn't cooperating. Consumer discretionary (XLY), barring a big final hour rally, will close beneath its June low:
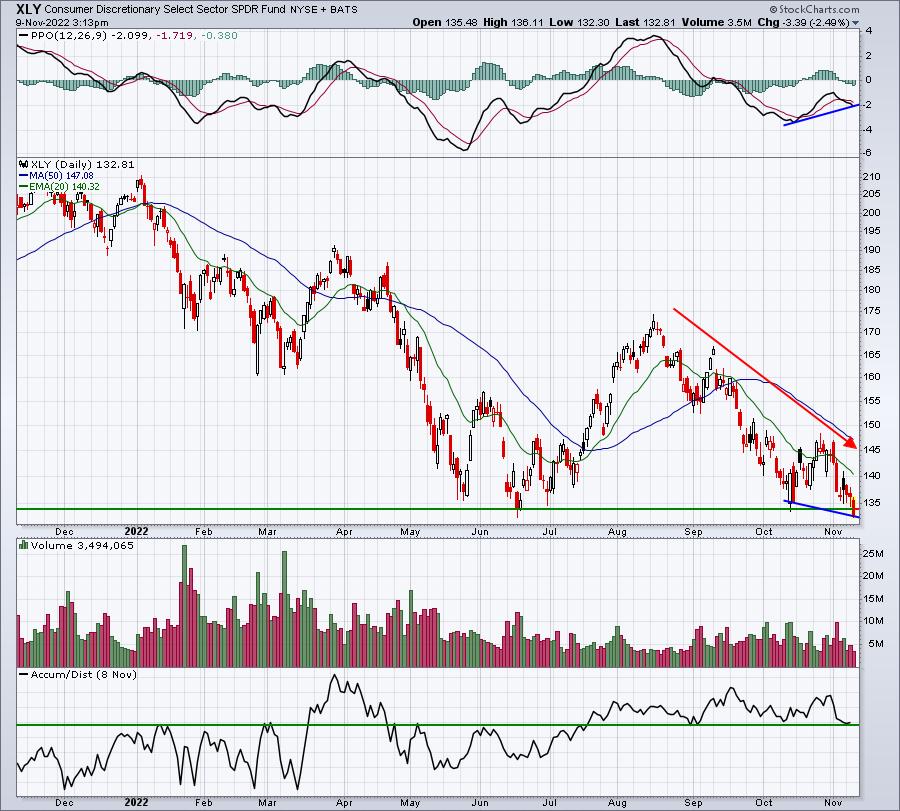
The bad news is that the XLY is on the verge of a price breakdown and that is my PRIMARY indicator - the combination of price/volume. Tesla (TSLA) is a big piece of the XLY and it's threatening to close beneath critical price support in the 184-185 range. Volume is heavy on TSLA. Both the XLY and TSLA have strong positive divergences and the XLY's AD line remains fairly strong (TSLA's is near its 52-week low). We do have mixed signals, but I ALWAYS respect price breakdowns until they're corrected.
ChartLists/Strategies
I think it makes sense to remain quiet on the trading front. If you're interested in trading, sticking with stocks in energy (XLE), health care (XLV), industrials (XLI), and financials (XLF) make the most sense.
Earnings Reports
Here are the key earnings reports for the next two days, featuring stocks with market caps of more than $10 billion. I also include several companies with market caps below $10 billion. Finally, any portfolio stocks that will be reporting results are highlighted in BOLD. If you decide to hold a stock into earnings, please understand the significant short-term risk that you are taking. Please be sure to check for earnings dates for any companies you own or are considering owning.
Wednesday, November 9:
TRP, HMC, MFC, RIVN, DHI, RBLX, RCI, TTD, BGNE, GIB, CRBG, ICL, FICO, UHAL, TPG, WYNN, PFGC, U, CPRI, CELH, WEN, TGNA, VET, SEAS, MQ, LPL, BMBL, HL, RNG, HBI, NUVA, VZIO, ZIP, CPRX, CGC, APPS, VCEL, RXT, FVRR
Thursday, November 10:
AZN, BAM, GDX, ITUB, TDG, MT, NIO, TOST, WRK, SWCH, TPR, RL, XRAY, DDS, DUOL, YETI, UTZ, SBH
Economic Reports
None
Happy trading!
Tom