
EB Daily Market Report - Thursday, November 10, 2022
Fall Special
Our annual Fall Special will begin this weekend. We have these specials to save you a TON of money over the long haul. It's also to thank you for your ongoing support. We've added a lot of features over the years and it's because of the support we get from our members.
Be sure to check out our special this weekend and a GREAT BIG THANK YOU to all of you!
Executive Market Summary
- Futures were up slightly, but everyone was waiting on this morning's October CPI report
- Inflation was reported much lower than anticipated at both the headline and core levels and futures SOARED
- Our major indices have been tacking on further gains throughout the session and the NASDAQ is leading, up nearly 6%
- The Volatility Index ($VIX) is down more than 10% to 23.45, its lowest reading since early September
- The S&P 500 is trading at 3917, just above that key 3900 level; a close above should be viewed quite bullishly
- Meanwhile, traders are POURING into treasuries, with the 10-year treasury yield ($TNX) falling 30 basis points (!!!) to 3.85%
- Commodities are higher across the board, with crude oil ($WTIC, +1.37%) back above $87 per barrel
- All 11 sectors are up at least 1% with technology (XLK, +6.66%) and consumer discretionary (XLY, +6.54%) leading
- Semiconductors ($DJUSSC, +8.57%) and software ($DJUSSW, +7.39%) are exploding with the big drop in treasury yields
Market Outlook
While it was nearly impossible to be overly aggressive heading into this morning's CPI report, because of the downside risk of a hot report, today's massive rally also highlights why I've said since June that the risk of being in cash or short outweighs the risk of being long. It's not about being right or wrong, it's about managing risk. It's why I've said that I would remain invested in the QQQ, with more aggressive leveraged trading of the QLD when circumstances dictate. I've moved to a more leveraged position today with the QQQ's break above the 20-day EMA. I will add if we test the rising 20-day EMA and I'll exit the leverage if that moving average doesn't hold as support.
Check out the current QQQ chart:
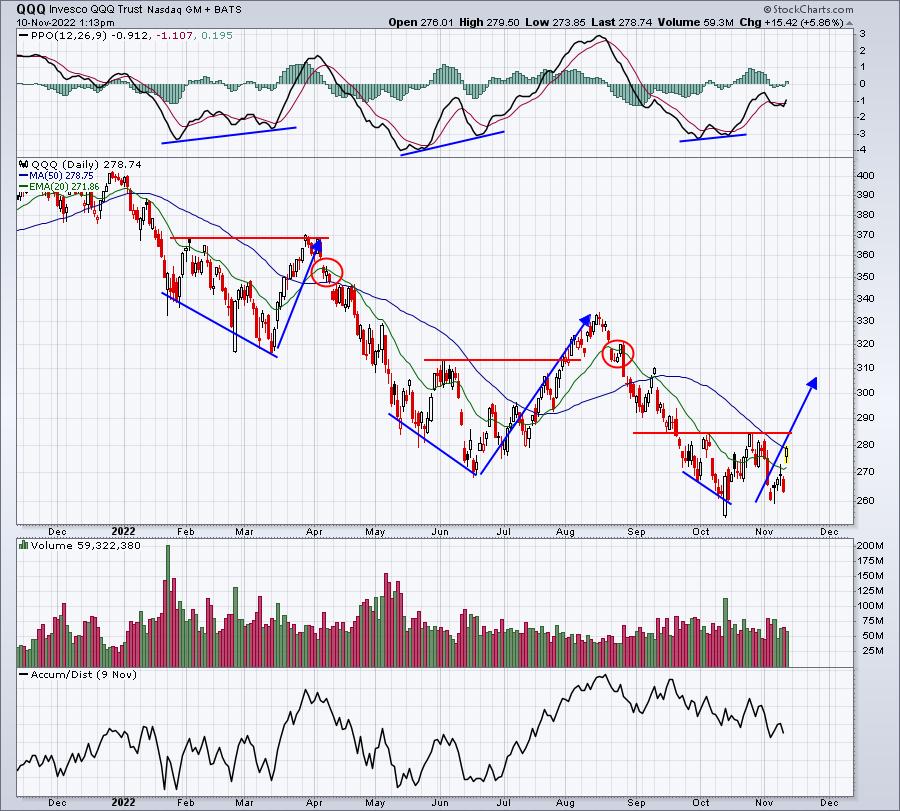
I believe 285 price resistance will be difficult as it represents a neckline in a potential bottoming head & shoulders pattern. If we can move straight through that level without a hiccup, then we could be starting a MAJOR advance into year end. I've been bullish, waiting for confirmation of a new secular bull market advance. Lower treasury yields, if they hold, would be a serious confirmation. The QQQ was hit hard as rates rose, but falling rates would send growth stock valuations soaring. This was something I discussed at the very beginning of the year and it could be starting now.
Could this be a head fake? Of course. Anything is possible. But I've been patiently awaiting a bullish outcome, believing all along that this is a cyclical bear market, not secular. I'm approaching this positive fundamental news and technical breakout as the start of a bullish end to the year. If I'm wrong, I'll adjust. If you need to know one thing about me, it's that I have convictions about market tops and bottoms. I'll be wrong sometimes, but constantly wavering doesn't serve me well.
Sector/Industry Focus
It's nice to see semiconductors ($DJUSSC) acting so bullishly of late - they're having another really big day. Software ($DJUSSW) and internet ($DJUSNS), however, have not shown many bullish signs of late. Today, that could be changing. Check out these three. If the stock market truly is set to explode, these three need to show leadership:
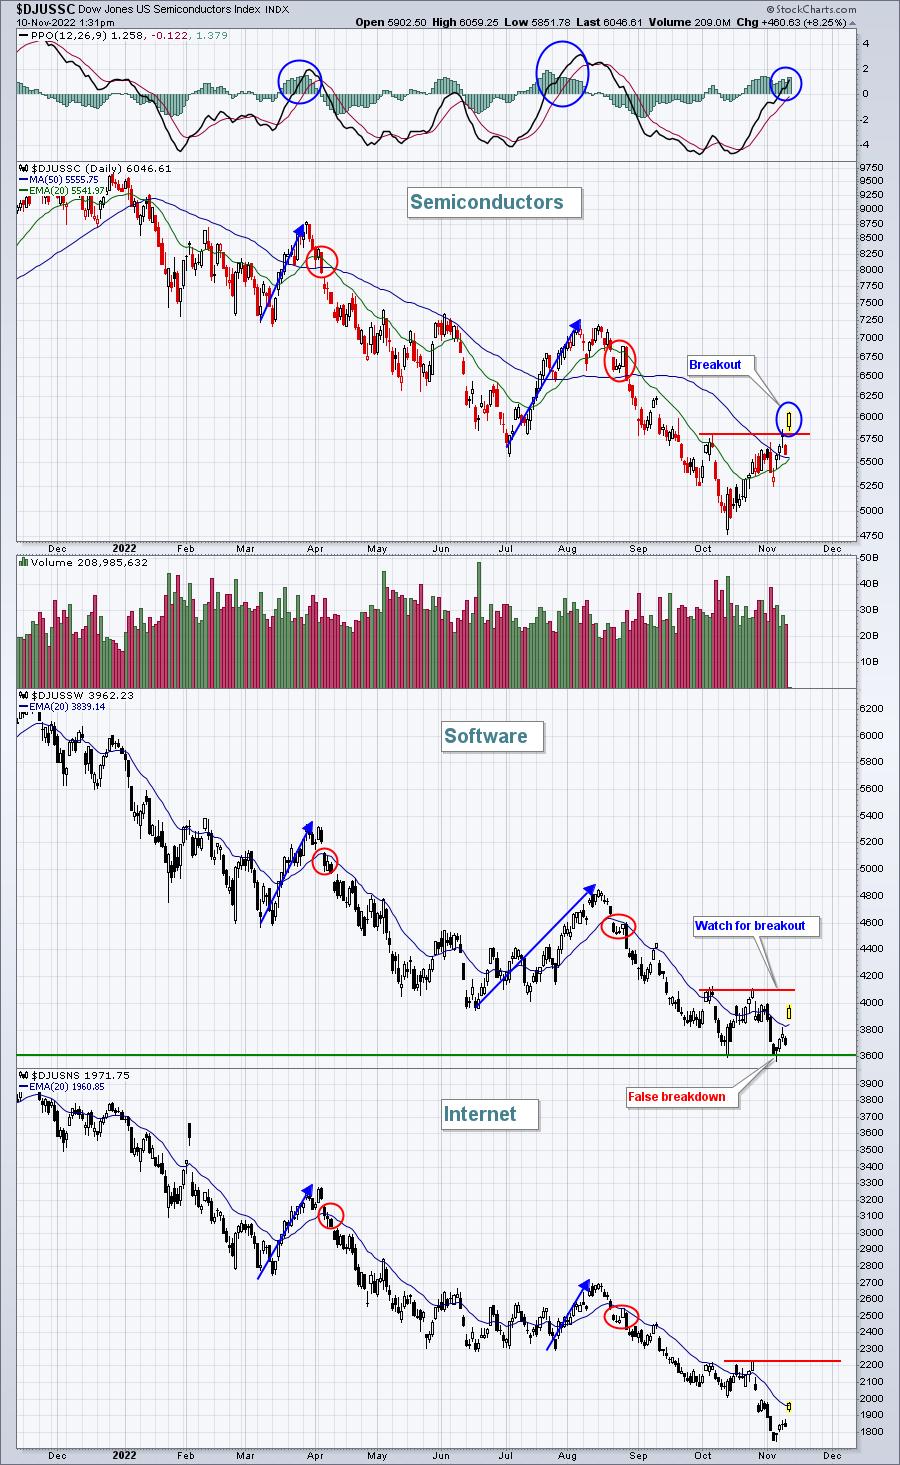
Semis look awesome. Software is improving significantly. Internet still looks very weak, but a close today above the 20-day EMA will at least provide some short-term hope.
Seasonality also tells us to have patience with respect to internet stocks. The DJUSNS has gained more than 300% over the past 10 years, but the group definitely prefers the January to August period vs. the September to December period. Check out this seasonality chart:
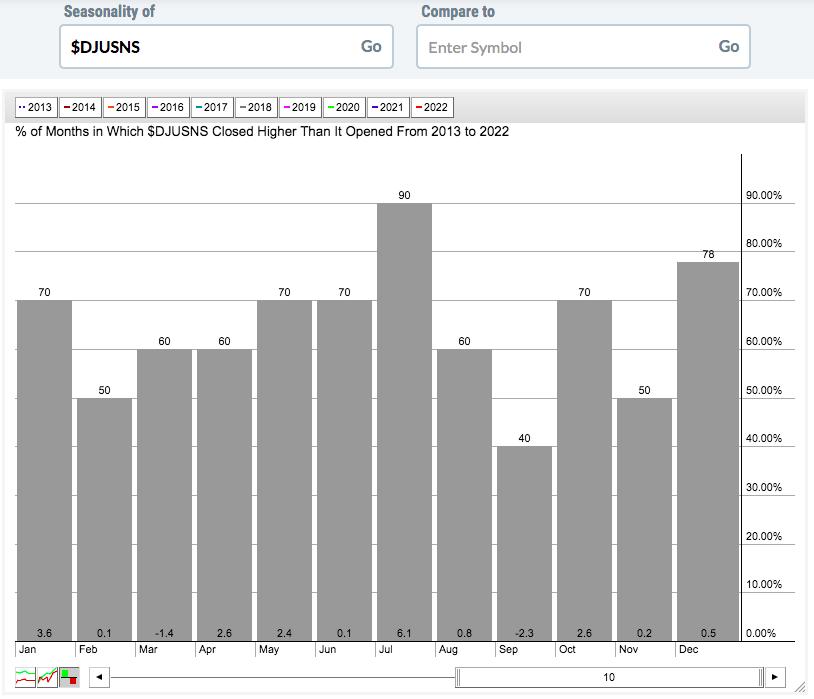
If you add the average monthly returns at the bottom of each monthly bar, we can break down performance by the two periods mentioned above:
- January through August: +14.3%
- September through December: +1.0%
Let's give the internet stocks a bit more time to get healthy longer-term, but a short-term advance would certainly be welcome.
ChartLists/Strategies
Our trading strategies will be changing. The October CPI inflation numbers were better than expected, rates are tumbling, and aggressive stocks are suddenly back in charge. The falling VIX was telling us that the selling was not likely to last, but money continued to rotate away from the most aggressive areas of the market. We had to respect price action, regardless of other signals. Being overly aggressive heading into the report was difficult, because we have a pretty good sense of what might have happened had the CPI printed a really hot number.
But now, we will not have another Fed meeting until December 13-14 - that's five weeks away. The November CPI will not be released until Tuesday, December 13. I expect that, based on this morning's good news, we'll likely trend higher. Of course, things could change by today's close as we know the market has its own ideas of where it's heading. I want to see a strong close, not just a big gap up and waffling.
Because of this change in market conditions, we'll be working hard to update our ChartLists as quickly as possible. I hope to have several updated between now and the weekend. In the meantime, I'll be looking for growth stocks that are showing leadership, have broken back above 20-day EMAs, and show signs of accumulation (solid AD lines). Buying tests of 20-day EMAs will be a big part of my individual stock trading strategy. Here are two stocks that are showing excellent short-term strength now that I'll be looking at for potential trades on any weakness:
ESTC:
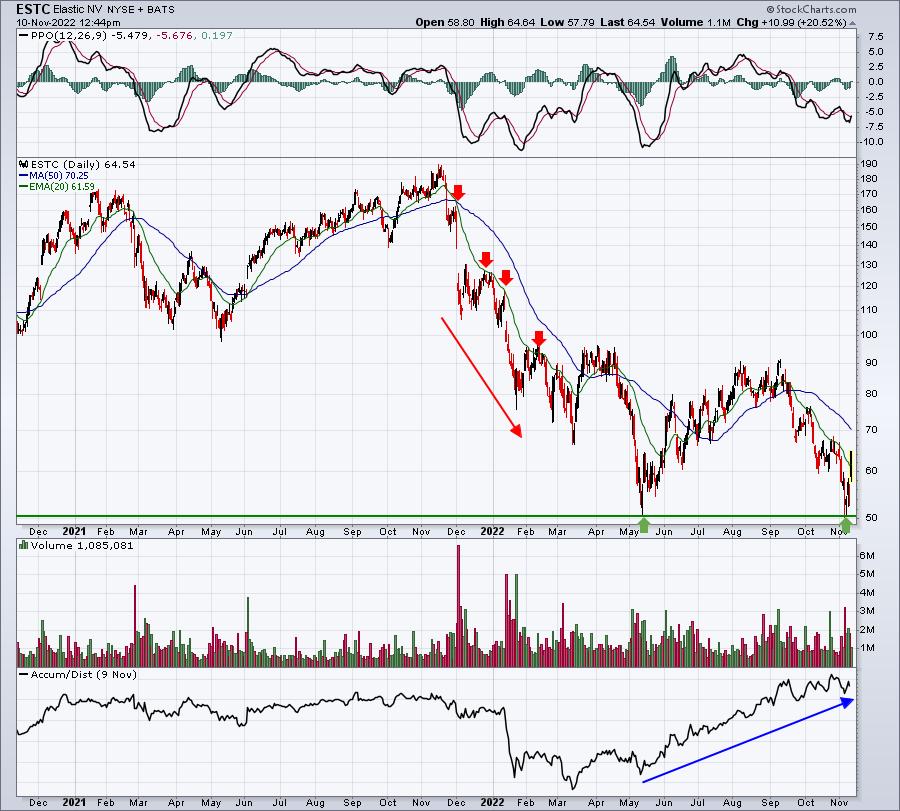
I'm looking for "character changes" on charts. Stocks that downtrend tend to fail at 20-day EMA resistance. Check out the first half of 2022 on the ESTC chart for a perfect illustration. When we begin uptrending, we should break above the 20-day EMA, and then hold that moving average as support on ensuing profit taking.
VEEV:
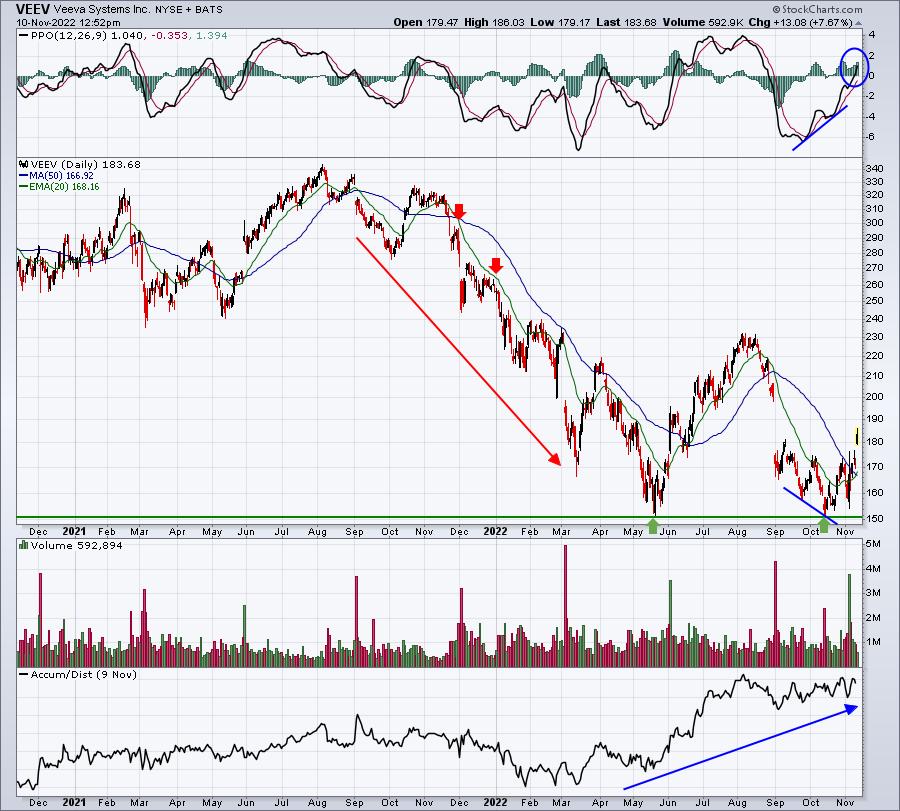
The positive divergence here, along with today's breakout, really sets VEEV up as a potential winner in the weeks and months ahead. The AD line certainly suggests that we may have seen tremendous manipulation in VEEV in 2022. I expect to see a continuing uptrend in VEEV and I'd be a buyer on inevitable weakness that later tests its rising 20-day EMA.
A third stock looking to move higher is Etsy, Inc. (ETSY), which is in the consumer discretionary area. It's broken back above both its 20-day EMA and 50-day SMA and its AD line has been very strong since the June low.
Earnings Reports
Here are the key earnings reports for the next two days, featuring stocks with market caps of more than $10 billion. I also include several companies with market caps below $10 billion. Finally, any portfolio stocks that will be reporting results are highlighted in BOLD. If you decide to hold a stock into earnings, please understand the significant short-term risk that you are taking. Please be sure to check for earnings dates for any companies you own or are considering owning.
Thursday, November 10:
AZN, BAM, GDX, ITUB, TDG, MT, NIO, TOST, WRK, SWCH, TPR, RL, XRAY, DDS, DUOL, YETI, UTZ, SBH
Friday, November 11:
SJR, ERJ
Economic Reports
October CPI: +0.4% (actual) vs. +0.7% (estimate)
October Core CPI: +0.3% (actual) vs. +0.5% (estimate)
Happy trading!
Tom