
EB Daily Market Report - Friday, November 11, 2022
Fall Special
Our annual Fall Special will begin TOMORROW. We have these specials to save you a TON of money over the long haul. It's also to thank you for your ongoing support. We've added a lot of features over the years and it's because of the support we get from our members.
Be sure to check out our special this weekend and a GREAT BIG THANK YOU to all of you!
Executive Market Summary
- Futures were higher overnight and our major indices got off to another bullish start
- Money has rotated in a big way towards NASDAQ stocks and away from Dow Jones stocks over the past two days
- The bond market is closed today in observance of Veterans Day
- Energy (XLE, +3.31%) is today's best performing sector as crude oil ($WTIC, +3.15%) jumps above $89 per barrel
- The aggressive sectors are performing very well with communication services (XLC, +2.69%) leading the way
- Broadcasting & entertainment ($DJUSBC, +4.81) is helping to lift the XLC
- Footwear ($DJUSFT, +6.22%) is having its second consecutive HUGE day as Nike (NKE, +7.09%) is the best performer in the Dow Jones
- Health care (XLV, -1.32%) and utilities (XLU, -1.23$) - two defensive sectors - were the only sectors in negative territory
Market Outlook
I've had several questions about my sustainability ratios. Mostly they center around their recent breakdowns and why isn't the S&P 500 likely to follow their lead lower? Ok, the first thing that needs to be understood is that the price/volume combination of the S&P 500 is THE MOST IMPORTANT indicator. It's a PRIMARY indicator. Sustainability ratios are SECONDARY indicators, just like the PPO, RSI, relative strength, etc. When the S&P 500 broke out in January 2022 to new all-time highs, the secondary indicators did not confirm the breakout. It didn't guarantee us that the rally would fail. Instead, it simply waved a red flag. It was all the other red flags at the time that, when aggregated, suggested the market was too risky to stay long.
When I called the bottom on the S&P 500 in June, I did so for a number of reasons. One was the sustainability ratios turning higher and not moving to new lows along with the S&P 500. But there were other signals, especially the sentiment signals as we finally saw the 5-day moving average of the equity-only put-call ratio ($CPCE) hit that key .75-.80 threshold.
Now let's fast forward to the recent breakdown in many of the sustainability ratios. Remember, these are secondary indicators. Did the S&P 500 break down beneath prior lows? No. That is our PRIMARY indicator. Had the S&P 500 broken down, then the weak sustainability ratios would have confirmed the breakdown. You need to be careful about making calls based solely on secondary indicators alone. Just because the RSI is overbought doesn't mean the market will fall. Overbought can remain overbought. The RSI is a secondary indicator. Not all positive and negative divergences on the PPO work. The PPO is a secondary indicator.
I hope this helps to clarify how I use these ratios. They confirm or refute the S&P 500 price action - either breakouts or breakdowns.
Sector/Industry Focus
I'm not at all surprised to see money rotating into other sectors. Industrials (XLI) has had quite a run and it now at key price resistance. I believe it'll eventually break through, but it certainly could take time to pause for a bit:
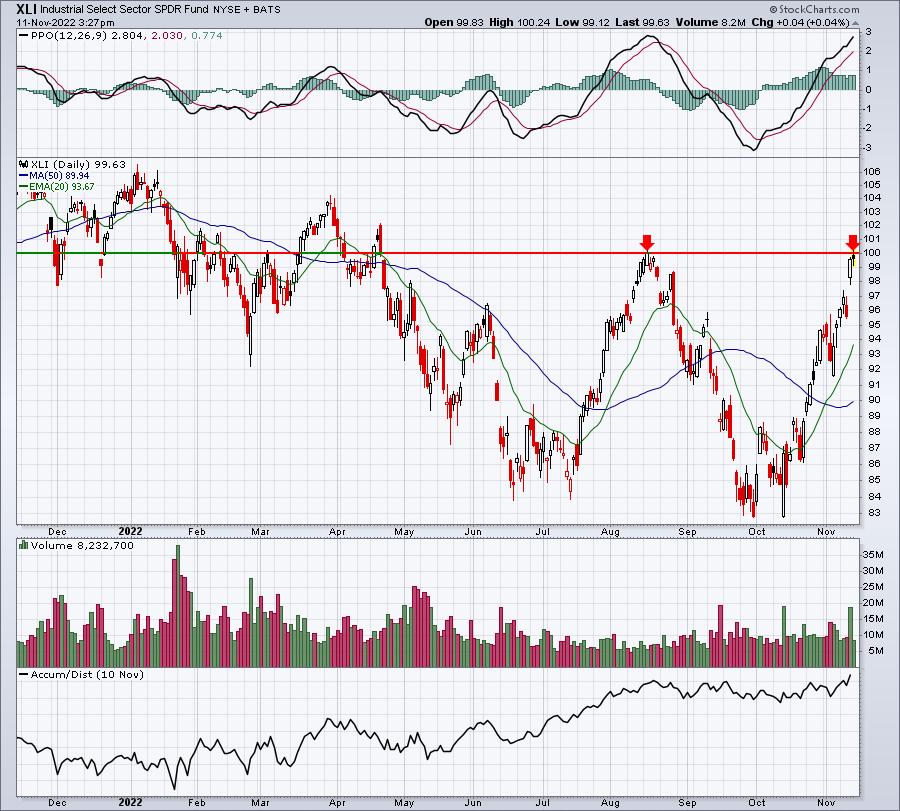
I love the breakout in the AD line to a new high. If price can do the same above 100, then I'd expect further strength from this group.
ChartLists/Strategies
When you have a Strong Earnings ChartList (SECL) with over 300 stocks on it, there will be pullbacks to set up high reward to low risk trades. Here is a perfect example of a stock that I currently have on my radar:
GWW:
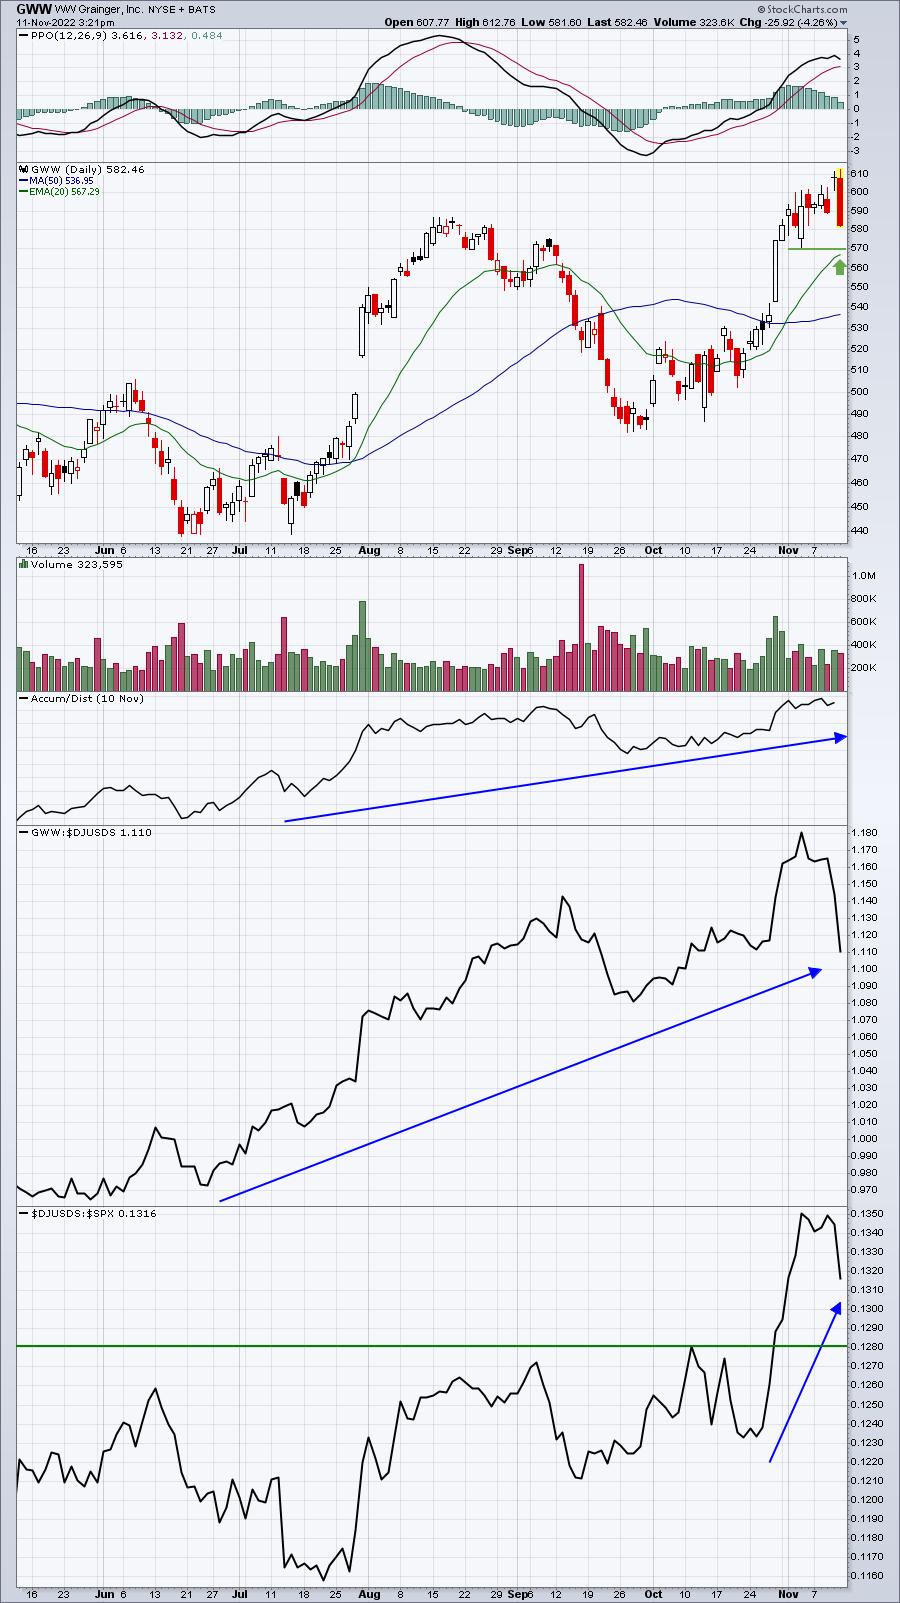
GWW is an excellent absolute and relative performer, but it's having a poor day today. This happens all the time. It's a good idea to peruse the Strong Earnings ChartList and have your handpicked stocks ready to pounce on should they reach a key support level. GWW recently bounced after it touched 570. Note that the rising 20-day EMA is also rising and is close to that 570 level as well. That provides me the confidence I need to place the trade IF GWW trades down to this level.
Earnings Reports
Here are the key earnings reports for the next two days, featuring stocks with market caps of more than $10 billion. I also include several companies with market caps below $10 billion. Finally, any portfolio stocks that will be reporting results are highlighted in BOLD. If you decide to hold a stock into earnings, please understand the significant short-term risk that you are taking. Please be sure to check for earnings dates for any companies you own or are considering owning.
Friday, November 11:
SJR, ERJ
Monday, November 14:
TSN, NU, ACM, XRAY, TSEM, OTLY
Economic Reports
November consumer sentiment: 54.7 (actual) vs. 59.6 (estimate)
Happy trading!
Tom