
EB Daily Market Report - Monday, November 14, 2022
Fall Special
Our annual Fall Special has begun and is off to a GREAT start! We have this special to help save you a TON of money over the long haul. It's also to thank you so much for your ongoing support. We've added a lot of features over the years and it's because of the continuing support we get from our members.
You can get more information HERE. On behalf of our entire EarningsBeats.com team, I want to say a GREAT BIG THANK YOU to all of you for supporting us!
Executive Market Summary
- Futures were down slightly to begin a new trading week
- Cryptocurrencies are trying to stabilize after a brutal couple weeks
- Commodities are mixed, though crude oil ($WTIC, -3.50%) is having a particularly rough day
- The 10-year treasury yield ($TNX) is bouncing and higher by 5 basis points to 3.87% after a huge drop late last week
- Health care (XLV, +1.16%) leads among sectors, while real estate (XLRE, -1.19%) is the only group to lose more than 1%
- Pharmaceuticals ($DJUSPR, +2.51%) are bouncing back strongly after significant weakness on Friday
- The Dow Jones is the best-performing of our major indices, led by Merck (MRK, +3.69%) and Johnson & Johnson (JNJ, +2.22%), two health care stocks
- Moderna (MRNA, +6.43%), another health care stock, leads the S&P 500 higher; Etsy, Inc. (ETSY, +5.34%) and Netflix (NFLX, +4.64%) are among the S&P 500 leaders as well
Market Outlook
I addressed many questions about my sustainability ratios and their poor performance recently in the DMR on Friday. I also took the time to address it further during this morning's Trading Places Live show. If you still have questions, please be sure to check out the recording on YouTube. I discuss most of it around the 25 minute mark, from what I recall.
On to the market. Well, we're seeing a bit of profit taking in technology (XLK) area, and Friday's weakest group - health care (XLV) - is leading today. Overall, I'm impressed we're mostly holding those outsized gains from late last week. The table has turned on the bears, at least temporarily, as we've now seen a "golden cross" on the S&P 500 with price action above the 20-day EMA, which is now above the 50-day SMA. This is a bullish short-term configuration, which now aligns with the long-term secular bull market that I believe we remain in and will enjoy for the next several years. Here's the current S&P 500 chart:
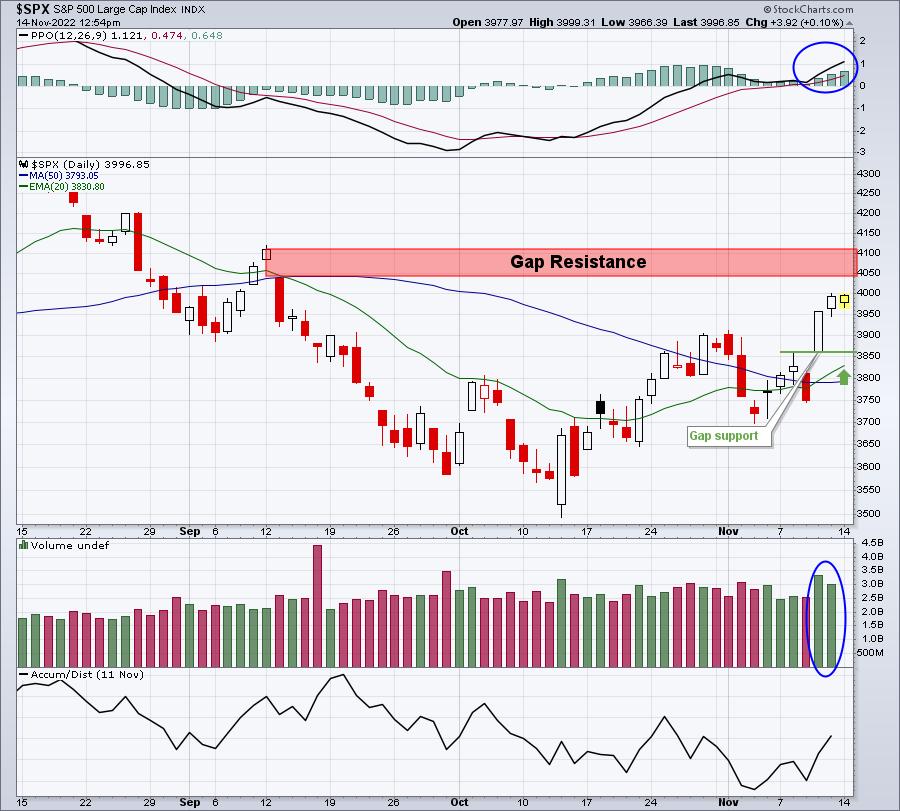
I'm approaching and trading the stock market now based on my belief that the 2022 bear market has ended. I will buy pullbacks, especially those testing the rising 20-day EMA, and I'll also consider longer holding periods to allow my positions to run. For now, I'm sticking mostly with the QQQ, but I'll buy more individual stocks when I can manage my reward to risk effectively. It doesn't mean I'll blindly chase stocks because they're going up. During secular bull market advances, my favorite trades involve leading stocks in leading industry groups that pull back to test price and/or moving average support.
Sector/Industry Focus
Later this week, we'll receive a SLEW of economic reports with respect to housing. Here's the list and expectations:
- November housing market index (Wednesday): 36 (estimate)
- October housing starts (Thursday): 1,410,000 units (estimate)
- October building permits (Thursday): 1,516,000 units (estimate)
- October existing home sales (Friday): 4,360,000 units (estimate)
One sign that a bottom is in occurs when we receive bad fundamental news and we see a positive market reaction. Remember, the stock market looks AHEAD. It is not worried about what's in the rear view mirror. Economic reports tell us what happened last month or the month before. You need to be aware of a couple things regarding homebuilding/home construction. The first is seasonality. I've heard many folks say, "the stock market makes no sense." There's a lot of truth to that statement and the historical performance of housing-related stocks is probably high on the list. Check out the seasonality of the home construction index ($DJUSHB):
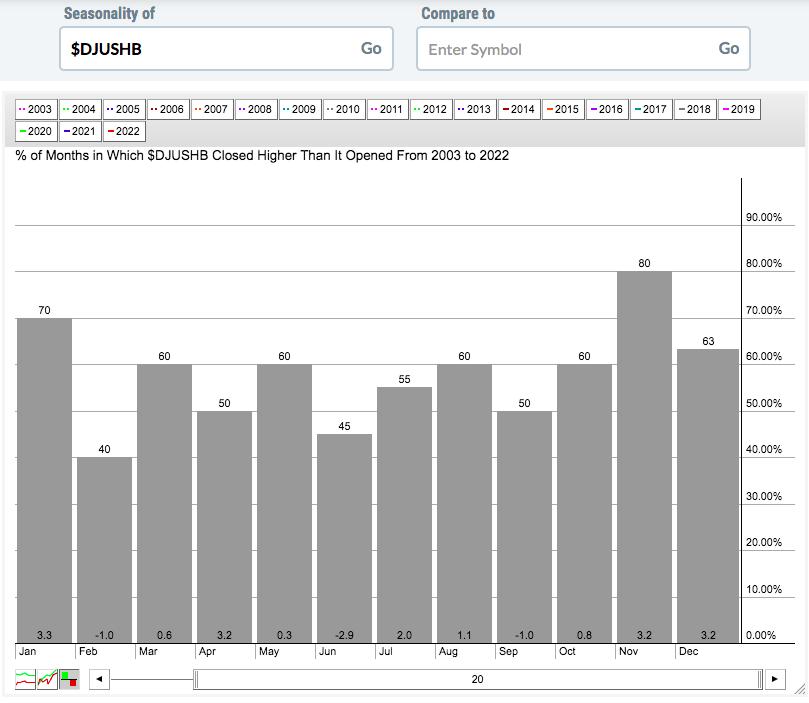
Over the past 20 years, the DJUSHB has produced an average return as follows during the two periods identified:
- November through April: +12.5%
- May through October: +0.3%
I arrived at these percentages by simply adding the average monthly returns of each calendar month within the periods provided. It's noteworthy that November, December, and January - three of the coldest months of the year in the U.S. - have produced average monthly gains of 3.2%, 3.2%, and 3.3%, respectively. Who would think, from a common sense standpoint, that the best time to load up on home construction stocks would be November 1st? But that's the actual history this century of home construction performance.
Now that we understand history, let's look at the technical picture of the DJUSHB:
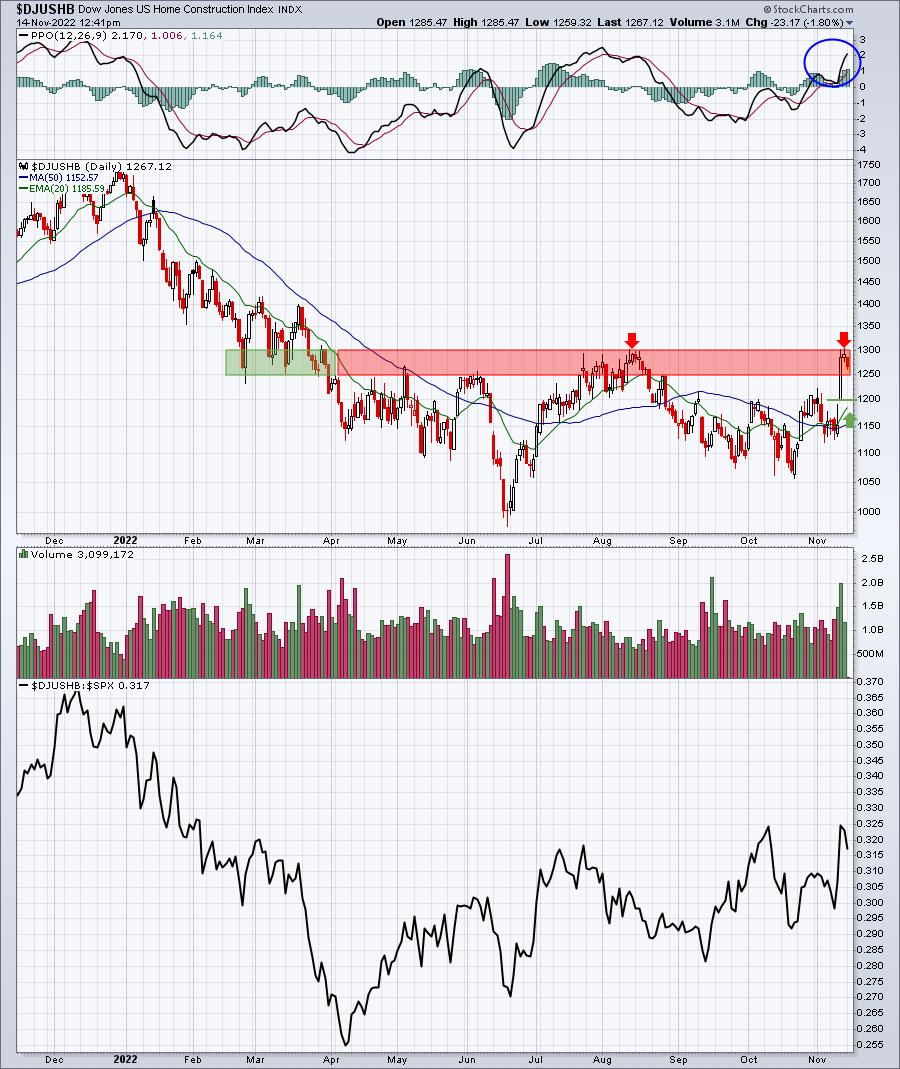
Most will make assumptions about the stock market based upon the news that we receive. I will, on the other hand, be watching the above chart. The current trading range on the DJUSHB is from 1200-1300, though I'm also watching the rising 20-day EMA, currently at 1185. History and technical conditions are both pointing to a breakout - potentially in the midst of bad economic news within the industry. It may make no sense at all, but it's how the stock market works.
ChartLists/Strategies
I've updated most of our ChartLists and they've also been updated on our website and available for viewing/download. I'm working on our Earnings Reaction ChartList, which summarizes dozens of stocks that have soared from the opening bell to the closing bell the day after it reported results. These hollow candles indicate that there were PLENTY of buyers throughout the trading day and could set up for nice trades on pullbacks. In developing this list, I am considering AD lines, giving strong preference to those stocks that appear to be under accumulation, and also relative strength. If a stock has one nice day of buying after its earnings report, but consistently is dropping in relative strength among its industry peers, I'm not going to include it on this ChartList. Also I'll filter out stocks with low volume and prices beneath $5.
I'm hoping to have this ChartList available for everyone tomorrow. It may have to wait until Wednesday, however, because tomorrow is our Max Pain event.
Earnings Reports
Here are the key earnings reports for the next two days, featuring stocks with market caps of more than $10 billion. I also include several companies with market caps below $10 billion. Finally, any portfolio stocks that will be reporting results are highlighted in BOLD. If you decide to hold a stock into earnings, please understand the significant short-term risk that you are taking. Please be sure to check for earnings dates for any companies you own or are considering owning.
Monday, November 14:
TSN, NU, ACM, XRAY, TSEM, OTLY
Tuesday, November 15:
WMT, HD, SE, AAP, ARMK, BERY, TME, DNUT, ENR
Economic Reports
None
Happy trading!
Tom