
EB Daily Market Report - Wednesday, November 23, 2022
Holiday Schedule
Happy Thanksgiving!!! Please be safe this weekend, especially if you're traveling.
There will be no Daily Market Report on Friday as it's an abbreviated trading session with the stock market closing early at 1pm ET. We'll be back with our regular schedule on Monday, November 28th.
Fall Special
We are closing in on the end (Sunday, November 27th) of our Fall Special - our absolute BEST DEAL of the year. If you haven't already taken advantage of the HUGE savings, be sure to CLICK HERE and do so. It's our way of saying THANK YOU for your loyalty and support.
Executive Market Summary
- Futures were relatively flat overnight, though we did see a bit of relative strength in the NASDAQ
- New home sales were much stronger than expecting, prompting nice action in home construction ($DJUSHB), but we're still awaiting a technical breakout above 1300
- Initial jobless claims jumped to 240,000; that, along with a rapidly-declining PMI composite sent traders flocking to bonds as the 10-year treasury yield ($TNX) fell below 3.70% temporarily
- Crude oil ($WTIC, -4.26%) is being slammed, falling back to $77.50 per barrel; meanwhile, natural gas ($NATGAS) has spiked to a 2+ month high
- Energy (XLE, -1.75%) is today's weakest sector, while consumer discretionary (XLY, +0.78%) leads all sectors
- Automobiles ($DJUSAU, +3.79%) are finally showing strength as Tesla (TSLA, +5.20%) rebounds
- Deere & Co, Inc. (DE, +5.56%) posted strong quarterly results and is testing its all-time high set in April 2022
Market Outlook
I have no idea what's been happening in the options world. The 5-day moving average of the equity-only put-call ratio ($CPCE) is currently at .95, which is a very rare and extreme reading that's usually associated with a massive stock market selloff. On Wednesday, November 16th, the CPCE reading was 1.46 - the highest one-day reading EVER. The S&P 500 was down that day, but by less than 1%, which did not warrant any type of panicked action in options. Yesterday's reading was 1.35, the second highest reading EVER, and the S&P 500 closed up nearly 1.4%.
I will NOT blindly follow numbers that make no common sense. Therefore, I am not paying attention to this sentiment indicator currently. And remember, THE #1 indicator is the combination of price and volume. While the NASDAQ appears to have further room to upside resistance, both the Dow Jones and S&P 500 are testing key price resistance, as can be seen on the chart below:
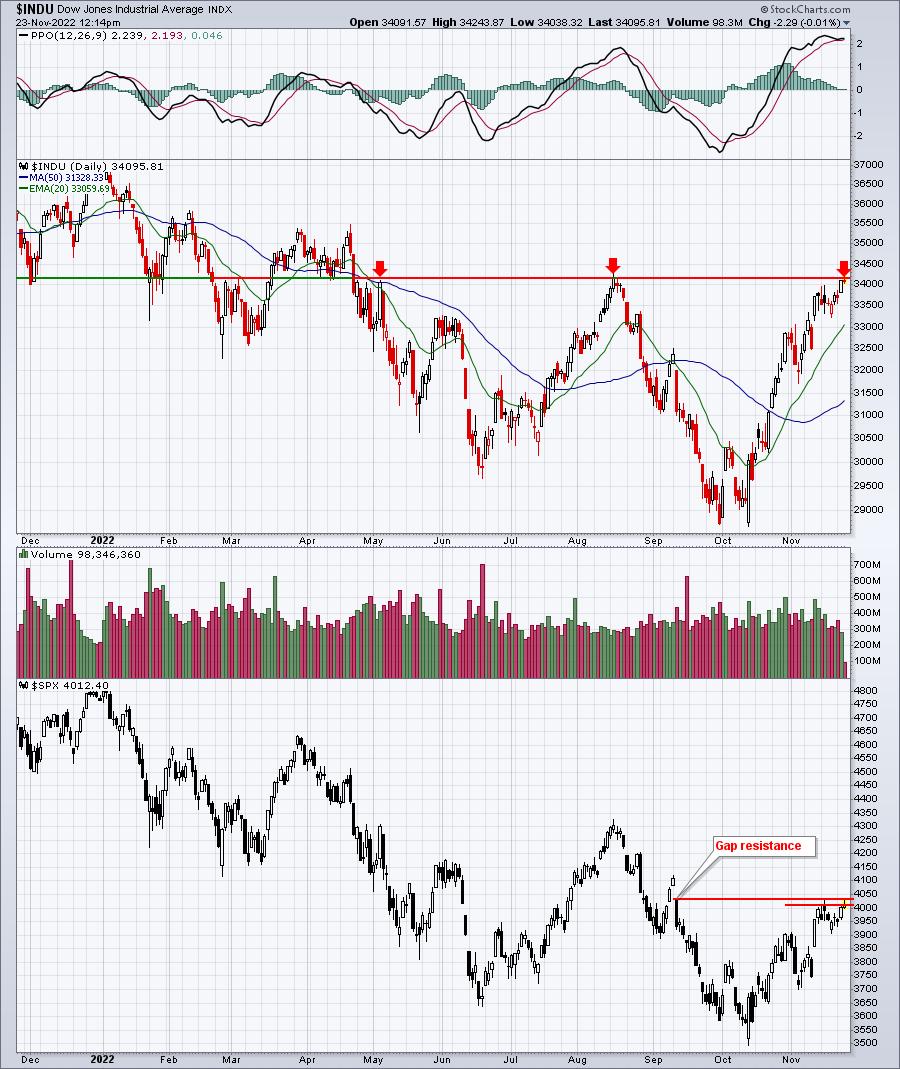
An extreme bearish reading on the CPCE makes absolutely no sense right now - not while 2 of our major indices are trending higher. I cannot think of any reason why so many equity puts would be traded right now, so again, I'm ignoring these readings until they show some semblance of sense.
Sector/Industry Focus
Walt Disney's (DIS, +1.92%) recent resurgence has helped to light a fire under broadcasting & entertainment stocks ($DJUSBC). There's still a TON of technical work to do, but we're threatening a short-term breakout in the group:
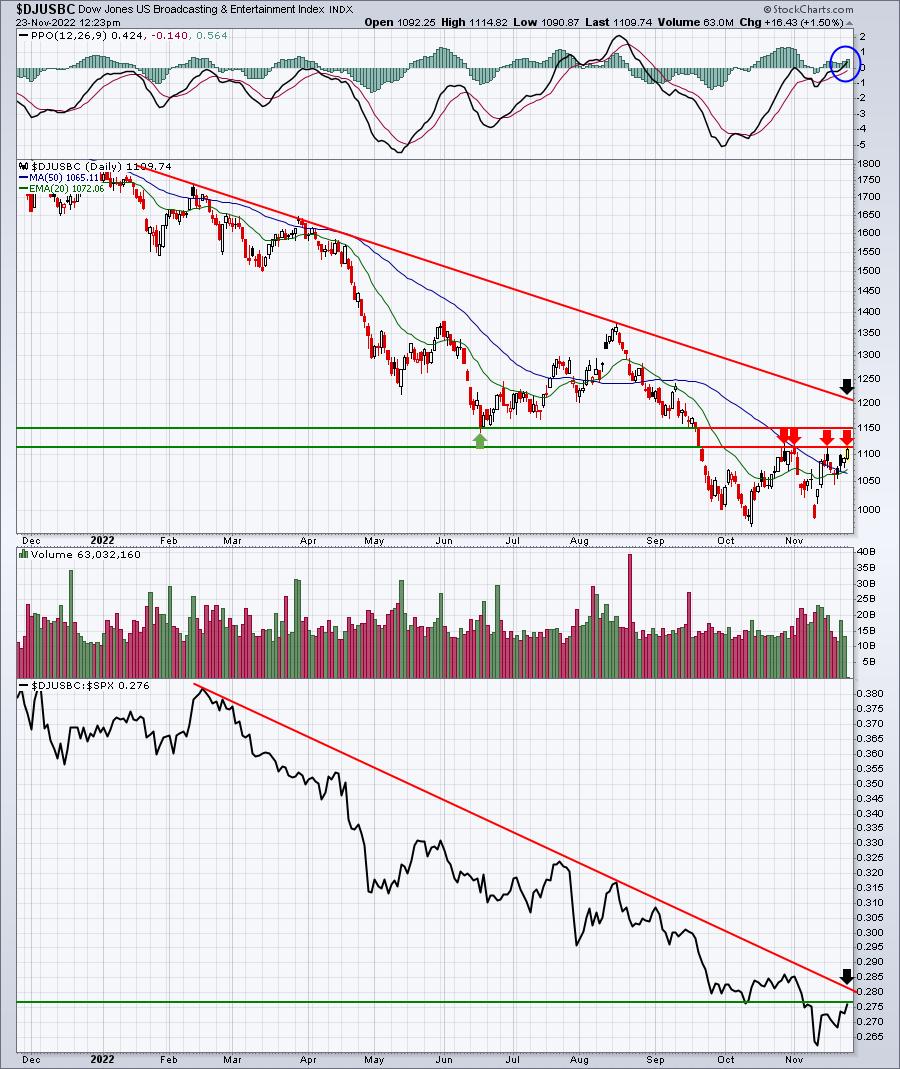
The first step to technical health is clearing the 1110-1115 level. That would then set up another critical price resistance test closer to 1150. The black arrows mark what I feel is MUCH bigger long-term resistance from both absolute and relative price perspectives.
ChartLists/Strategies
I ran our Downtrend Reversal scan against our Strong Earnings ChartList (SECL) and 10 stocks were returned. These are stocks that had printed lower daily highs for AT LEAST the past 5 trading sessions, but today have printed a higher high. It could be a signal of the beginning of an uptrend. I usually look at the individual daily charts to see if I like them technically. If so, I'd consider taking a position. The 10 stocks returned were as follows, in SCTR order:
- MNSO (97.5) - still overbought, would like closer to 20-day EMA
- NFLX (91.7) - testing 20-day EMA (Full Disclosure: Bought and will exit on any close below 20-day EMA)
- PHR (76.5) - don't like chart, sideways consolidating
- WOLF (54.8) - possible bull flag, but has weakened since earnings, consider stop below 87
- ACCD (43.4) - reversing at price support, could run to 20-day EMA
- RSKD (42.9) - could bounce right here off 20-day EMA test; major gap support at 4.50
- SNOW (17.9) - bouncing off gap support, 140.10 would be my closing stop
- JKS (15.2) - great industry and solid AD line, but relative weakness bothers me
- FTCH (10.6) - bouncing off BIG support near 7.20
- MDB (1.1) - bouncing off gap support zone, but relative weakness and weak AD line scare me
Earnings Reports
Here are the key earnings reports for the next two days, featuring stocks with market caps of more than $10 billion. I also include several companies with market caps below $10 billion. Finally, any portfolio stocks that will be reporting results are highlighted in BOLD. If you decide to hold a stock into earnings, please understand the significant short-term risk that you are taking. Please be sure to check for earnings dates for any companies you own or are considering owning.
Wednesday, November 23:
DE
Friday, November 25:
None
Monday, November 28:
PDD, HTHT
Economic Reports
Initial jobless claims: 240,000 (actual) vs. 225,000 (estimate)
October durable goods: +1.0% (actual) vs. +0.4% (estimate)
October durable goods ex-transports: +0.5% (actual) vs. +0.1% (estimate)
November PMI Composite Flash - Manufacturing: 47.6 (actual) vs. 50.0 (estimate)
November PMI Composite Flash - Services: 46.1 (actual) vs. 48.0 (estimate)
October new home sales: 632,000 (actual) vs. 575,000 (estimate)
November consumer sentiment: 56.8 (actual) vs. 55.0 (estimate)
FOMC minutes to be released at 2:00pm ET
Happy trading!
Tom