
EB Daily Market Report - Monday, November 28, 2022
Extending Fall Special For 2 Days!
Thanks to everyone that took advantage of our Fall Special! We've decided to extend it through Tuesday, November 29th (at midnight) for those who may have been traveling this weekend for the holidays. If you haven't yet extended using this Special, it's guaranteed to be our BEST DEAL of the year, so don't delay. You'll find everything you need to know HERE!
Executive Market Summary
- Futures were down overnight and our major indices opened lower
- Selling has escalated throughout today's session, with little buying and recovery intraday
- Real estate (XLRE, -2.40%), technology (XLK, -2.33%), and energy (XLE, -2.26%) have been hardest hit
- Meanwhile, consumer stocks have largely been spared as consumer staples (XLP, -0.41%) and consumer discretionary (XLY, -0.48%) are the two relative outperformers
- Crude oil ($WTIC, +1.51%) has rebounded, but it's done little to buoy the energy space
- The 10-year treasury yield ($TNX) is relatively unchanged near 3.70%
- After moving steadily lower over the past several weeks, the Volatility Index ($VIX, +8.39%) is spiking on today's selling
- Amazon.com (AMZN, +1.00%) and Tesla (TSLA, +0.69%), the two largest components of the XLY, are holding that ETF up on the session
- Renewable energy stocks ($DWCREE, -3.23%) are primary laggards as nearly every name in the space is lower
Market Outlook
Most of you know many of the historical tendencies of the S&P 500, because I discuss them so often. I thought I'd take a look at some of those tendencies and compare them to how things have actually unfolded in 2022. It's pretty interesting, so I wanted to share the results.
First, the S&P 500 performance breakdown historically by day of the week is as follows (since 1950):
- Monday: -13.87%
- Tuesday: +11.22%
- Wednesday: +19.84%
- Thursday: +9.24%
- Friday: +16.88%
There have been a few differences in 2022. Here are the annualized numbers by day of the week:
- Monday: -37.53%
- Tuesday: +9.24%
- Wednesday: +10.37%
- Thursday: -41.66%
- Friday: -22.80%
Mondays continue to be poorly performing days and Wednesdays remain the best performing day of the week. The biggest difference in 2022 is that we have tended to end weeks on a negative note, with poor action on both Thursdays and Fridays, leading to further weakness on Mondays. Tuesdays and Wednesdays have served as primary rebound days.
Another interesting breakdown involves four different periods of the calendar month. Here are the historical numbers on the S&P 500 since 1950:
- 26th through 6th: +21.18%
- 7th through 10th: -4.10%
- 11th through 18th: +12.49%
- 19th through 25th: -7.62%
Obviously, we've been downtrending during much of 2022, so I expected bad numbers in each period. I was partially correct. Check out the normally poor 19th through 25th period:
- 26th through 6th: -18.67%
- 7th through 10th: -13.72%
- 11th through 18th: -48.78%
- 19th through 25th: +26.80%
After I thought about it, it made more sense. Let's keep in mind that many "middle of the month" periods were weak in 2022 and we hosted a few 2022 Max Pain events where both the SPY and QQQ showed max pain levels WAY ABOVE current price. If you recall, March, June, and October each saw nice rallies during the 19th to 25th periods. There's a significant tendency historically for this period to be weak as we normally see a rise leading up to options expiration week. Then the selling kicks in. 2022 has been the opposite, where we've seen selling much of the year, so market makers have likely directed prices higher into options expiration week - and during the week after - in an effort to lower the amount of net put option premium they must pay.
I know I'm a numbers geek, but I found it interesting.
Sector/Industry Focus
Earlier this morning on my Trading Places LIVE show, I featured the medical equipment group ($DJUSAM) as I believe this area of the market may just be beginning a big move to the upside on both an absolute and relative basis. It certainly appears to me as though a downtrend has been broken and we should expect pullbacks to be bought by market participants. Here's the current look:
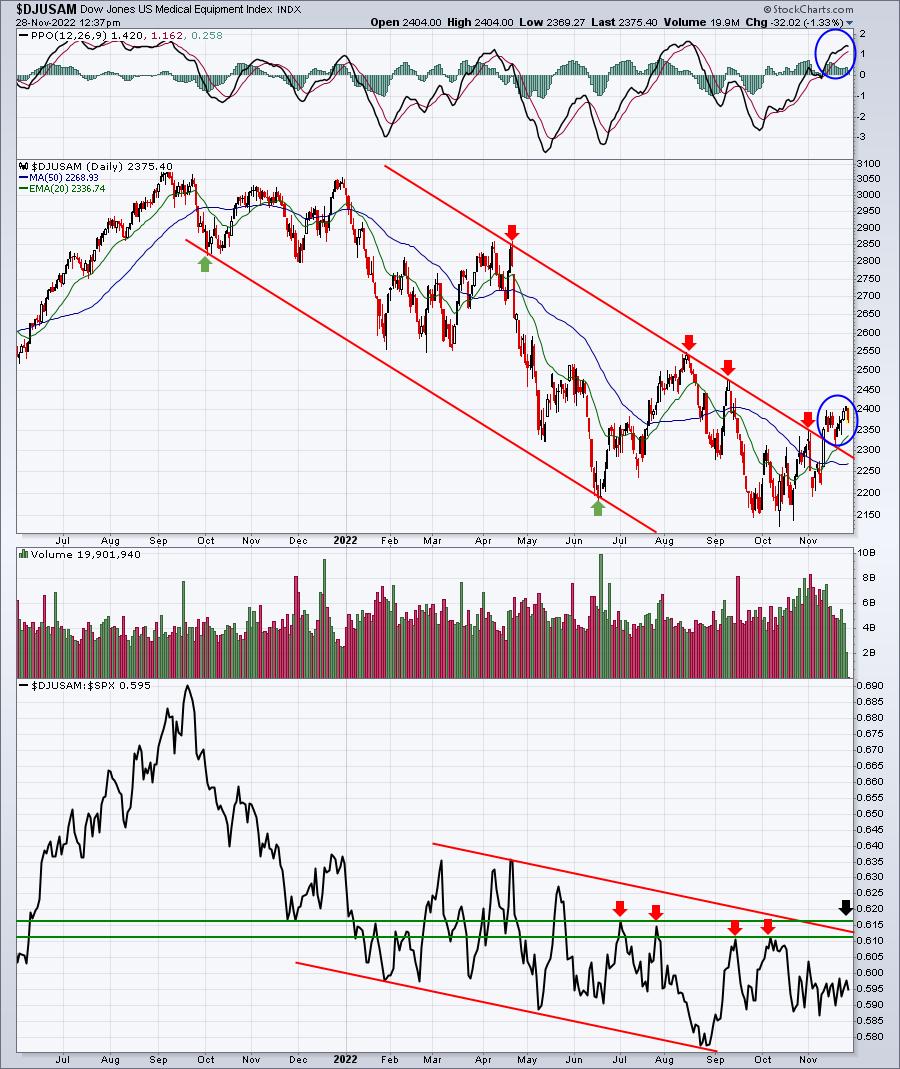
I can argue the absolute price has broken its downtrend and is now trending higher. But if we look at that bottom panel, we can't make that same bullish argument for the DJUSAM's relative strength. In order to significantly improve the odds of trading medical equipment stocks on the long side, we need evidence that money is rotating into this group. Do you see that black arrow that I've placed in the lower panel? If we can break the relative resistance at 0.616, it'll tell us that medical equipment stocks are at a 6-month relative high. That, combined with the absolute price breakout, would be a very bullish signal for the group. We're improving, but not quite there yet. Keep an eye on this group, though, because we have a large number of medical equipment stocks on our Strong Earnings ChartList (SECL). That means fundamentals aren't bad in this group and, if improving technicals begin lining up, we could see significant appreciation in many of these SECL stocks.
ChartLists/Strategies
I discuss AD lines quite a bit, because I believe they can give us indications of Wall Street accumulation. But always remember that the AD line is a secondary indicator. In other words, I NEVER buy a stock ONLY because of its strong AD line. I use a strong AD line to corroborate a long position in a stock exhibiting other bullish signals, the most important of which is price/volume. Therefore, I want to see a breakout or an uptrending stock that sees short-term weakness and is testing a critical price, gap, trendline, and/or moving average support.
Let me give you two examples to show you the difference. The first is ESTC, which has a very strong AD line, but is showing little else in terms of strength:
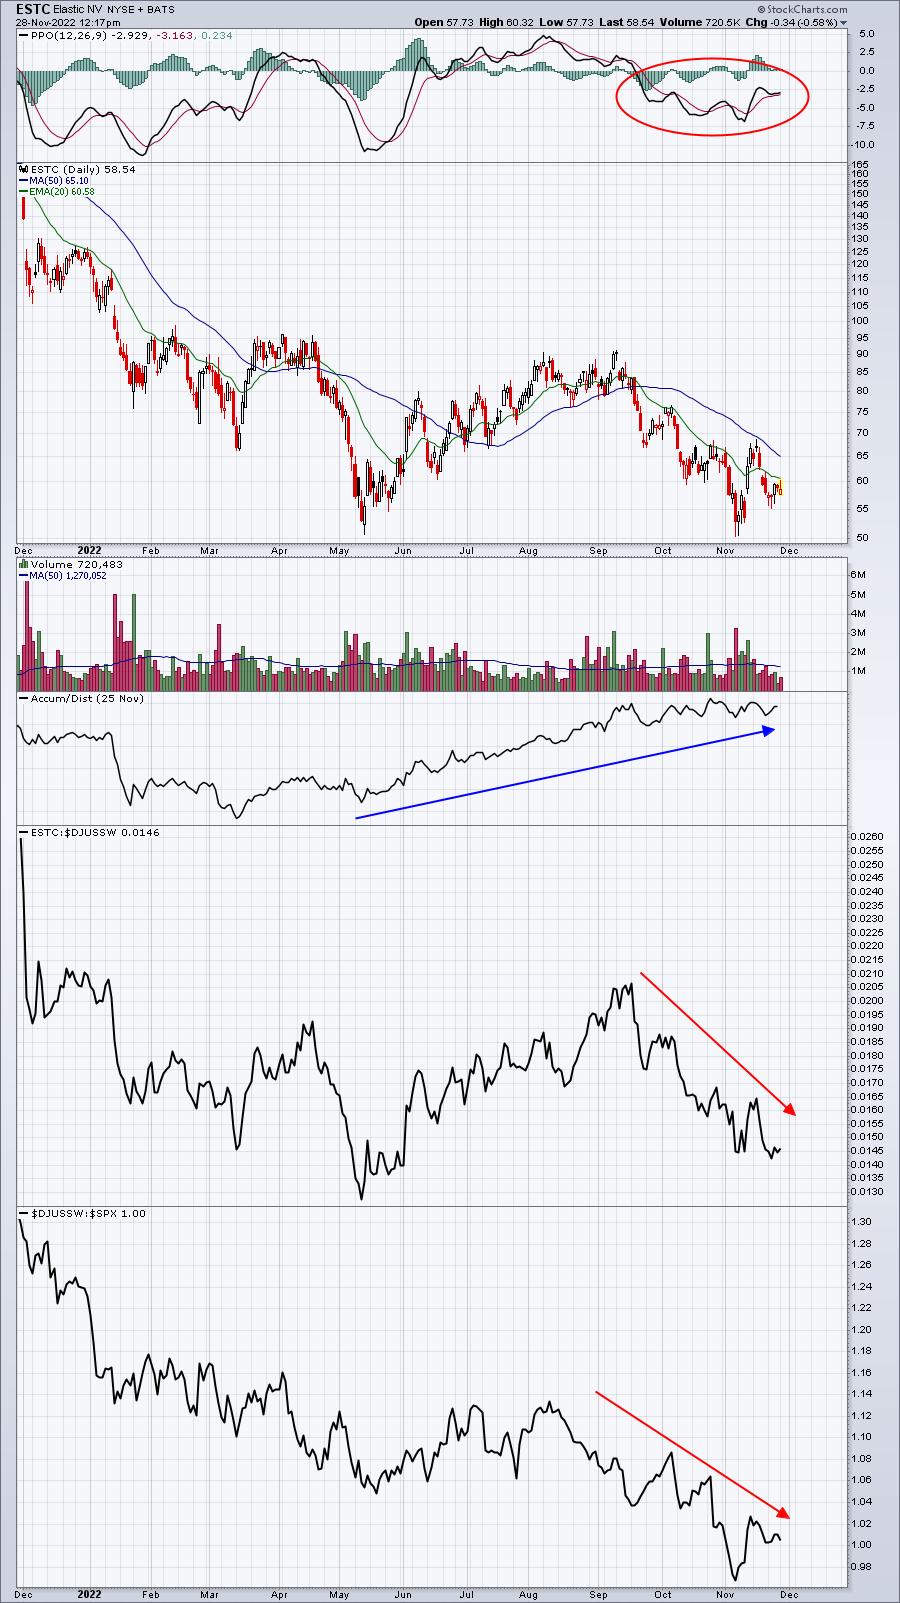
That's a very solid AD line. And it had a very nice push higher to 68 to establish a neckline, but it hasn't confirmed this bottoming pattern with a breakout yet. ESTC is now trending lower vs. its software peers ($DJUSSW) and software continues to be one of the weakest industry groups. While I find it interesting that ESTC is showing a strong AD line, it's very difficult to argue that significant accumulation is taking place in a stock if it's relative strength vs. its peers is poor. It would be risky, but if ESTC tests recent price lows in May and November in the low 50s, an aggressive position could be taken with a tight stop in place.
Now let's look at a software stock that is showing a strong AD line AND is also a leader in the space - PERI:
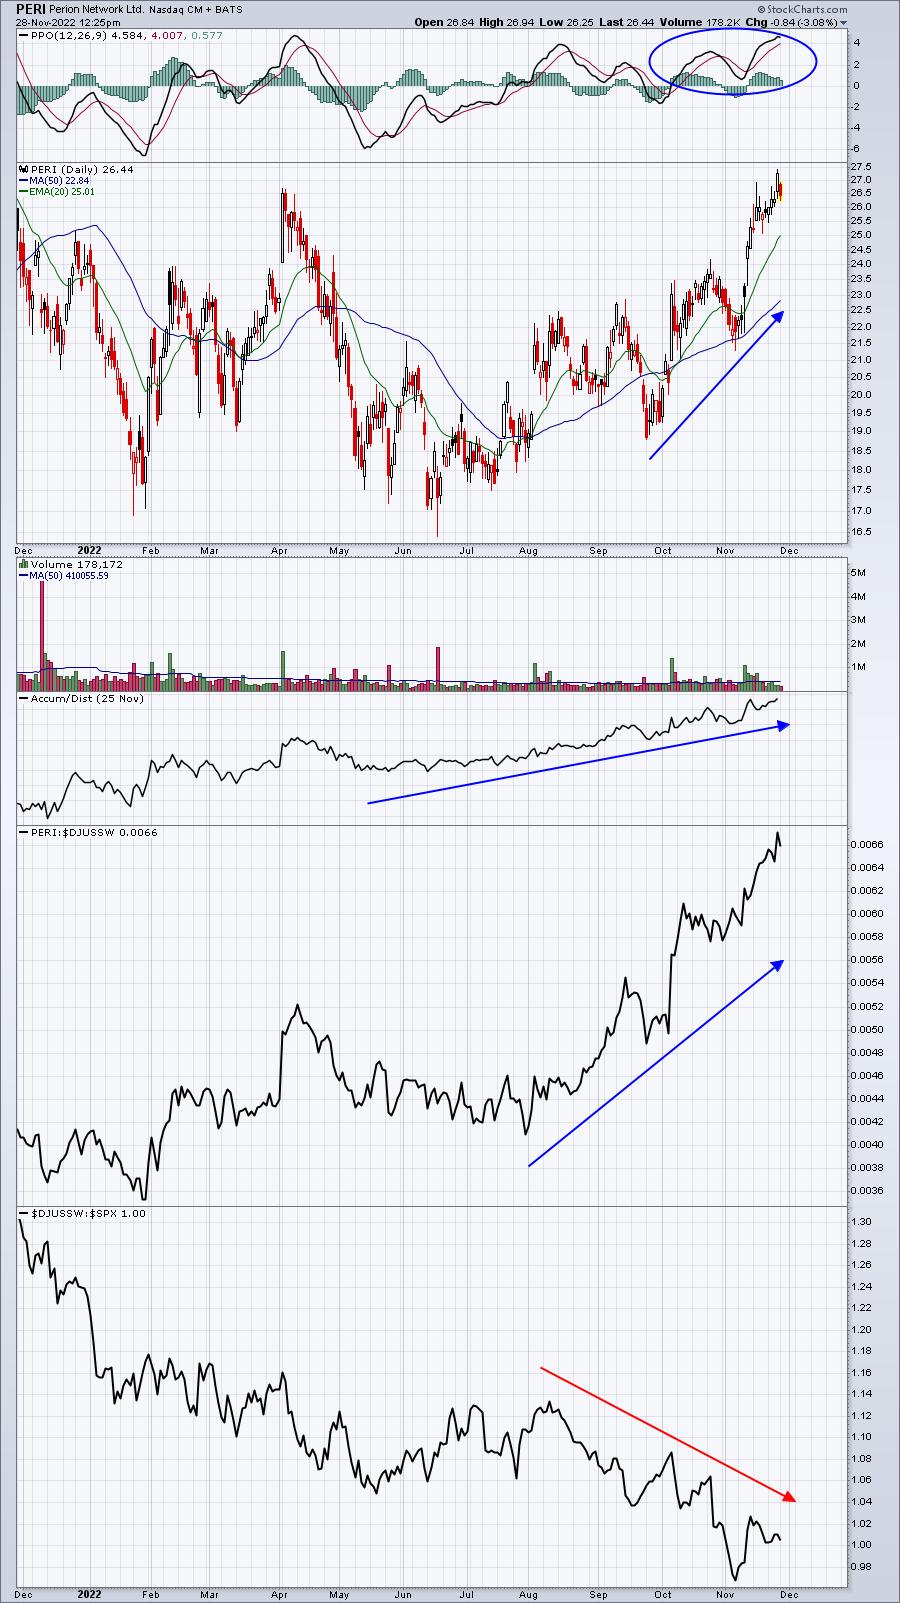
PERI has much more bullish momentum, as evidenced by the PPO in positive territory. It's also a strong relative performer in the software group. The very strong AD line is confirming the strength I see on the chart. In the future, a 20-day EMA test could be a great entry into PERI. It's a much healthier stock and one I'd have more confidence trading.
Earnings Reports
Here are the key earnings reports for the next two days, featuring stocks with market caps of more than $10 billion. I also include several companies with market caps below $10 billion. Finally, any portfolio stocks that will be reporting results are highlighted in BOLD. If you decide to hold a stock into earnings, please understand the significant short-term risk that you are taking. Please be sure to check for earnings dates for any companies you own or are considering owning.
Monday, November 28:
PDD, HTHT
Tuesday, November 29:
INTU, BNS, WDAY, CRWD, HPE, NTAP, SJR, ESLT, BILI
Economic Reports
None
Happy trading!
Tom