
EB Daily Market Report - Tuesday, November 29, 2022
Fall Special - TODAY is the LAST DAY!
We extended our Fall Special two more days and it all comes to an end tonight at midnight! This is it. This is your final chance to lock in our BEST DEAL of the year! We look at the stock market different than every other analyst on the planet and you know the results. Who else said the risk was too high to remain in the stock market at the end of 2021 and THEN said the reward-to-risk had completely changed in mid-June? No one. Your financial future is up to you and, ultimately, you're responsible for your financial decisions. And I'm not here saying that EarningsBeats.com will be right at every turn. But who's been more accurate these past 3 years? Who wades through all the media noise to give you what's actually happening with rotation, sentiment, volatility, etc. - meaningful information that allows you to make more informed decisions? Every morning, when I wake up, I'm thinking how I can make your financial future a little bit better. Take a minute and make sure you lock in our VERY BEST DEAL. You can find more information about our Fall Special HERE, but you need to ACT TODAY!
I hope you continue to join us on this journey!
Executive Market Summary
- Futures were mostly higher overnight, but we did see weakness that resulted in a bifurcated market at the open
- Since the opening bell, money has again rotated AWAY from the growth-oriented NASDAQ as this index is underperforming
- Most commodities are higher on the session, led by crude oil's ($WTIC, +2.40%) jump above $79 per barrel
- The 10-year treasury yield ($TNX) was lower early in today's action, but is now up 3 basis points to 3.73%, remaining well beneath its declining 20-day EMA
- Energy (XLE, +1.44%) is leading today, benefiting by the move higher in crude oil
- Our aggressive sectors are hovering near the flat line as consumer discretionary (XLY, +0.05%), communication services (XLC, +0.0%), and technology (-0.19%) wobble
- Carmax, Inc. (KMX, +4.19%) is leading the S&P 500 higher, breaking back above its 50-day SMA
Market Outlook
One chart that I highlighted at MarketVision 2022 on Saturday, January 8, 2022, was the 253-day moving average of the equity-only put-call ratio ($CPCE). It's a moving average that tends to trend in one direction or the other for an extended period of time. That's its history. And when it changes directions, you need to be aware as it often leads to a completely different market environment. Back at that MV2022 event, I said sentiment was THE biggest issue heading into 2022 and that this CPCE needed to be "reset". By "reset", I meant that the extreme bullishness felt by market participants needed to be reined in. Unfortunately, the only way to change everyone's mind about the bullish uptrend was having to weather a significant downturn - and that's EXACTLY what we got in 2022 - a cyclical bear market. I'll show you two charts, the first is where this 253-day moving average was back on January 8, 2022, and the second is where it is now. I think it'll be fairly easy to see how things have changed in terms of sentiment:
$CPCE (as of January 8, 2022)
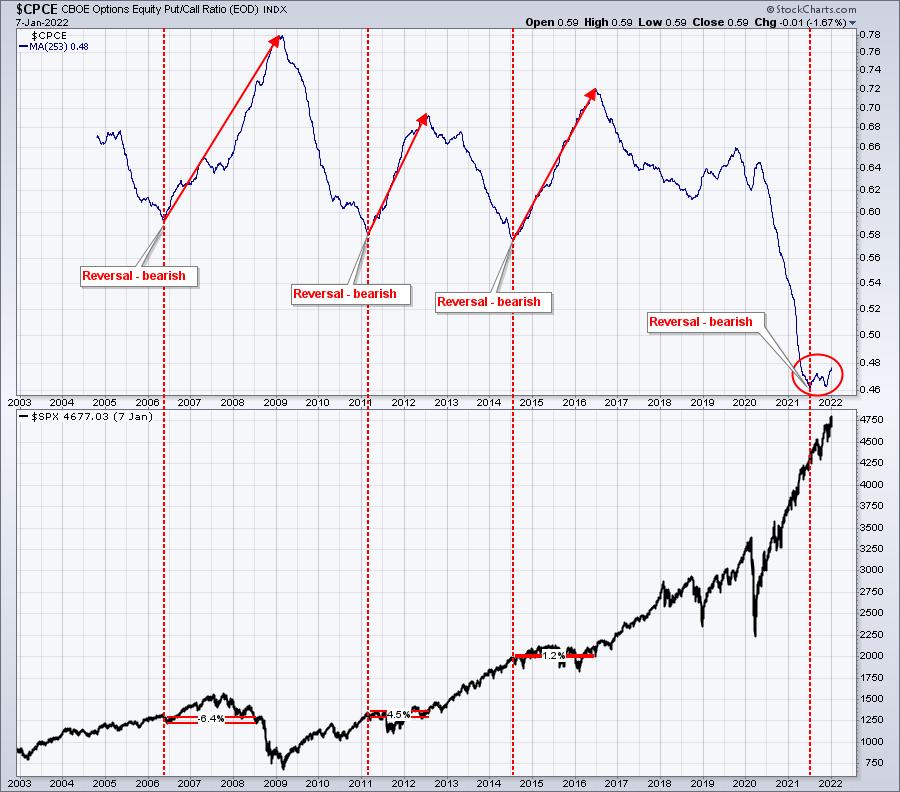
The takeaway here is that when this 253-day moving average bottoms and starts to turn higher, the stock market is likely to struggle. It doesn't mean we'll have a bear market. It just means that market participants, cumulatively, as SOOOO bullish that there's little buying power left. As a result, the red-dotted vertical lines highlight the beginning of periods when the CPCE rises and the S&P 500 struggles.
Now let's fast forward to today and the "reset" that's taken place:
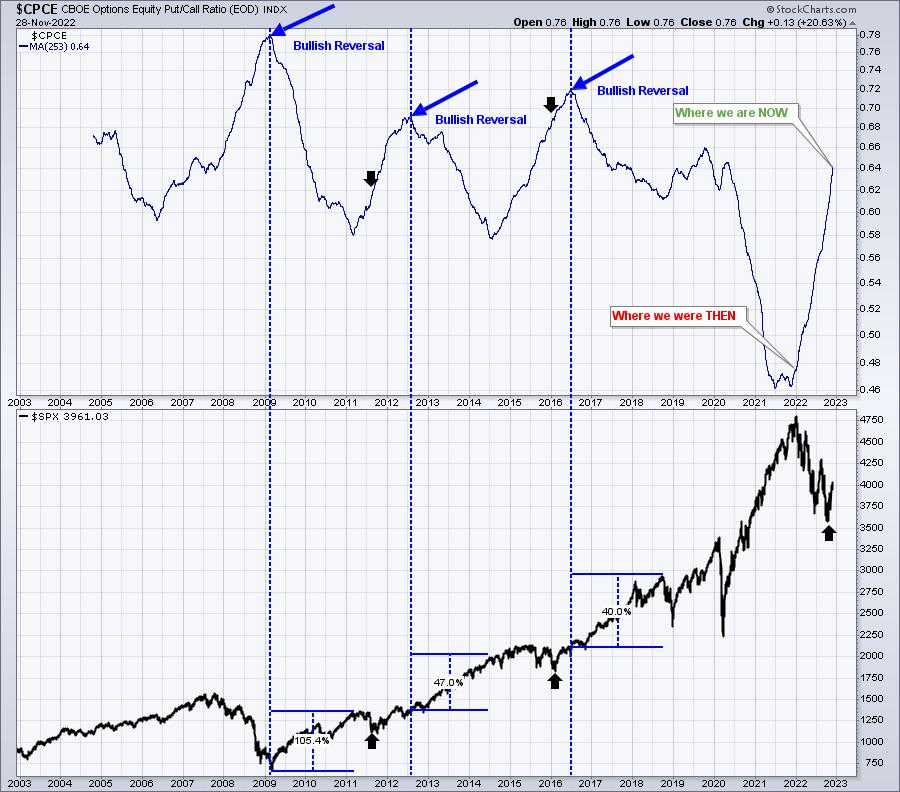
The blue-dotted vertical lines highlight when we see BULLISH reversals in this CPCE. Look at the corresponding gains in the S&P 500 AFTER the bullish reversal (CPCE top) occurs. In 2009, we saw a 105% gain in 2 years. In 2012, the gain was 47% in 2 years. In 2016, we saw a 40% gain in 2 years. THINK ABOUT THAT. Those aren't gains necessarily from the market bottom. Those are gains AFTER the top in the CPCE printed. So, if the CPCE were to begin rolling over NOW, could we see a 40-50% move higher over the next couple years? I say absolutely yes. That could put us near 6000 on the S&P 500 by 2024. And what if we were to see something higher than 50%?
Do the math.
Sector/Industry Focus
What do we do with cryptocurrencies? Well, for me, it's difficult to be well-versed in so many different areas of the financial world. My concentration is U.S. stocks, so I don't trade cryptos personally. But if I did, I would rely heavily on relative strength, just as I do with stocks. The charts tell me where the money is going and I have to believe the Wall Street giants are much smarter than me, particularly when it comes to cryptos. Two of the most popular cryptos are bitcoin ($BTCUSD) and etherium ($ETHUSD), so as all cryptos have fallen during the FTX mess, it might be helpful to see how the relative relationship between these two have played out. Here's that relative chart ($BTCUSD:$ETHUSD):
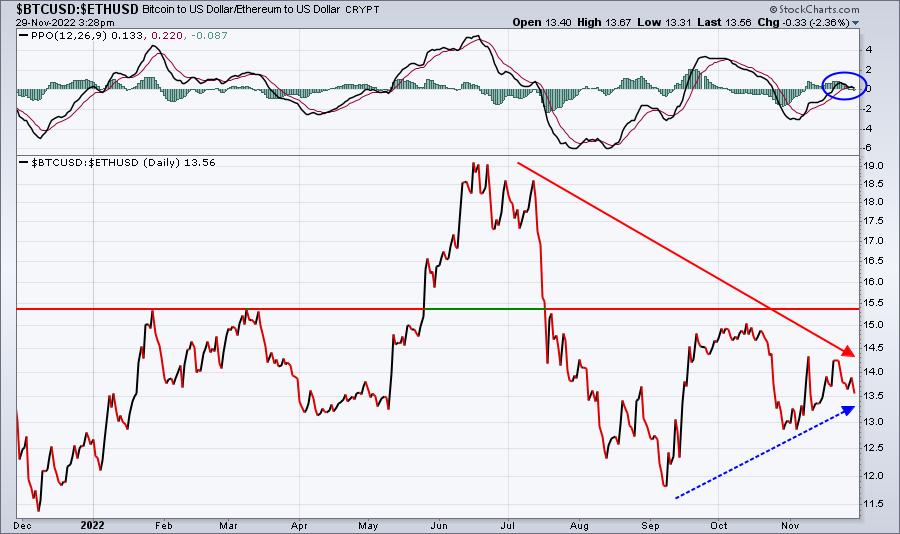
While all cryptos have been moving lower the past month or so, bitcoin has at least enjoyed a bit of relative strength vs. etherium during this period. However, there's a relative downtrend from a more intermediate-term perspective that cannot be ignored. The relative PPO is staggering around the zero line, showing that neither crypto has a clear advantage at the moment. I believe the 15.4 relative resistance could provide a signal as a breakout there would favor bitcoin. Until that happens, though, I'd give etherium the edge as the intermediate-term advantage seems to be theirs.
ChartLists/Strategies
On Saturday, I provided a number of potential trade setups. After the weakness yesterday, I thought I'd give you a quick update on those:
- AAPL - gapped beneath 20-day EMA (bearish), but still has MAJOR gap support at 141.24. I like that level to hold as support.
- NFLX - closed slightly beneath its 20-day EMA yesterday and was weak this morning. I own this one and will sell at today's close if we finish the day at or near the intraday low
- PODD - remains a solid buy at just below 290. The 20-day EMA is at 285 and rising.
- SPT - is down over 6% today and is at gap support at 54. I just bought at this level and will sell if it fails to hold 54 on the close.
- DXCM - continues to hold support near 110.
- LPSN - I'm still holding, riding this thing like Secretariat. It's volatile and not for everyone. The biggest support is gap support at 10.12.
- HDSN - did pull back after its breakout, but still well above its 20-day EMA. I like it, but don't own it. I'd consider buying at the 20-day EMA
Earnings Reports
Here are the key earnings reports for the next two days, featuring stocks with market caps of more than $10 billion. I also include several companies with market caps below $10 billion. Finally, any portfolio stocks that will be reporting results are highlighted in BOLD. If you decide to hold a stock into earnings, please understand the significant short-term risk that you are taking. Please be sure to check for earnings dates for any companies you own or are considering owning.
Tuesday, November 29:
INTU, BNS, WDAY, CRWD, HPE, NTAP, SJR, ESLT, BILI
Wednesday, November 30:
CRM, RY, SNPS, SNOW, HRL, BEKE, SPLK, PSTG, FIVE, OKTA, DCI, NTNX, XPEV, ESTC, PVH, BOX, VSCO, WOOF, LZB
Economic Reports
September Case-Shiller home price index: -1.5% (actual) vs. -1.2% (estimate)
September FHFA house price index: +0.1% (actual) vs. -1.0% (estimate)
November consumer confidence: 100.0 (estimate)
Happy trading!
Tom