
EB Daily Market Report - Monday, December 5, 2022
ChartLists Updated
Over the weekend, I was able to update the following ChartLists and they've been updated on our website as well:
- Seasonality - December 2022 (SEASCL)
- Short Squeeze ChartList (SSCL)
Earlier today, I updated the following two ChartLists, which have not yet been updated on our website (but they should later today):
- Strong Earnings ChartList (SECL)
- Strong Future Earnings ChartList (SFECL)
Executive Market Summary
- Futures were weak overnight and, after gapping down at the open, U.S. equities have seen accelerated selling
- The Dow Jones ($INDU, -1.47%) is down 500 points, but the NASDAQ is down more ($COMPQ, -2.00%) on a percentage basis
- Commodities are mostly lower as crude oil ($WTIC, -3.20%) reversed course after earlier gains
- Natural gas ($NATGAS, -11.05%) is being punished
- The 10-year treasury yield ($TNX) is up 10 basis points to 3.60%
- All 11 sectors are lower today, led by energy (XLE, -3.41%) and financials (XLF, -2.89%)
- Utilities (XLU, -0.80%) have held up best - as have the other defensive sectors
- Automobiles ($DJUSAU, -5.77%) have turned lower again, sparked by another big drop in Tesla (TSLA, -6.46%)
Market Outlook
During my morning Trading Places LIVE show this morning and in my Trading Places blog article on Sunday, I discussed the December trading tendencies, which include a not-so-great first half of the month, followed by a blistering second half. On the S&P 500, here are the annualized returns for each period (since 1950):
- December 1-15: +2.82%
- December 16-31: +35.68%
While I don't use historical tendencies as my primary indicator of market direction, I don't ignore it either. As I look at the SPY chart (ETF that tracks the S&P 500), I could easily see a bit of selling/consolidation. Here's how the SPY currently looks:
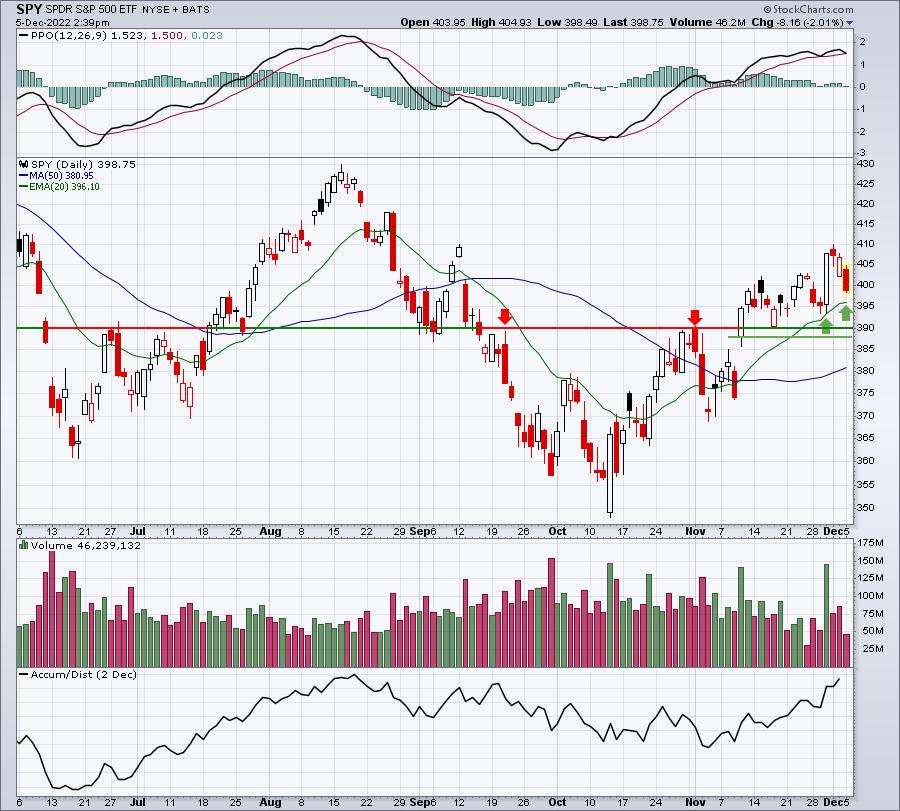
The 20-day EMA would be the first key short-term support level to watch. Below that would be the price support range from 388-390. I think it's very possible that the 20-day EMA is tested, at a minimum. I would expect traders to grow a bit more nervous as next Tuesday and Wednesday approach. The next Fed meeting begins on Tuesday and ends with its next policy statement on Wednesday afternoon. The November CPI will be released on Tuesday morning. It could be a wild week next week.
Sector/Industry Focus
Health care (XLV) has a relative winner among sectors throughout 2022 and the group is threatening yet another breakout vs. the benchmark S&P 500. Check out this chart of the XLV and its relative strength in the bottom panel:
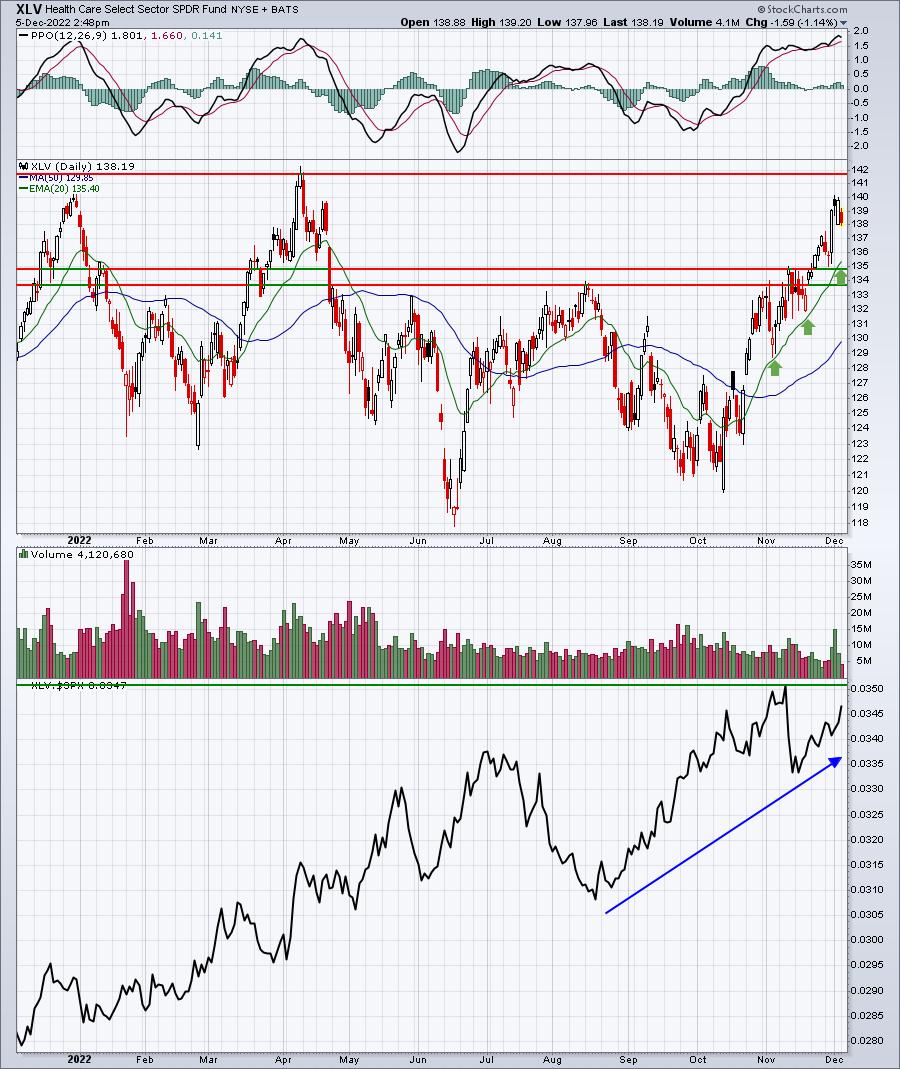
Again, watch the 20-day EMA. The daily PPO is strong, so I'd look for any weakness to find buyers at that key short-term moving average.
ChartLists/Strategies
Biotechs ($DJUSBT, -1.66%) have been hot of late, but the group is pulling back today. It could present an opportunity, especially if the short-term selling were to accelerate and approach its rising 20-day EMA. If it does, here are two biotechs that could benefit from short-term selling:
HALO:
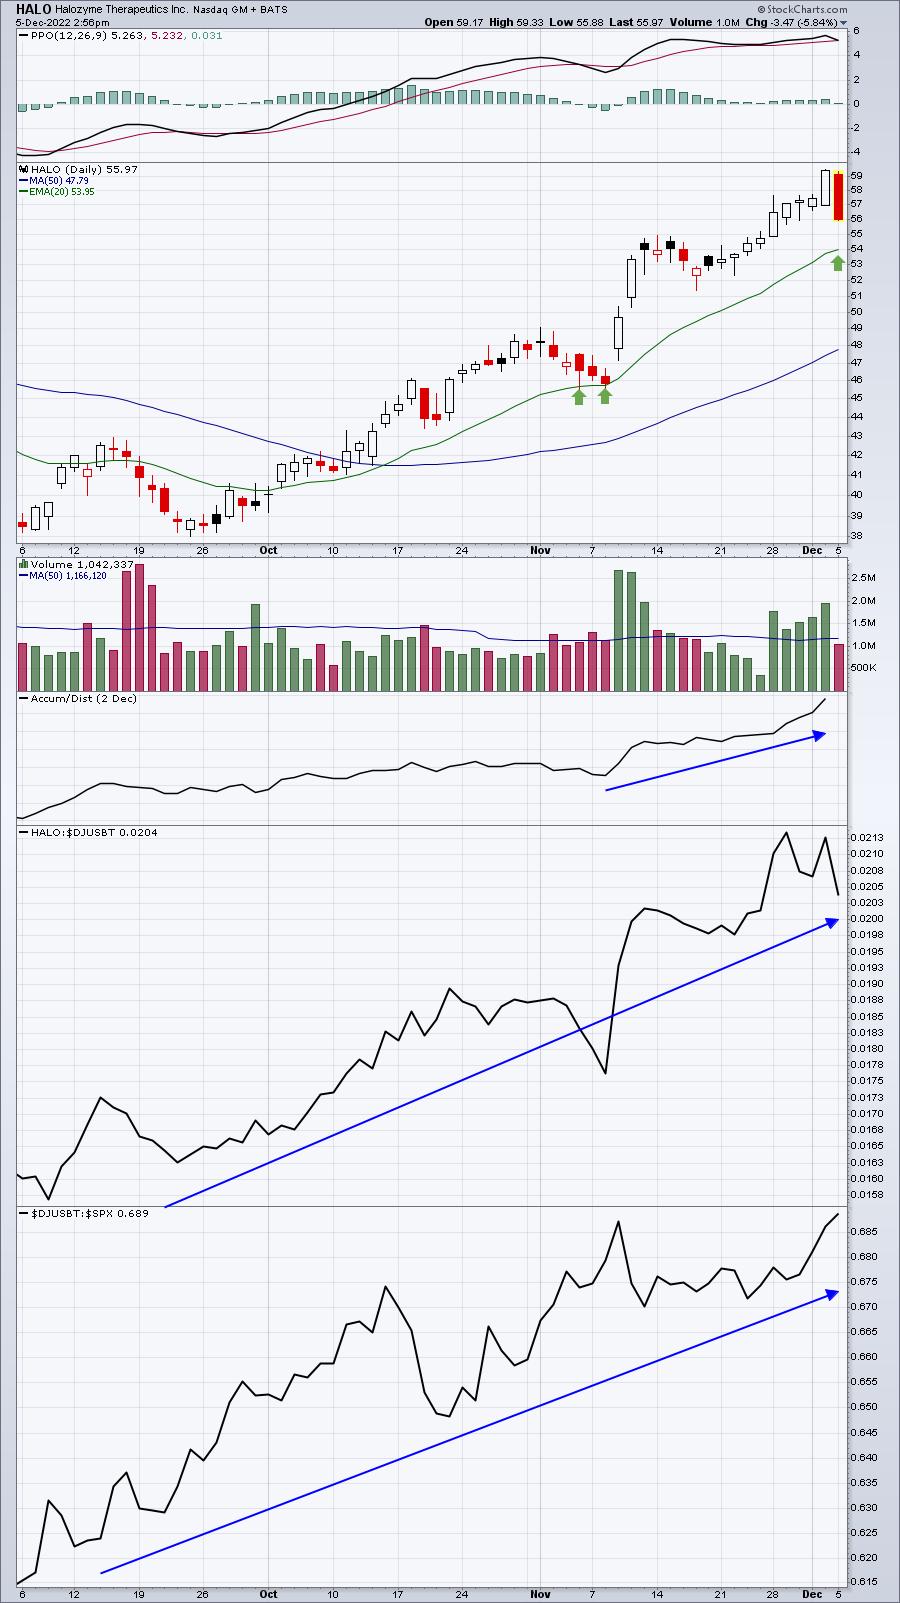
We haven't seen a 20-day EMA test in a month. HALO has been a tremendous performer and could see some significant buying take place if this current profit taking episode takes the stock down to its 20-day EMA.
BIIB:
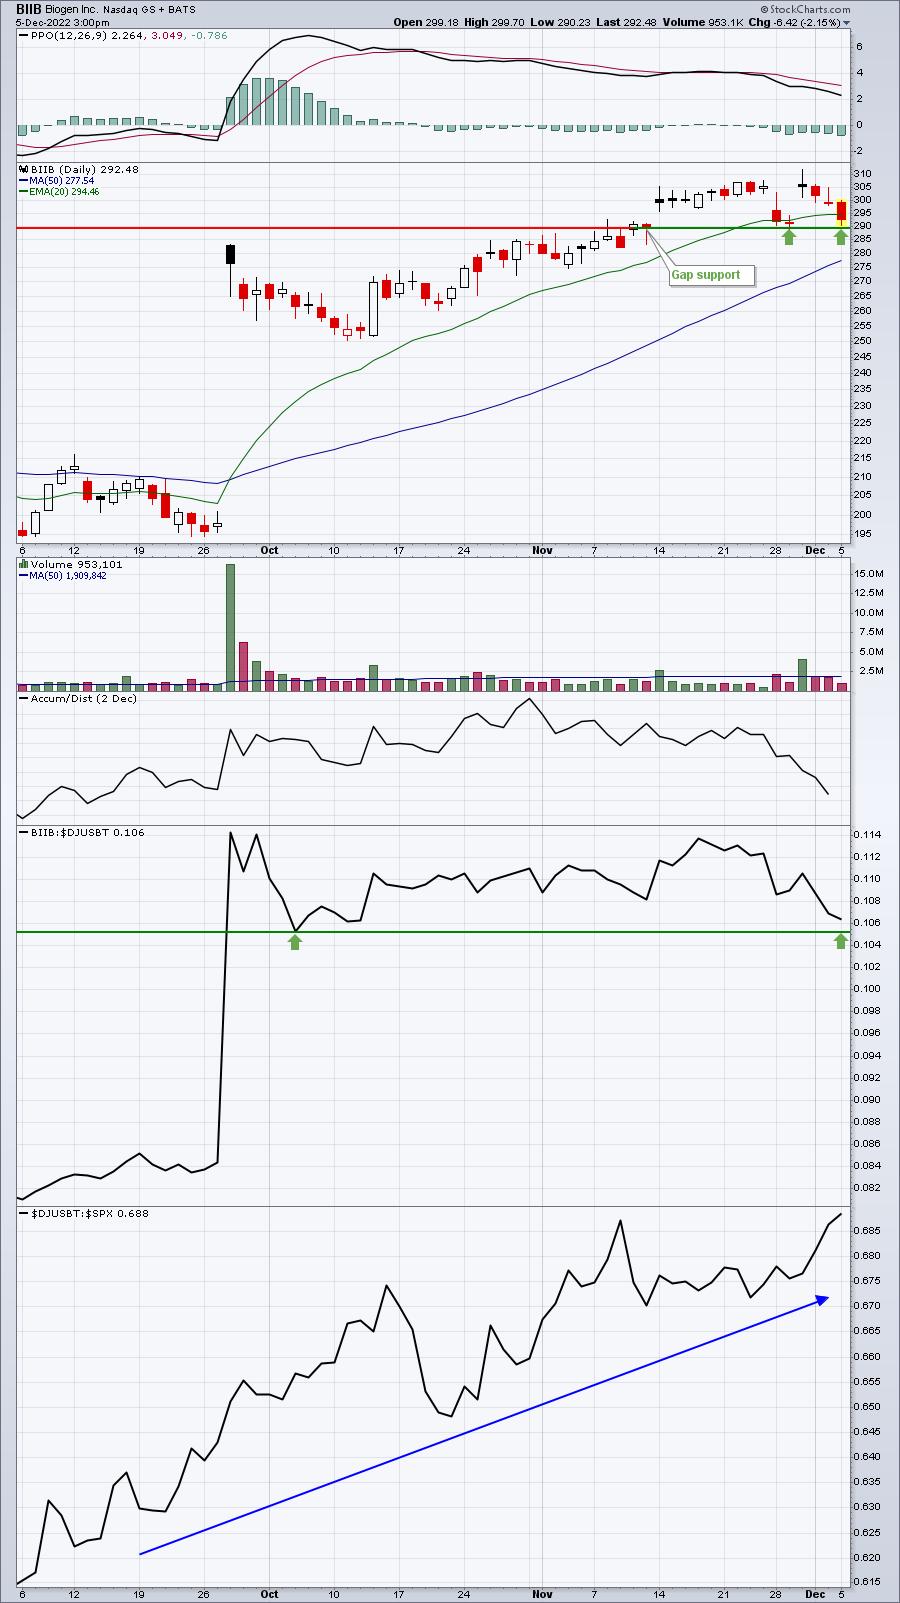
Recent gap support resides near 290. Entry could be made here with a very tight stop, if that's the kind of short-term trade you like.
Earnings Reports
Here are the key earnings reports for the next two days, featuring stocks with market caps of more than $10 billion. I also include several companies with market caps below $10 billion. Finally, any portfolio stocks that will be reporting results are highlighted in BOLD. If you decide to hold a stock into earnings, please understand the significant short-term risk that you are taking. Please be sure to check for earnings dates for any companies you own or are considering owning.
Monday, December 5:
SAIC, GTLB
Tuesday, December 6:
AZO, FERG, MDB, CASY, WDH, TOL, HQY, GWRE, S, SIG, AVAV, CXM, PLAY, ZUO
Economic Reports
November PMI composite: 46.4 (actual) vs. 46.5 (estimate)
October factory orders: +1.0% (actual) vs. +0.7% (estimate)
November ISM services: 56.5 (actual) vs. 53.5 (estimate)
Happy trading!
Tom