
EB Daily Market Report - Special Report - Tuesday, December 6, 2022
This Special Report is being sent in lieu of the regular Daily Market Report (DMR).
Updated ChartLists
3 more ChartLists have been updated today, as follows.
- Strong AD ChartList (SADCL)
- Raised Guidance ChartList (RGCL)
- Bullish Trifecta ChartList (BTCL)
They have been updated on our website and can be viewed/downloaded at your earliest convenience.
Current Market Outlook
I've said in the past that I like to pick my spots to use leveraged ETFs. I don't buy and hold them as their value erodes over time. I like to either buy leveraged ETFs at key support like the 20-day EMA, or on a breakout above prior price resistance. Today, we've seen our major indices move beneath their respective 20-day EMAs intraday. Because our major indices have strong AD lines, they tend to finish trading days in the upper half of their range. That makes buying ETFs that track these major indices more appealing - even more so with leveraged ETFs. There are several key points I want to make.
Intraday Moves Beneath 20-Day EMA:
To provide you an example, let's look at the QQQ:
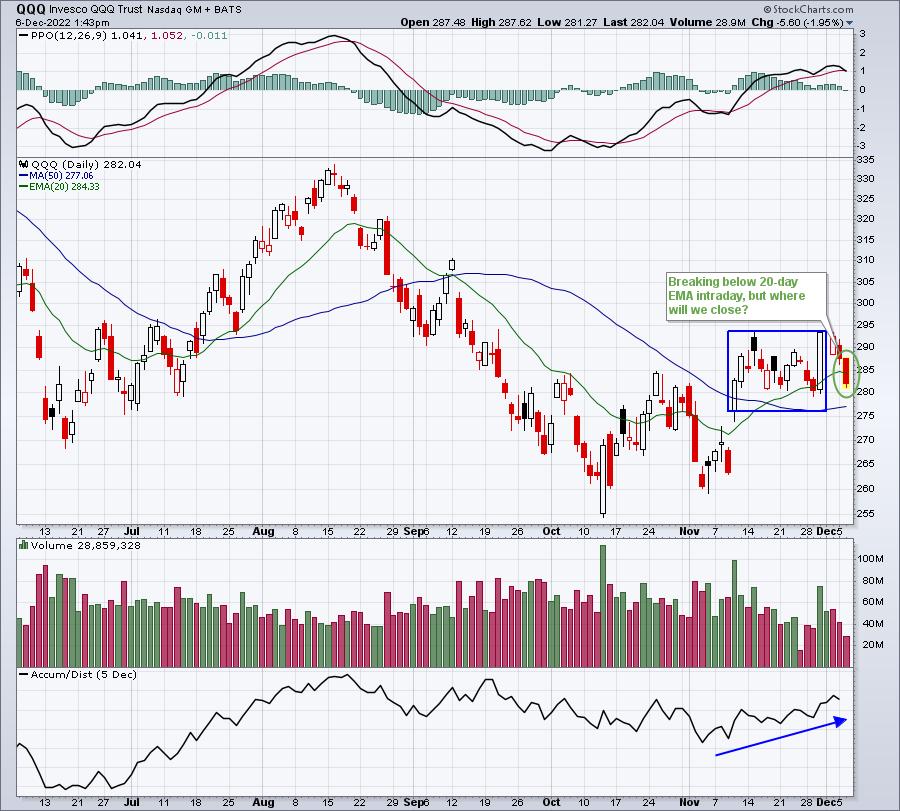
The AD line has been strengthening, which only occurs from finishing fairly consistently in the upper half of daily trading ranges. The blue rectangular box highlights the past few weeks of trading. There are few days where we have finished on our lows or even near our lows. That makes entry intraday a bit more compelling. And if we rally this afternoon and can close back near or above the 20-day EMA, we could be marking a significant low. Of course, there's the other side of the coin where, if we close at or near our lows today and well below that 20-day EMA, it could encourage more sellers. My strategy is to use leverage and buy today, anticipating another afternoon reversal and EXIT if that is not the case. The QLD tracks the NASDAQ 100 at a 2 to 1 clip, while the TQQQ tracks the NASDAQ 100 at a 3 to 1 clip. Obviously, leveraged ETFs present much more risk, but also potentially higher returns. Each individual must determine his or her own level of risk that he/she is willing to take.
Manipulation:
As I've posted and discussed on many occasions in 2022, I believe mass distribution took place from January through May and manipulation has taken place since. During the first 5 months of the year, we saw selling throughout the trading days. It was indiscriminate. Since May, however, much selling has occurred at the opening bell and in the first 30 to 90 minutes, while there have been many afternoon rallies. Here's how the QQQ has traded in 2022:
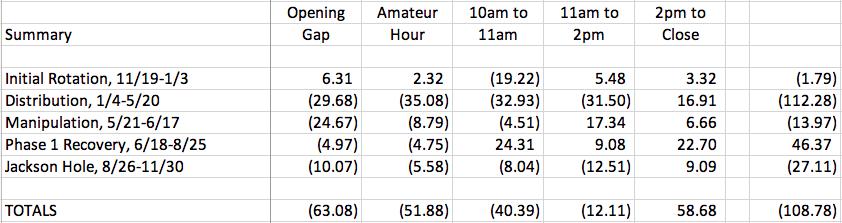
The QQQ fell 108.78 bucks from November 19, 2021 through the close on November 30, 2022. The above summarizes how the QQQ has traded (on a net basis) in each of the 5 periods identified, broken down by time of the trading day. I consider "Amateur Hour" to be the first 30 minutes of trading, where we tend to see big selling due to the "bad news media" and gap downs.
Historical Performance:
December tends to be a very strong month for U.S. equities, but the second half of the month has produced SIGNIFICANTLY better returns than the first half of the month. While December 1-15 can be challenging, historical performance always takes a back seat to the actual technical outlook.
I don't know if we're going to see a rally in the final two hours, but if we do, that would be an extremely bullish kick save at a major moving average (20-day EMA). You could certainly wait to see if an afternoon rally occurs before deciding on trading a leveraged ETF. If you consider that, I'd also consider using today's intraday low as a stop going forward. Holding leveraged ETFs on the long side during technical breakdowns in market action is particularly dangerous, in my view. If we do not rally back this afternoon, I'll exit my leveraged positions and await another breakout above the 20-day EMA before considering leveraged ETFs again. I only want to be in them if I feel an uptrend has started or if I'm anticipating an afternoon rally (like today) to kick start a rally.
Short-Term Rotation Favors The Bulls:
During Powell's speech last week, aggressive areas of the market exploded higher and many of those areas are holding on to much of those gains, even though the overall market has not. That's bullish rotation. I like to compare price action from a key point in time, in this case last Wednesday at 1:30pm ET when Powell gave his speech and had a bit more dovish tone. Check out the S&P 500 with many key ratios beneath it:
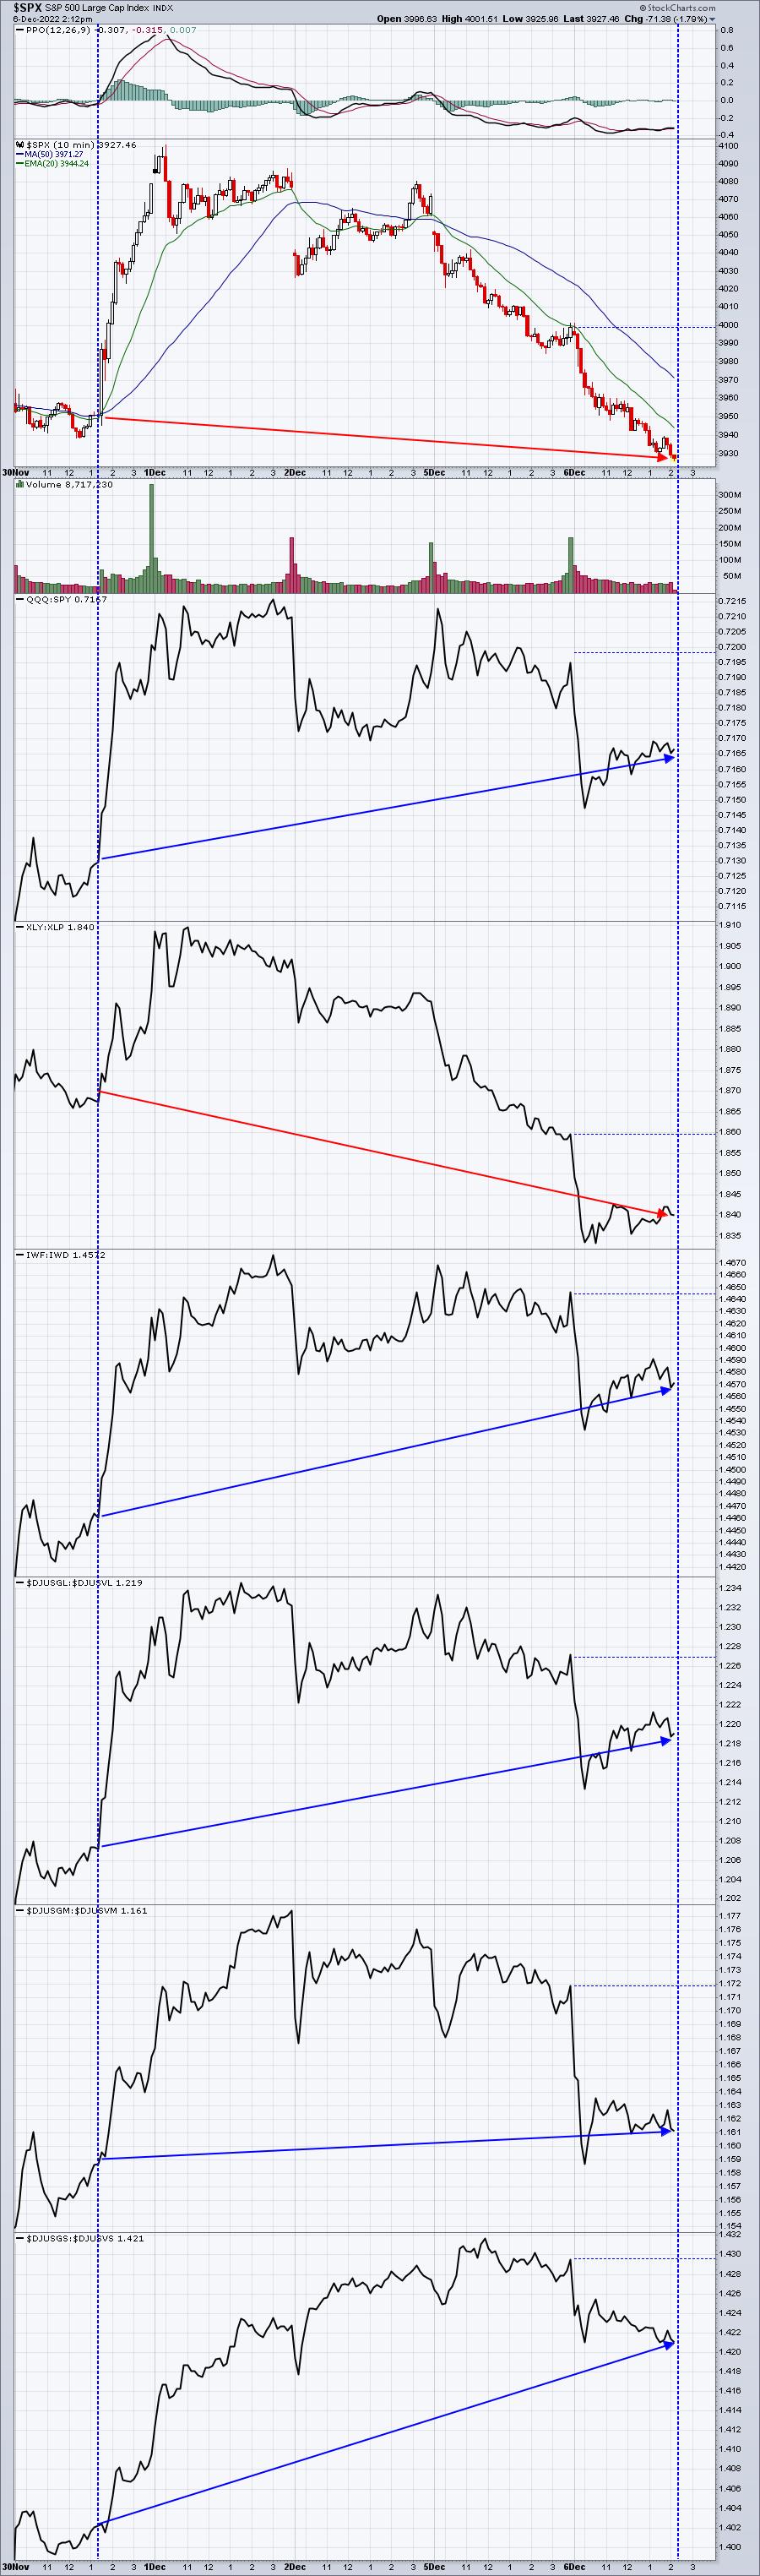
I honestly don't know if this chart will mean anything or not. But if we rally later today and these ratios begin turning up again, I'd consider this a confirming signal of what will likely be a rally ahead. If you believe the stock market is rolling over and heading lower, there's absolute no reason to be rotating into more aggressive areas of the market. Of the ratios provided above, only the XLY:XLP has performed bearishly. All of the others remain well above their relative levels from a week ago.
Happy trading!
Tom