
EB Daily Market Report - Wednesday, December 7, 2022
Executive Market Summary
- Futures were down slightly overnight and we did open slightly negative across our major indices
- At last check, our major indices were trading almost squarely where they were at the opening bell, with little volatility today
- The Volatility Index ($VIX) has been trending higher and it is up 2.8% on the session; more on the VIX below
- The 10-year treasury yield ($TNX) is down another 10 basis points to 3.41%, the lowest TNX reading since mid September
- Productivity was strong and unit labor costs were much weaker than expected, positive signals that inflation is contained; this may be adding to the buying of treasuries, with an accompanying drop in the TNX
- Defensive sectors are outperforming today as health care (XLV, +0.60%) and consumer staples (XLP, +0.39%) are the only two sectors in positive territory
- Meanwhile, most weakness is found in consumer discretionary (XLY, -0.69%) and communication services (XLC, -0.64%)
- Home construction ($DJUSHB, +2.90%) and home improvement retailers ($DJUSHI, +1.39%) are top performers and likely benefiting from the lower 10-year treasury yield
- Toll Brothers (TOL, +6.99%) is surging and testing multi-month price resistance after crushing revenue and EPS estimates
Market Outlook
You should know by now that I turned bullish back in mid-June. I use my all of my technical, fundamental, sentiment, and historical indicators at my disposal to "put together the jigsaw puzzle". I NEVER use these indicators as "guarantees" that we'll see the market move in a certain direction. Instead, I use these signals to help me manage risk. At the beginning of 2022, I felt like the risk of being long was too great, given all of my indicators suggesting that 2022 would be very difficult and challenging. When many signals turn bearish, I change my strategy. I tend to avoid bullish setups and, instead, expect bearish outcomes.
In mid-June, I felt that, given the 25% drop in the S&P 500, the resetting of sentiment, the more bullish rotation into aggressive areas, etc., that the risk profile of the stock market had changed. It was "safer" to get into the market. At the time, the S&P 500 hit its bottom of 3636. Despite moving slightly lower in October to an intraday low of 3491, the S&P 500 currently resides at 3936, 300 points higher. I've traded accordingly, avoiding short positions and looking only at long plays. I've stuck primarily to trades involving the major indices, so the SPY to trade the S&P 500 and the QQQ to trade the more aggressive NASDAQ 100.
We're at a pivotal point on the charts. I still fully expect to see the 3491 low from October hold as long-term support. I also fully expect that we will resume the long-term secular bull market. Perhaps that process has begun. But I won't wear blinders and ignore the constant challenges that we face. I may be wrong. Maybe this IS a secular bear market and maybe it does continue trending lower for many months. I don't believe that's the case, but I don't want to blindly remain in long positions when conditions suggest otherwise. If we finish at or near the lows today, with the VIX surging to new recent highs, it would be a reminder that the market isn't completely safe and caution should be considered. I do not trade or hold leveraged ETFs on the long side when technical failures occur. I don't mind being long and losing money if my indicators suggest that I be long. But remaining in leveraged positions as breakdowns occur is financially irresponsible, in my view. I try to be very consistent about this.
Our first goal, from a long perspective, is to close back above the 20-day EMA. Maybe we'll rally today and close above the 20-day EMA. But if we don't, it'll be the second consecutive close beneath that key short-term moving average and that will not be a good sign. I've been wondering what traders might do heading into the key CPI report on Tuesday and the next Fed meeting on Tuesday and Wednesday. Thus far this week, traders have made it clear. They're not taking any chances.
We all have to make the short-term decisions we're most comfortable with. I continue to believe this is a cyclical bear market. As a result, I'd stay long if my mentality was one of a longer-term investor. As a short-term investor, it comes down to how much risk you're willing to take. I tend to take a more cautious approach until conditions turn more favorable. Right now, I remain long the QQQ. I know that the pattern the past several months has been for the QQQ to perform much better in the afternoon than it does in the morning. Therefore, if I get aggressive at all, it's likely to be in the final 2-3 hours of the trading day. Much of our selling tends to occur at the opening bell and during the first 30-90 minutes. It doesn't mean that pattern will hold true every day, but that's been the undeniable pattern since May. Big selloffs in the afternoon are more worrisome to me than big selloffs in the morning.
Sector/Industry Focus
The Volatility Index ($VIX) has been rising off of its recent test of support just below 20:
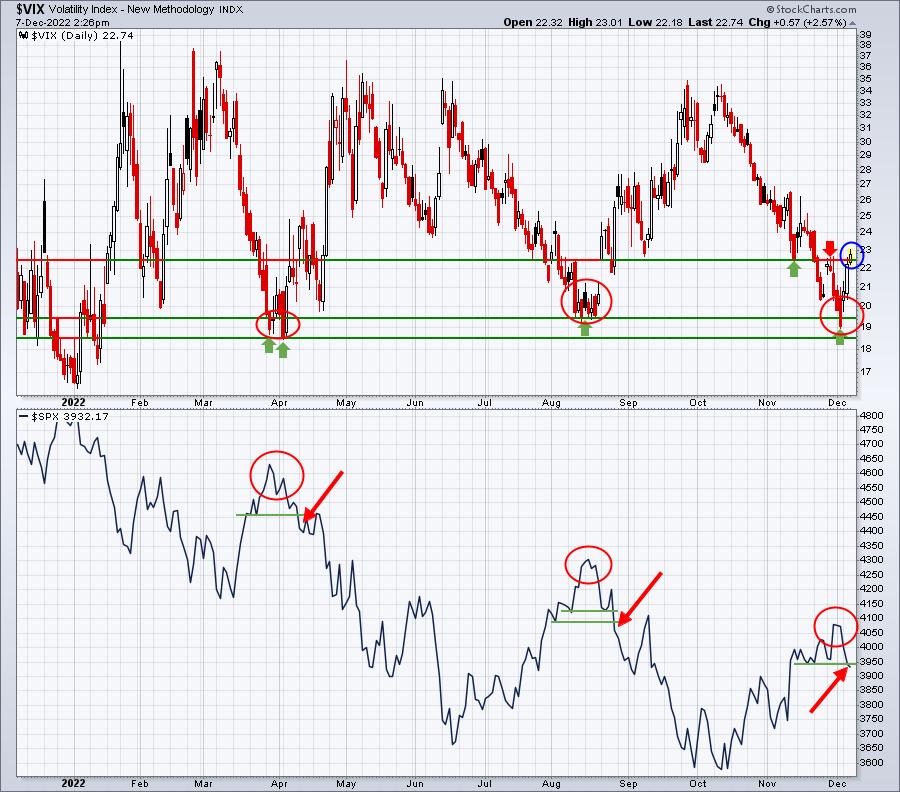
The last two times that the VIX bottomed in the 19-20 range and began trending higher, we saw extended selloffs begin. We know we're already trading beneath key 20-day EMAs across our major indices. If support near 3940 fails to hold, there's really little left until we see the 3860 gap open from November 10th, the day that the October CPI report was released. Failure to hold that level would be a bigger technical failure and could lead to another test of 2022 lows.
ChartLists/Strategies
I review a lot of charts every day and typically run a few scans, looking for solid trading candidates. I haven't pulled the trigger on too many individual stocks as I'm still awaiting a more favorable market. But the 279-280 area has proven to be decent price support on the QQQ lately, so considering stocks as support on key indices are tested isn't a horrible idea. I would just make sure stops are in place in the event the market turns sour later today or later this week. Two days ago, I highlighted BIIB as a solid trading candidate near gap support. After the action the last two days, I feel even stronger about it in the short-term:
BIIB:
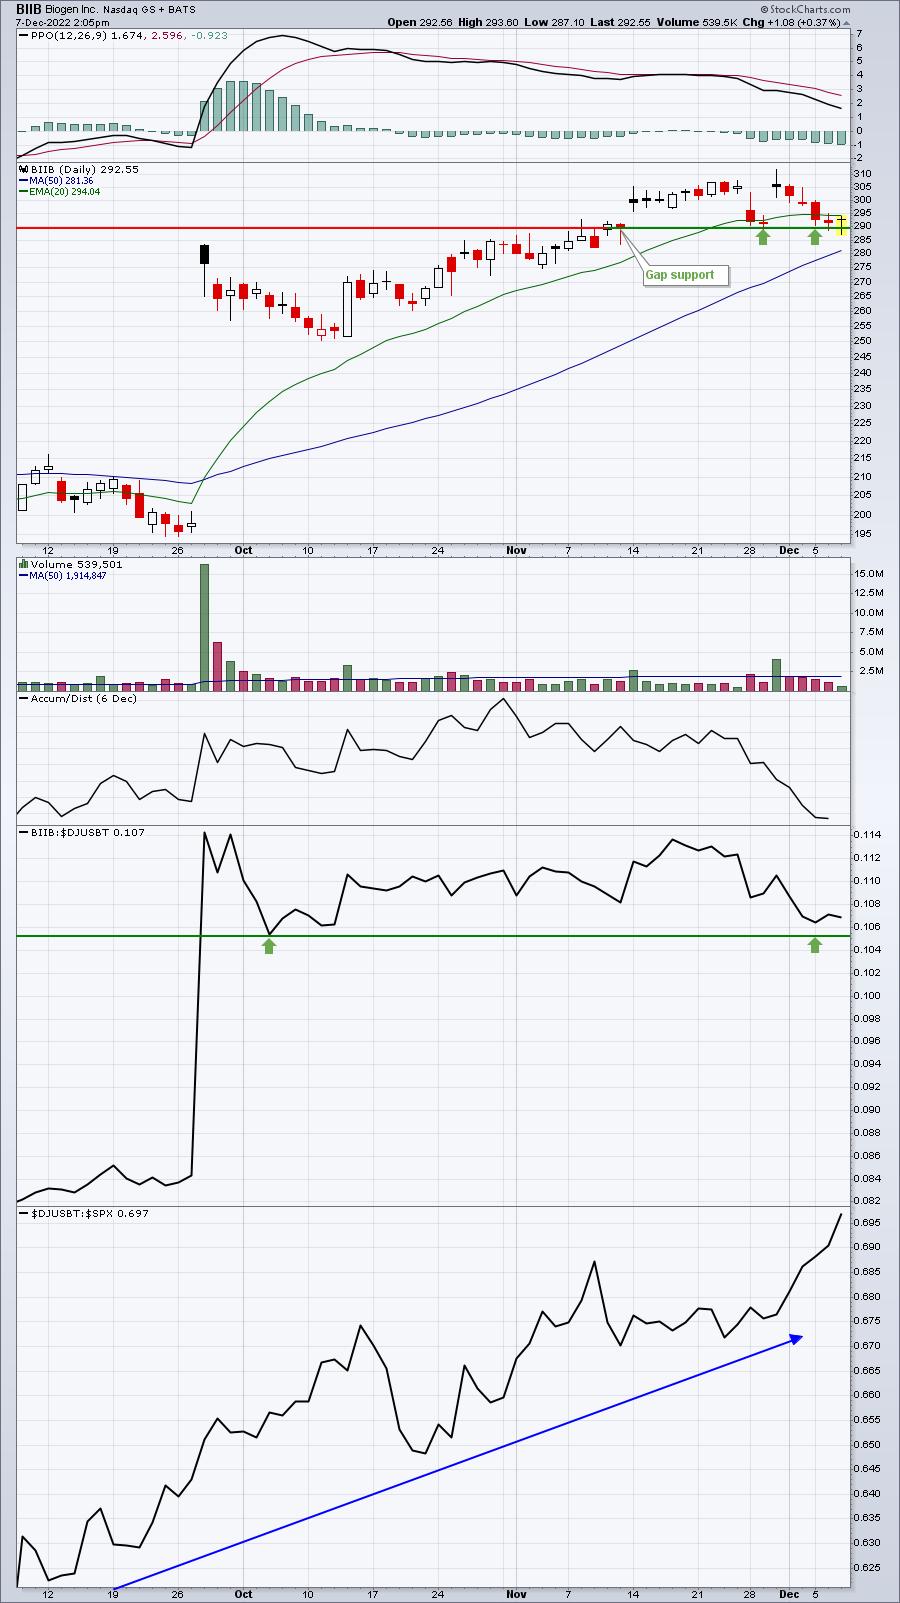
This was the same chart I provided on Monday. The big difference is that today we saw a lower intraday low, which likely triggered stops. But the reversal suggests to me that market makers used the morning weakness to accumulate more shares before a rebound. We'll find out if that rebound assumption is true. Given that intraday low, however, that can now be used as an intraday stop as we move forward. Riding BIIB back up to the 306-307 seems like a solid trading strategy.
Also, over the weekend, I provided several setups in the EB Weekly Portfolio Report. For the past two weeks, I've been providing a number of setups for members to consider. Taking a position is completely up to you, but I am now trying to provide a look at several potential trades every weekend. Last week, I provided UAL, which is a stock in our Model Portfolio. Most of my individual stock trades involve our Portfolio stocks as I believe they represent many of the best stocks in the best industry groups. Jumping in on pullbacks usually makes good technical sense. Despite the bearish market action this week, UAL has performed quite well. Today, it saw morning weakness and tested short-term gap support and also retested the area of its bull flag breakout.
UAL:
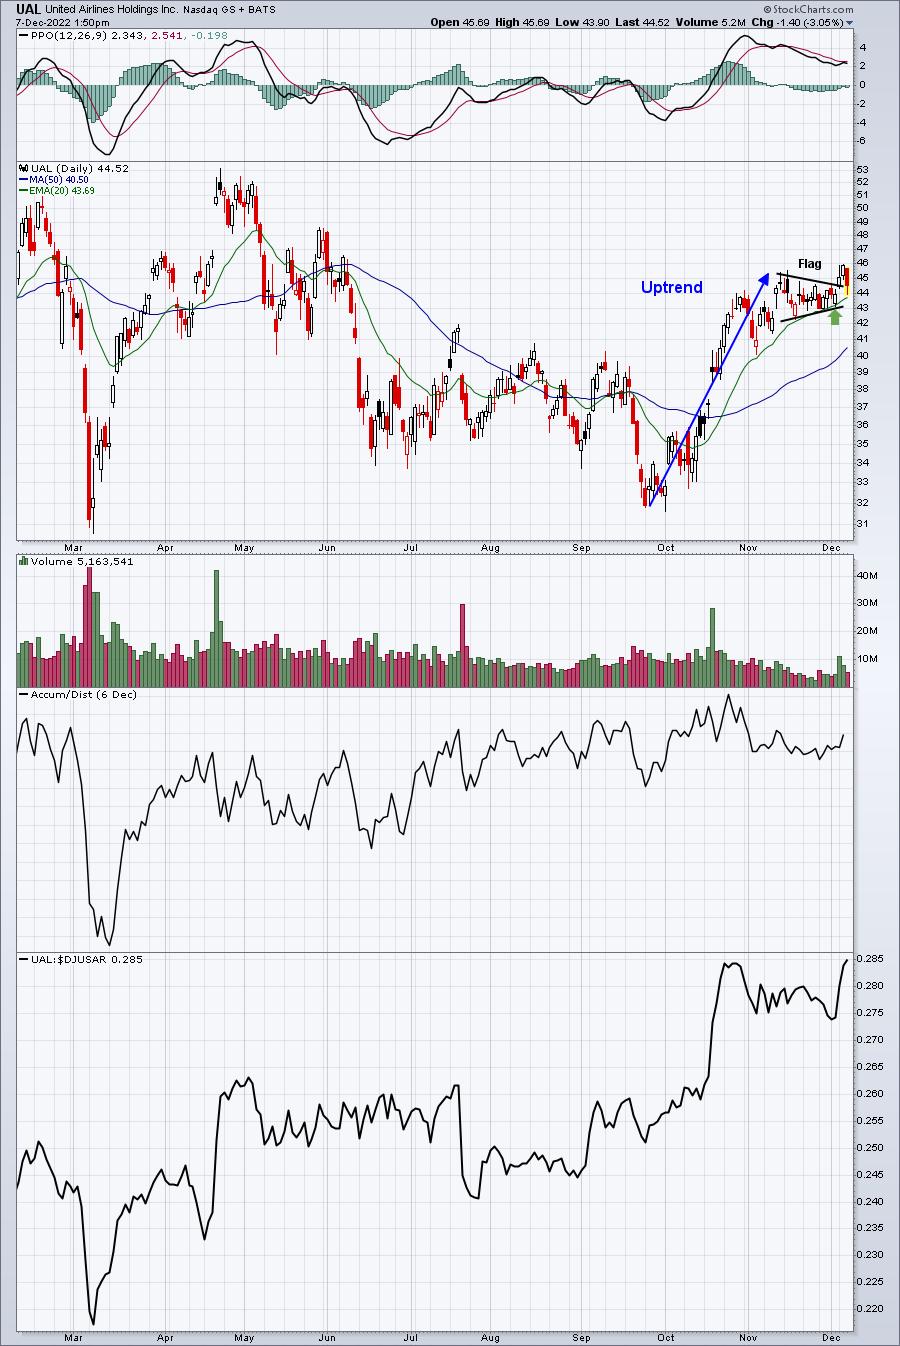
Note also that the rising 20-day EMA is currently at 43.69, just beneath today's intraday low. 43.89 was last Friday's close, so today's low of 43.90 nearly filled the gap to the exact penny. It appears UAL is poised to rise from here, but, as always, we're subject to overall market behavior. Obviously, a major market rally from here would help.
Earnings Reports
Here are the key earnings reports for the next two days, featuring stocks with market caps of more than $10 billion. I also include several companies with market caps below $10 billion. Finally, any portfolio stocks that will be reporting results are highlighted in BOLD. If you decide to hold a stock into earnings, please understand the significant short-term risk that you are taking. Please be sure to check for earnings dates for any companies you own or are considering owning.
Wednesday, December 7:
BF/B, MBLY, CPB, GME, VRNT
Thursday, December 8:
COST, AVGO, LULU, CHWY, COO, MTN, DOCU, CIEN, RH, KFY, PHR
Economic Reports
Q3 productivity: +0.8% (actual) vs. +0.4% (estimate)
Q3 unit labor costs: +2.4% (actual) vs. +3.3% (estimate)
Happy trading!
Tom