
EB Daily Market Report - Quick Update - Thursday, December 8, 2022
I will be unavailable much of today, so I wanted to get a quick update out this morning.
Put Call Ratio
I've had many questions about the high readings of the equity only put call ratio ($CPCE). Here's a chart to show the wild gyrations that we've seen over the past month or so:
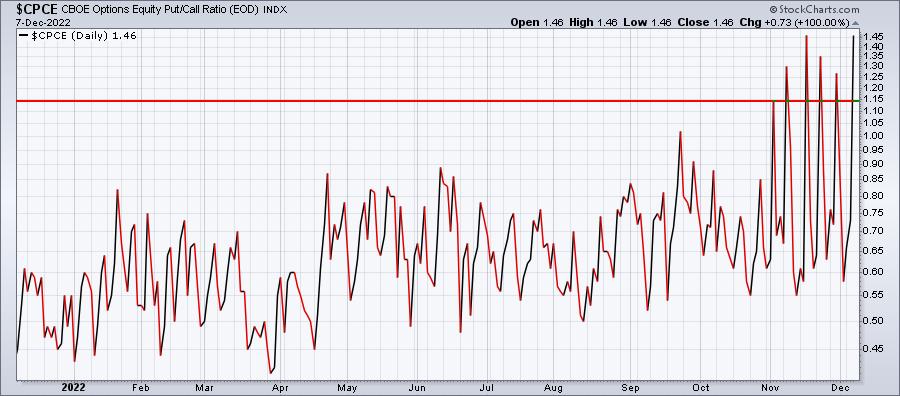
Historically, it has been rare to see readings above 1.0 and EXTREMELY rare to see readings above 1.15-1.20. Yet, since the beginning of November, we have seen 6 readings of 1.15 or higher, including two at 1.46, which are the two highest readings on record. During the financial crisis of 2008-2009, we had one panicked reading of 1.35, which stood at the highest reading ever until the past month. Typically, we see a surge in put activity when the stock market is dropping precipitously. That's the strange part. After the early weakness in November, we've been in rally mode - well, until this week. EXTREME readings on the CPCE make absolutely zero sense when the stock market is gaining ground. Yesterday printed a 1.46 reading, so I went to the CBOE.com website and here's the half hourly readings on the equity only put call ratio yesterday:
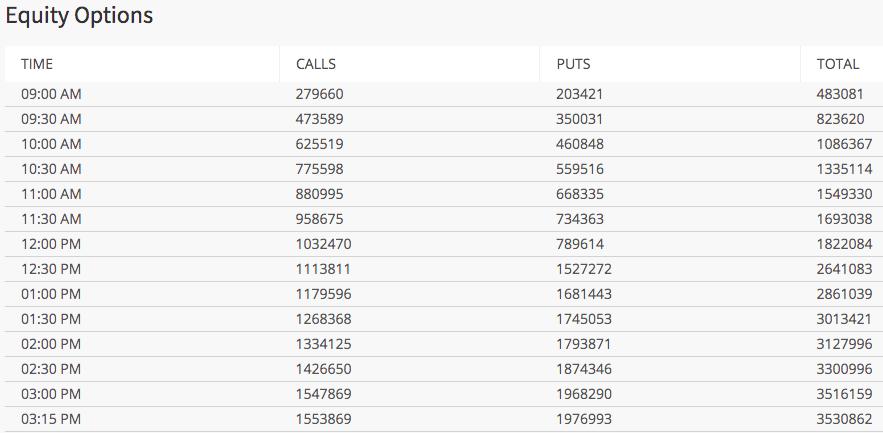
These are cumulative half hour readings. If I put these numbers into an Excel spreadsheet, I can quickly calculate the individual CPCE readings. Check it out:
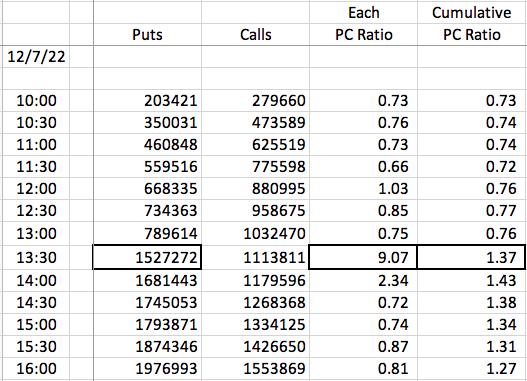
The "Each PC Ratio" column takes the difference between the cumulative puts and calls total of one time (for example, 1:30pm ET), subtracts the previous time's cumulative total (1:00pm ET), and then divides the equity puts for ONLY that half hour by the equity calls for ONLY that half hour. Essentially, it gives us each half hour pc ratio independent of the others. The far right column is CUMULATIVE for the entire day's puts and calls.
The bold outlines highlight the MASSIVE number of equity puts bought from 1:00pm ET to 1:30pm ET. Prior to November 2022, the highest "half hour only" reading that I've ever witness is probably somewhere around 2.0, maybe 2.5. The 9.07 reading is CRAZY. Institutions typically use index options to hedge. They're not generally BIG buyers of individual equities' puts and calls, which makes this huge disparity at 1:30pm ET yesterday so intriguing.
I honestly have no idea what has been happening. This is not the work of retail traders, because there is NO precedence of this type of mass behavior in the middle of the trading day.
Therefore, my takeaway here is to simply ignore these readings until they become more stable. I am likely going to create a User-Defined Index (UDI) at StockCharts, using their readings through October, and then adjust a few of the November readings to a more reasonable level. Going forward, I plan to track intraday activity for awhile to ensure the sanity of the readings. I would caution against using the current $CPCE readings provided by StockCharts.com. They are simply passing along the readings at CBOE, but I believe these readings are skewed.
I'll keep you posted on the updated UDI as appropriate.
Market Action
This morning, futures are pointing to a slightly higher open, with the NASDAQ leading on a relative basis, something that hasn't occurred with much frequency of late. To the upside, watch for breaks back above the 20-day EMA, which would be bullish. To the downside, we're now trading beneath those 20-day EMAs. I believe the biggest levels are the gap opens from November 10th, the day the October CPI was released. If those gap support levels are lost, I believe the selling could intensify short-term.
There are two major things to watch next week. First, we'll get the November CPI on Tuesday morning at 8:30am ET. As we've seen from previous reports, the stock market could move significantly in EITHER direction, depending on the news. Next, the Federal Reserve will meet on Tuesday and Wednesday, with their latest policy statement released at 2pm ET on Wednesday. Again, expect tremendous volatility that afternoon after the Fed's statement.
Happy trading!
Tom