
EB Daily Market Report - Monday, December 12, 2022
Executive Market Summary
- Futures were slightly higher overnight to start this new trading week
- Strength has been mostly in the Dow Jones and S&P 500, with the more aggressive NASDAQ lagging
- Money also has been mostly rotating away from growth and into value throughout the trading session
- Commodities are mixed today as crude oil ($WTIC, +2.97%) jumps; gold ($GOLD, -1.09%), however, continues to straddle the $1800 per ounce line; $1825 per ounce has been resistance since June
- 9 of 11 sectors are higher, but 2 aggressive groups, consumer discretionary (XLY, -0.35%) and communication services (XLC, -0.11%) lag
- Software ($DJUSSW, +1.85%) is having a strong day, helping to lift technology (XLK, +1.15%)
- Higher crude oil prices have helped energy (XLE, +2.13%) stem the tide of recent selling
- Moderna (MRNA, -7.56%) and Tesla (TSLA, -6.00%) are the two worst-performing S&P 500 stocks
Market Outlook
I have received numerous questions recently relating to the outperformance of the defensive sectors and how I view this development. First, for the benefit of those who may not be following, take a look at the one-month sector summary from StockCharts.com:
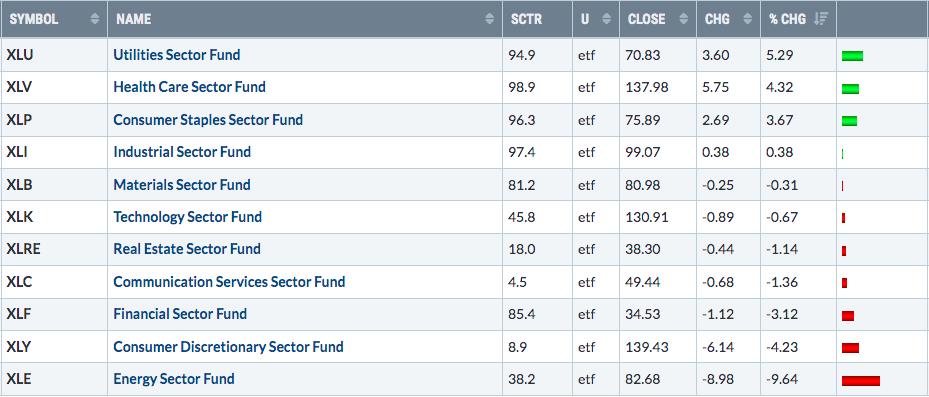
3 defensive sectors are at the top in terms of one-month performance. And it's occurring when the stock market is moving higher. That's not great action. To see it more visually on the charts, check this out:
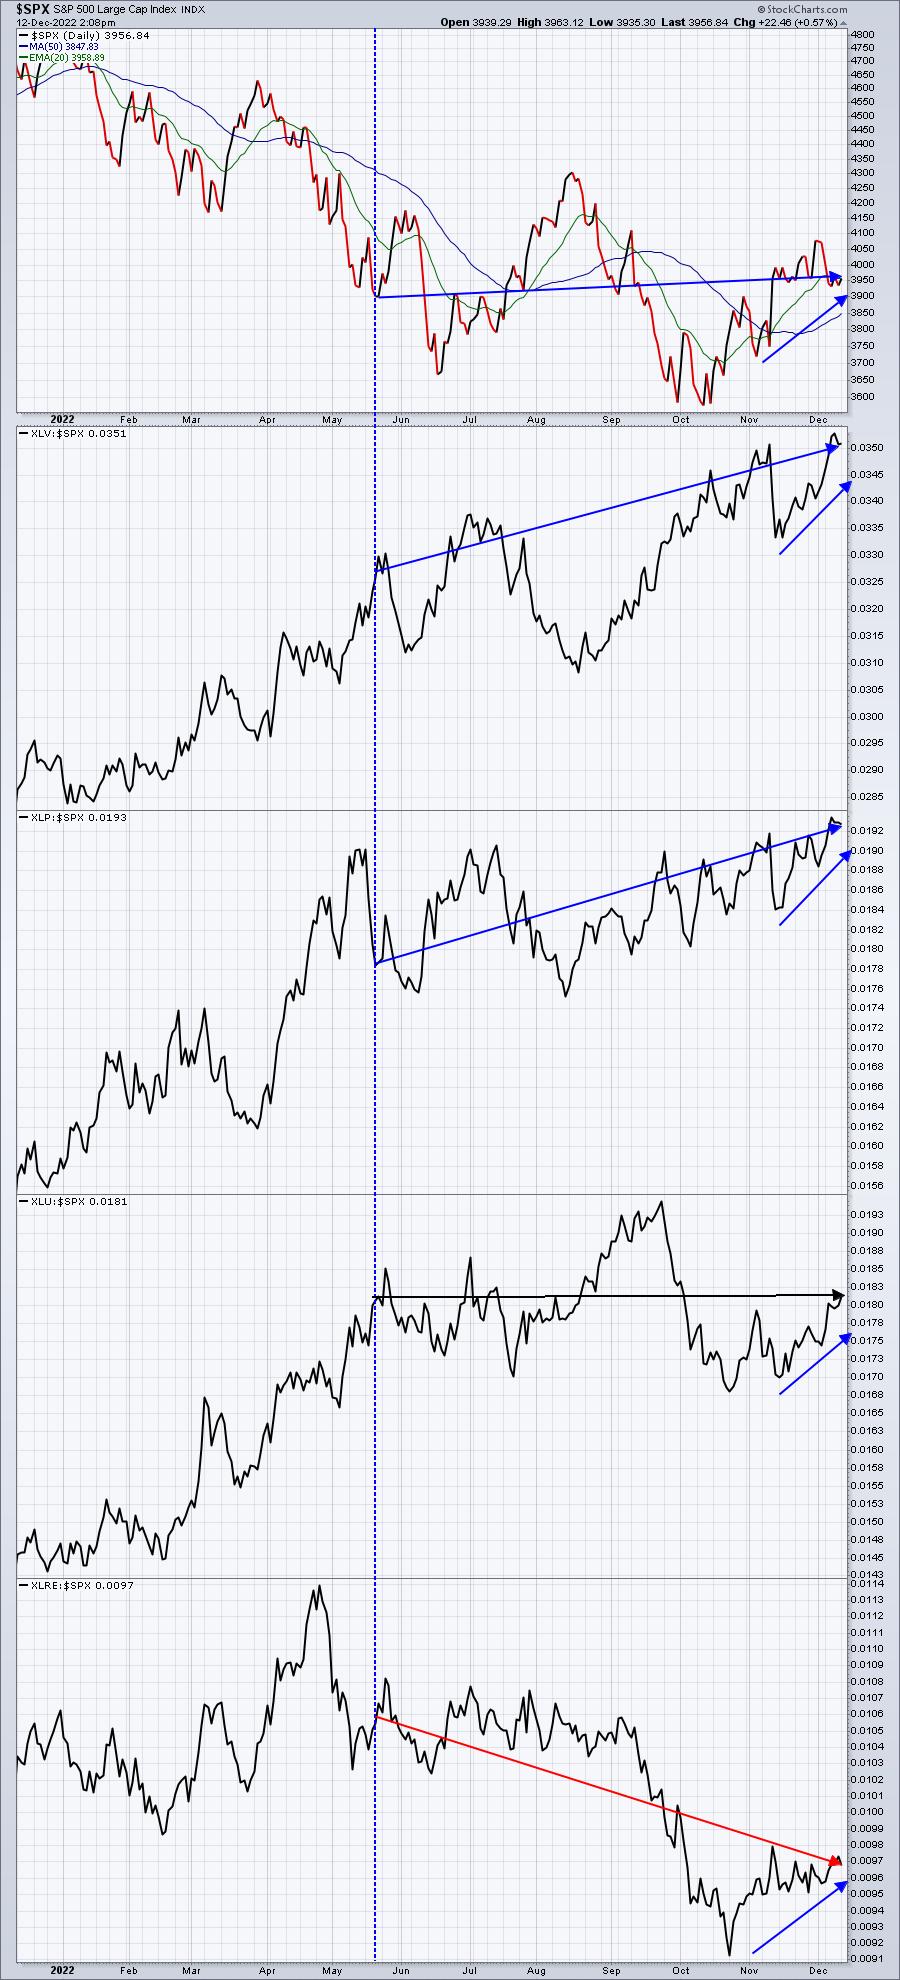
All four defensive sectors are showing relative strength in the past month or two, but if we look back to the May low, which is when money began rotating a bit more bullishly, it's a bit different picture. Real estate (XLRE) is WAY below where it was in May (in relative terms). Utilities (XLU) are about even. Staples (XLP) and health care (XLV) have continued to perform well.
Let me explain the difference now vs. the end of 2021. In both instances, defensive groups performed well during market advances. The advance in 2021 was during a rise to an all-time high in U.S. equities and was a complete change of character as they had been trending lower on a relative basis prior to that. 2022 has seen defensive sectors lead throughout the year. This is no character change. The market is nervous. The surprising part of the leadership at the end of 2021 is that it occurred at the end of an EXTREMELY bullish period. In my opinion, it was a beneath the surface signal showing that Wall Street firms were rotating into defense at a time when no one else was. Right now, EVERYONE is nervous.
The other very significant point is that sector relative strength is just ONE of many SECONDARY indicators. I don't base my long-term directional strategy on one secondary indicator. To do so is applying BIAS, in my opinion. We can always find something that's bearish and pointing to it when it's convenient isn't likely to yield the results you're looking for. At the end of 2021, there were MANY factors that suggested the market was potentially topping. Defensive sector strength was just one. Here were some others:
- Negative divergences on the hourly, daily, and weekly charts (the weekly was the most damaging)
- The S&P 500's 22-month rate of change (ROC) reached 115%, the biggest such 22-month move in this benchmark index since the 1930s. It was unsustainable.
- The equity only put call ratio ($CPCE) reached EXTREME levels on its 5-day and 253-day moving averages. We needed a reset.
- Growth vs. value ratios were providing warnings across large, mid, and small cap stocks
- In January 2022, the mega cap growth stocks began crumbling
When I make bold topping or bottoming calls, it's generally because a number of factors tell me to do so. Sentiment, which was the BIGGEST issue heading into 2022, is no longer a problem. If anything, it's becoming a problem for the bears as there's so much negativity right now. Most who have wanted to sell have sold.
I don't want to downplay the significance of sector rotation and leadership, because it is a big deal. But we need a lot of corroborating evidence to completely figure out the stock market jigsaw puzzle. Be careful picking out one or two that support a cause. Going back to that earlier list, there are now positive divergences suggesting that bottoms could be forming - rather than the negative divergences that we saw late in 2021. The 22-month ROC is now at 2.35%, a far cry from 115%. By the way, the average annual return on the S&P 500 is 9%. So I'd be looking at a 22-month ROC closer to 17% as average. Higher readings would be too much bullishness, while lower readings would be too much bearishness. Again, we're at 2.35%. The 2022 cyclical bear market has taken care of this problem. Recently, this 22-month ROC moved into negative territory, the second lowest reading since 2010. That would be more bullish for equities than bearish. The options world is incredibly bearish and our 5-day and 253-day moving averages of the equity only put call ratio ($CPCE) suggest a bottom is likely approaching, not a top. The growth vs. value ratios have given us mixed signals since mid-year 2022.
My point here is that many other secondary indicators are MUCH, MUCH DIFFERENT than they were at the end of 2021. Let's take the defensive sector leadership for what it is - a potentially bearish secondary signal that is NOT confirmed by most other secondary signals.
Sector/Industry Focus
The 10-year treasury yield ($TNX) is on the rise and nearing its 20-day EMA resistance. I'm not at all surprised to see a reversal in the TNX recently. After lots of treasury shorting that sent yields soaring, I believe it's been a ton of covering that's led to the recent TNX decline. As we approach two key announcements - the November CPI to be released tomorrow morning at 8:30am ET and the 2-day Fed meeting that culminates with its latest rate hike and policy statement on Wednesday at 2pm ET - shorts are probably piling back into the treasury market, likely believing there's little risk that yields keep moving lower. Here's the daily chart, showing the recent bounce:
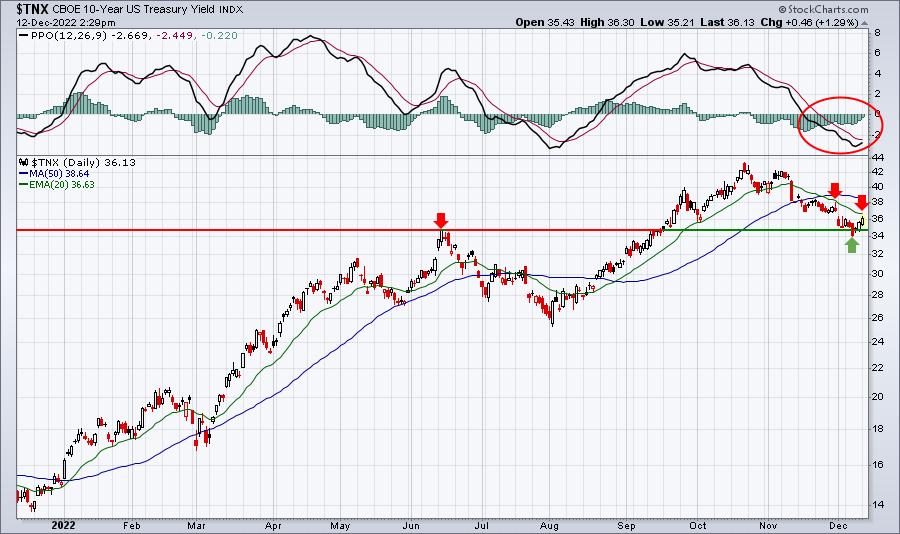
The range to watch in the near-term, especially the next two days, is support at last week's low of 3.41% and resistance at the declining 20-day EMA at 3.66%.
ChartLists/Strategies
To take on new individual stock positions today is truly the equivalent of gambling. Personally, I will own ZERO individual stocks at today's close. It may turn out to be a very wise move or maybe not. But I don't think it's financially responsible to be heavily invested on either the long or short side - as a short-term trader. I still fully expect that U.S. equities are heading higher in 2023, so I'd be fine holding stocks for the long-term. I'm talking about the very near-term. I need a more stable market to trade individual stocks like I did in 2021. Again, I believe the market bottom is in, but that doesn't mean we won't continue to have a lot of whipsaw action. Personally, my only position is likely to be the QQQ at the close today and I'll be deciding late this afternoon how much I'll invest. It'll likely be somewhere in the 50-75% range, leaving plenty of cash to take advantage of any trading opportunities that might arise from the next couple days. If the market takes off, I'll participate to some degree in that too. It's simply a compromise, respecting the short-term risks present.
Earnings Reports
Here are the key earnings reports for the next two days, featuring stocks with market caps of more than $10 billion. I also include several companies with market caps below $10 billion. Finally, any portfolio stocks that will be reporting results are highlighted in BOLD. If you decide to hold a stock into earnings, please understand the significant short-term risk that you are taking. Please be sure to check for earnings dates for any companies you own or are considering owning.
Monday, December 12:
ORCL, COUP
Tuesday, December 13:
ABM, BRZE, PLAB
Economic Reports
None
Happy trading!
Tom