
EB Daily Market Report - Tuesday, December 13, 2022
Executive Market Summary
- Futures were up overnight and then exploded higher when the November CPI data came in below expectations
- Heavy buying was replaced by heavy selling in the first 30 minutes of trading, though, as the whipsaw action has been crazy
- The Volatility Index ($VIX, -6.36%), which closed yesterday at 25.00, cratered to 21.50 at the open, but has been rebounding much of the day and is currently at 23.40
- Meanwhile, the 10-year treasury yield ($TNX) is just above 3.50%, down 10 basis points, after earlier touching a low of 3.42%
- Cryptocurrencies are having a nice day as etherium ($ETHUSD, +4.70%) and bitcoin ($BTCUSD, +3.63%) gain ground; I still believe etherium looks better than bitcoin on a relative basis
- The dollar (UUP, -0.88%) is setting a fresh 4-month low after the CPI report; gold ($GOLD, +1.71%), which tends to move in the opposite direction, is doing just that
- Crude oil ($WTIC, +3.25%) is back above $75 per barrel and energy (XLE, +1.96%) is now today's best-performing sector
- Consumer stocks are weak as consumer discretionary (XLY, -0.26%) reverses after a significant gap higher
- Moderna (MRNA, +24.11%) is soaring today after indicating that a cancer vaccine shows promise
- Airline stocks ($DJUSAR, -5.42%) reversed big time after this morning's gap up
Market Outlook
November CPI data is in. It was lower than expected and we can now update our core CPI inflation chart ($$CCPI) with that latest monthly report. I will show you two charts, the first will be a long-term chart, so that you can compare the annual rate of inflation (and the monthly readings) vs. history. The second will zero in on the past few years in order to see those monthly changes more closely:
$$CCPI (long-term):
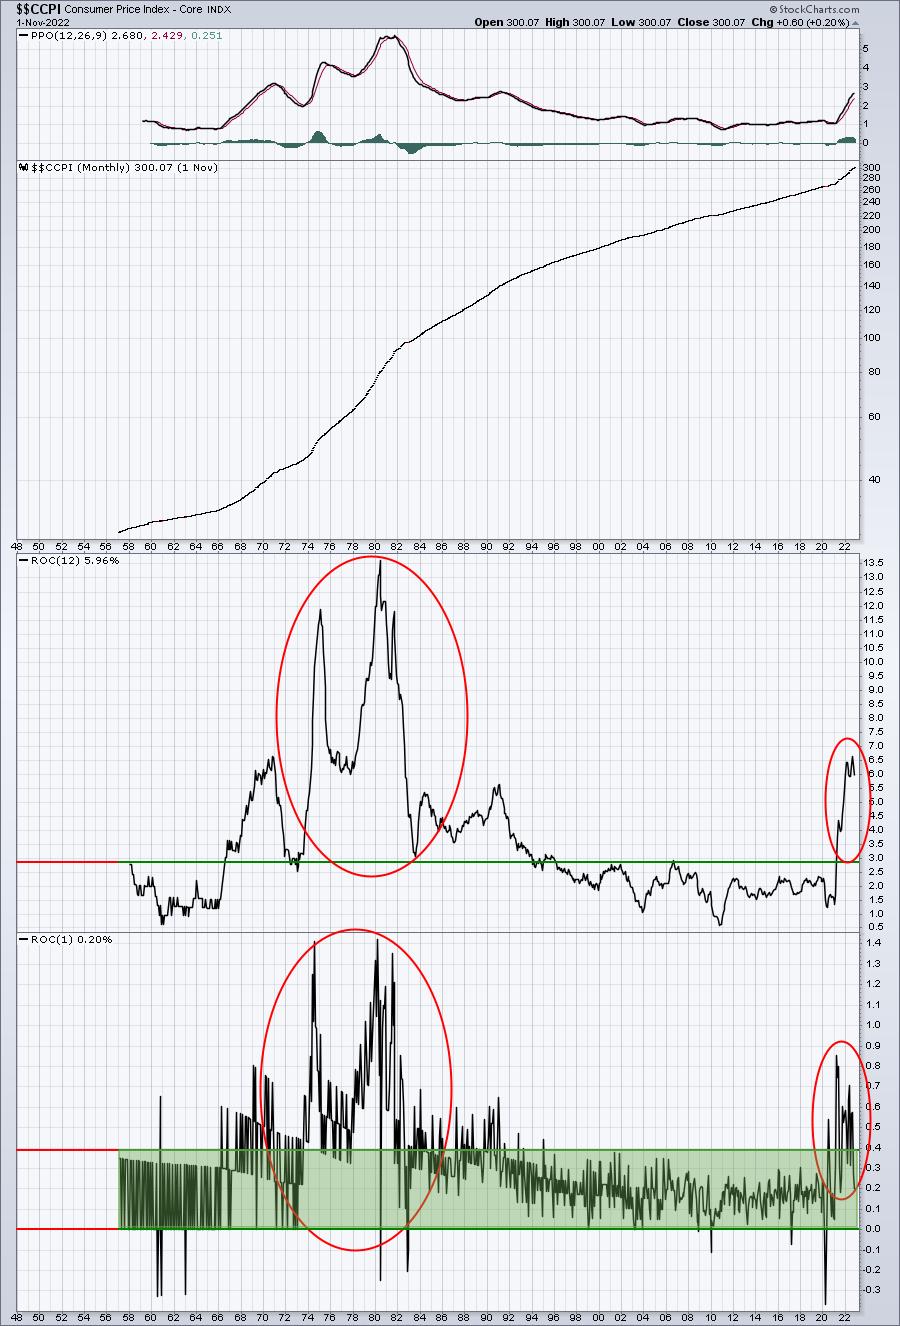
The media is constantly telling us that inflation is the worst in 40+ years, trying to somehow convince us that we're heading for the hyperinflation of the 1970s. That is not the case and the above shows you visually the difference. The green-shaded area in the bottom panel highlights the "normal" monthly ROC for Core CPI, essentially from flat to +0.4%. I believe it's notable that we've now seen two consecutive monthly readings back in this normal range.
$$CCPI (short-term):
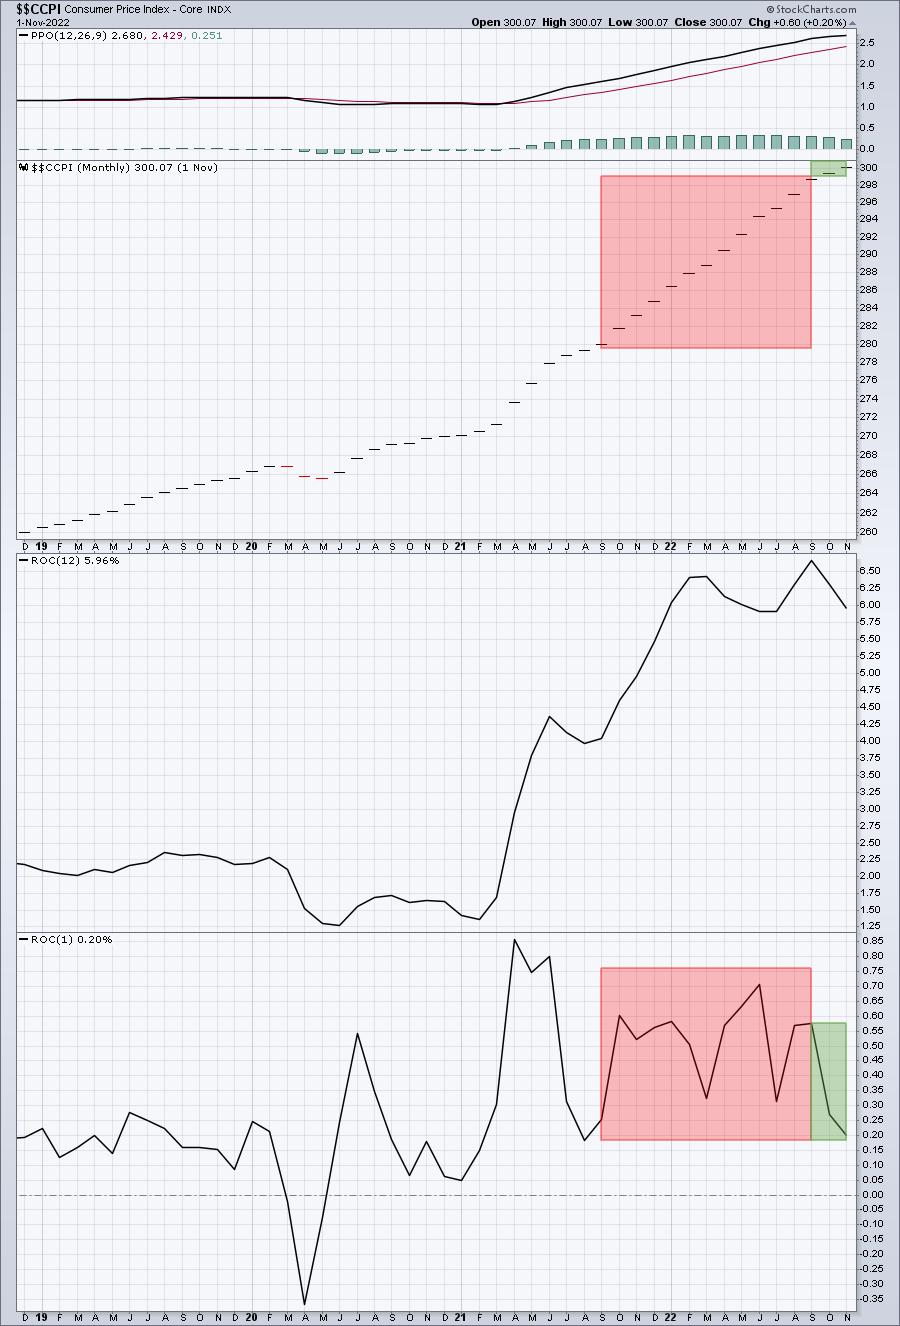
The red-shaded area highlights the larger inflationary spikes that occurred for a year, sending the annual rate to its recent high. But the last two readings have been much milder, moving back down to the more palatable +0.2%-+0.3% range. Here's a critical takeaway from the above charts. As more monthly inflation data is released in 2023, every month's core inflation rate will be added to the 12-month calculation and the core inflation rate from a year earlier will be removed. If we continue to see lower readings like the ones we've seen the past two months (green-shaded area), the annual rate of inflation will continue to drop, triggering what I believe is likely to be a massive rebound in U.S. equities in 2023.
Sector/Industry Focus
U.S. equities gapped up significantly this morning, but have since given up most of those gains. The bond market, however, is suggesting that a move lower in interest rates is quite likely. We saw the 10-year treasury yield ($TNX) quickly move down to test recent lows this morning. While we've seen a slight reversal, the TNX downtrend remains in play and I interpret this to mean that we're going to be seeing a lower TNX in 2023. If that's the case, then any short-term volatility and weakness in equities isn't likely to last. Here's today's TNX drop on a year-t0-date chart:
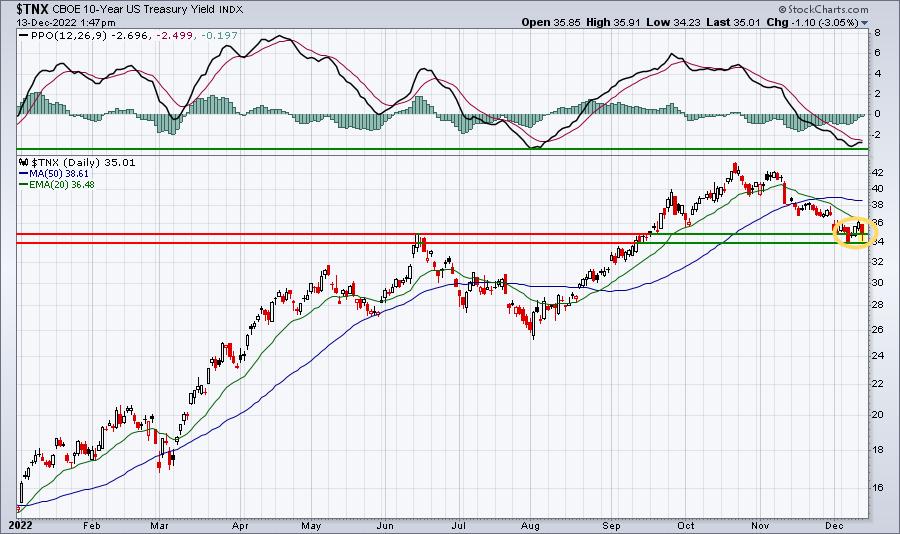
As I look at this chart, my question is do we (1) break out above the declining 20-day EMA or (2) break down beneath 3.40%. That answer could provide us the clues about whether the stock market bottom is in. I believe it is.
ChartLists/Strategies
I believe today is Step 1 in creating a better environment for equities in the second half of December and into 2023. We saw much-better-than-expected November CPI data, which gives the Fed a second consecutive month of such benign readings. I do not believe that will completely satisfy the Fed, so I do look for another hike tomorrow - probably 50 basis points. But the Fed's wording could turn more dovish and they might lay out a plan where the rate hikes cease. If so, that could be a catalyst for a BIG move higher to close out the year. We'll soon find out.
In the meantime, I think it's a good idea to remain somewhat cautious. I definitely prefer the long side at this point, but leverage is something that I'll stay mostly away from. I did add a bit of the leveraged ETFs that track the NASDAQ 100 a few moments ago, and I'm much more heavily invested now than I was at yesterday's close. One of the big wild cards (November CPI) has been removed, so I'm willing to take on a bit more risk.
As far as individual stock trades go, I laid out several setups in Sunday's EB Weekly Portfolio Report for those interested. Personally, I'm sticking with ETFs, but for those looking for more risk, you could consider those setups.
Earnings Reports
Here are the key earnings reports for the next two days, featuring stocks with market caps of more than $10 billion. I also include several companies with market caps below $10 billion. Finally, any portfolio stocks that will be reporting results are highlighted in BOLD. If you decide to hold a stock into earnings, please understand the significant short-term risk that you are taking. Please be sure to check for earnings dates for any companies you own or are considering owning.
Tuesday, December 13:
ABM, BRZE, PLAB
Wednesday, December 14:
LEN, TCOM, NDSN
Economic Reports
November CPI: +0.1% (actual) vs. +0.3% (estimate)
November Core CPI: +0.2% (actual) vs. +0.4% (estimate)
Happy trading!
Tom