
EB Daily Market Report - Wednesday, December 14, 2022
Executive Market Summary
- Futures were flat this morning as the market braces for today's FOMC policy statement
- Fed Chief Powell will announce the latest interest rate hike (likely 50 basis points) at 2pm ET
- Powell's thoughts on future rate hikes and the pace of those hikes will likely have a profound effect on near-term trading
- The market tends to be EXTREMELY volatile after these policy statements and many times there are multiple moves, potentially large, in both directions
- Commodities are mixed, though crude oil ($WTIC, +2.93%) continues its recent surge; energy shares (XLE, +0.35%), however, are not really keeping pace
- Industrials (XLI, +1.07%) are leading the way today as transports ($TRAN, +1.67%) rise; truckers ($DJUSTK, +1.94%) are the best-performing area within the industrials
- Communication services (XLC, +0.02%) is not really participating, despite a nice move higher in internet stocks ($DJUSNS, +1.15%)
- Moderna (MRNA, +7.43%) is having another huge day on heavy volume to lead the S&P 500 higher
- ON Semiconductor (ON, -3.94%), one of our portfolio stocks, is a laggard today and is testing key short-term price resistance at 67.50
Market Outlook
For today, just a reminder. Here's how the S&P 500 December performance breaks down since 1950:
- December 1-15: +2.82%
- December 16-31: +35.68%
During the period December 1 through December 15, the S&P 500 has risen 390 out of 764 trading days (51.05%), while it's risen 430 out of 741 trading days (58.03%) in the second half of December. The percentage of up days across the entire year, dating back to 1950, is 53.40%.
While this provides us NO guarantees as to future market direction, it does highlight the trends established over 72 years. Today is December 14th, so this Friday will mark our transition from the weaker half of December to the much more bullish 2nd half.
Sector/Industry Focus
I'd like to think that we think outside the box at EarningsBeats.com. We realize that "news" and media outlets are nothing more than opinions. We cannot just take this information at face value. We need to do our own independent research and determine what's TRULY happening based on the flow of money on the charts. While I'm not a big conspiracy theorist, I do believe that, given the amount of money in the U.S. stock market, there's plenty of manipulation that tilts the odds in the favor of the big Wall Street firms. I call it legalized thievery, because this manipulation comes at the expense of retail investors and traders - mostly the latter. Instead of simply accepting this manipulation and the trading losses that result, we use our independent and proprietary research to benefit from it. We pass this information on to our members in hopes that you can benefit from it too.
I've updated my intraday QQQ:SPY ratio chart through yesterday's close. The name of the User-Defined Index that I chose was "@SPYQQQ", but the ratio is actually based on the QQQ intraday action divided by the SPY intraday action. If we include the opening gaps, the QQQ:SPY relative ratio broke down well beneath the May low. But if you look at the intraday QQQ:SPY relative ratio, you'll see a much different story. It suggests that these gaps are nothing more than short-term manipulation and that money continues to rotate into the more aggressive QQQ. Check this out:
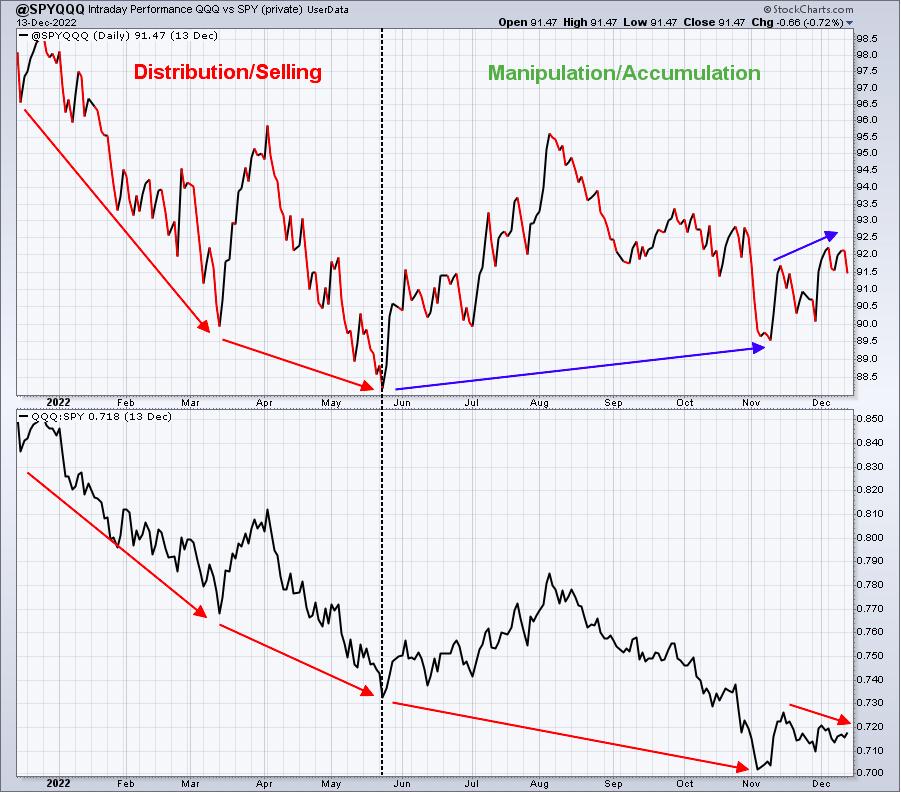
Again, while that top panel shows @SPYQQQ, it's actually the intraday relative ratio of the QQQ:SPY. Unlike the bottom panel, it ignores the opening gaps (potential manipulation). Notice that the bottom panel is suggesting that conditions are worsening as the QQQ:SPY falters. But, by eliminating the manipulative gaps, you can see in the top panel that growth stocks are actually improving.
You won't hear anyone discussing this on CNBC, I can assure you.
ChartLists/Strategies
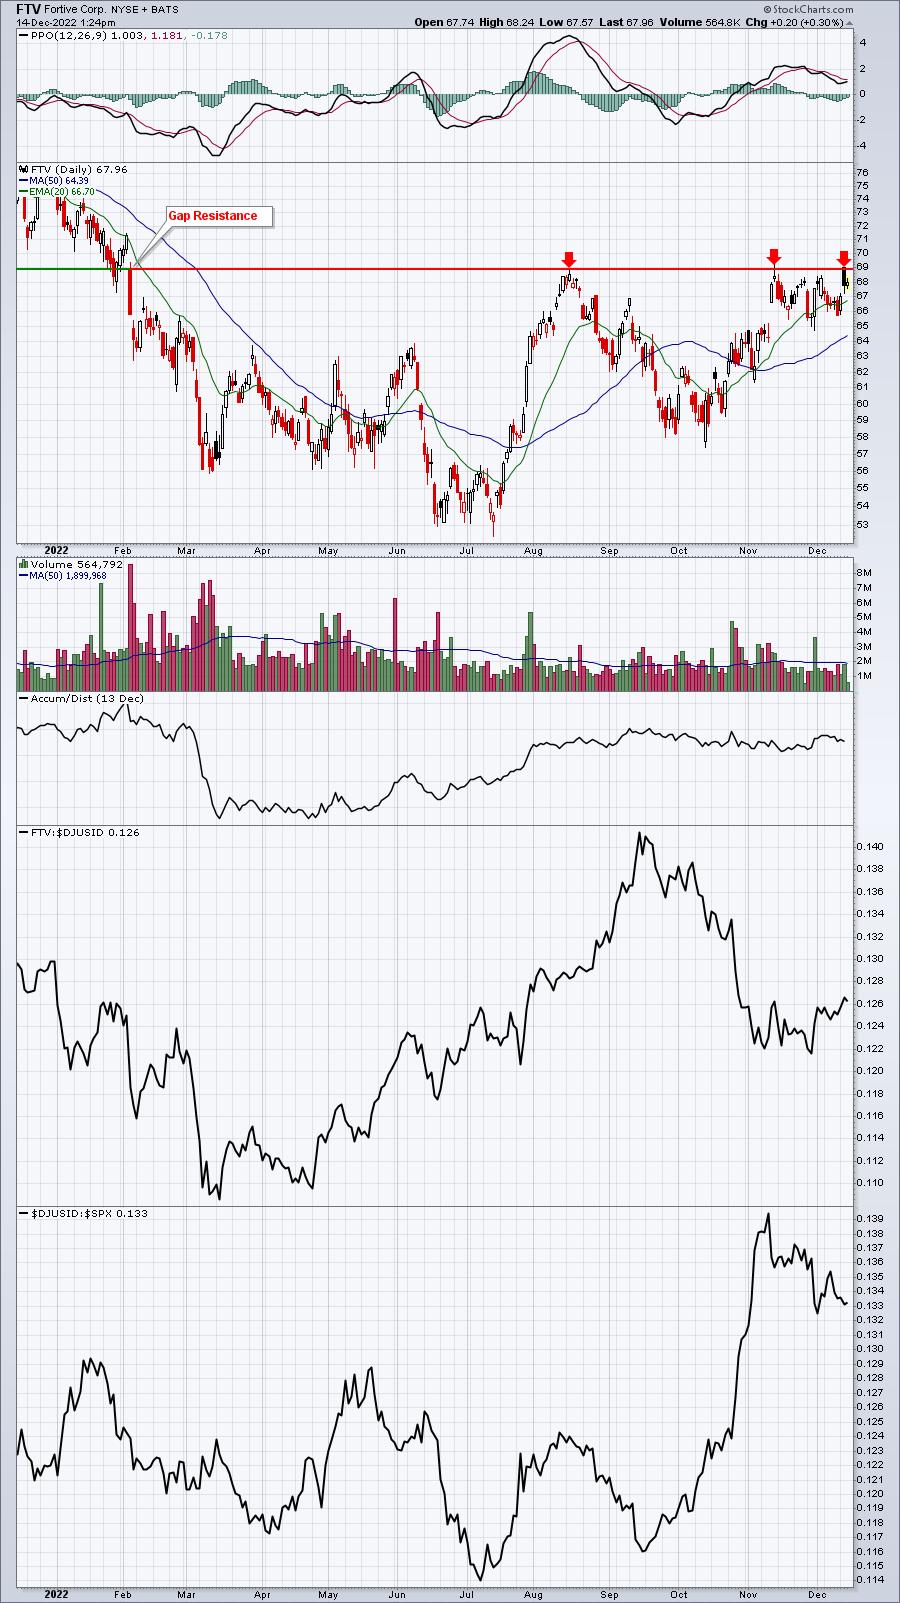
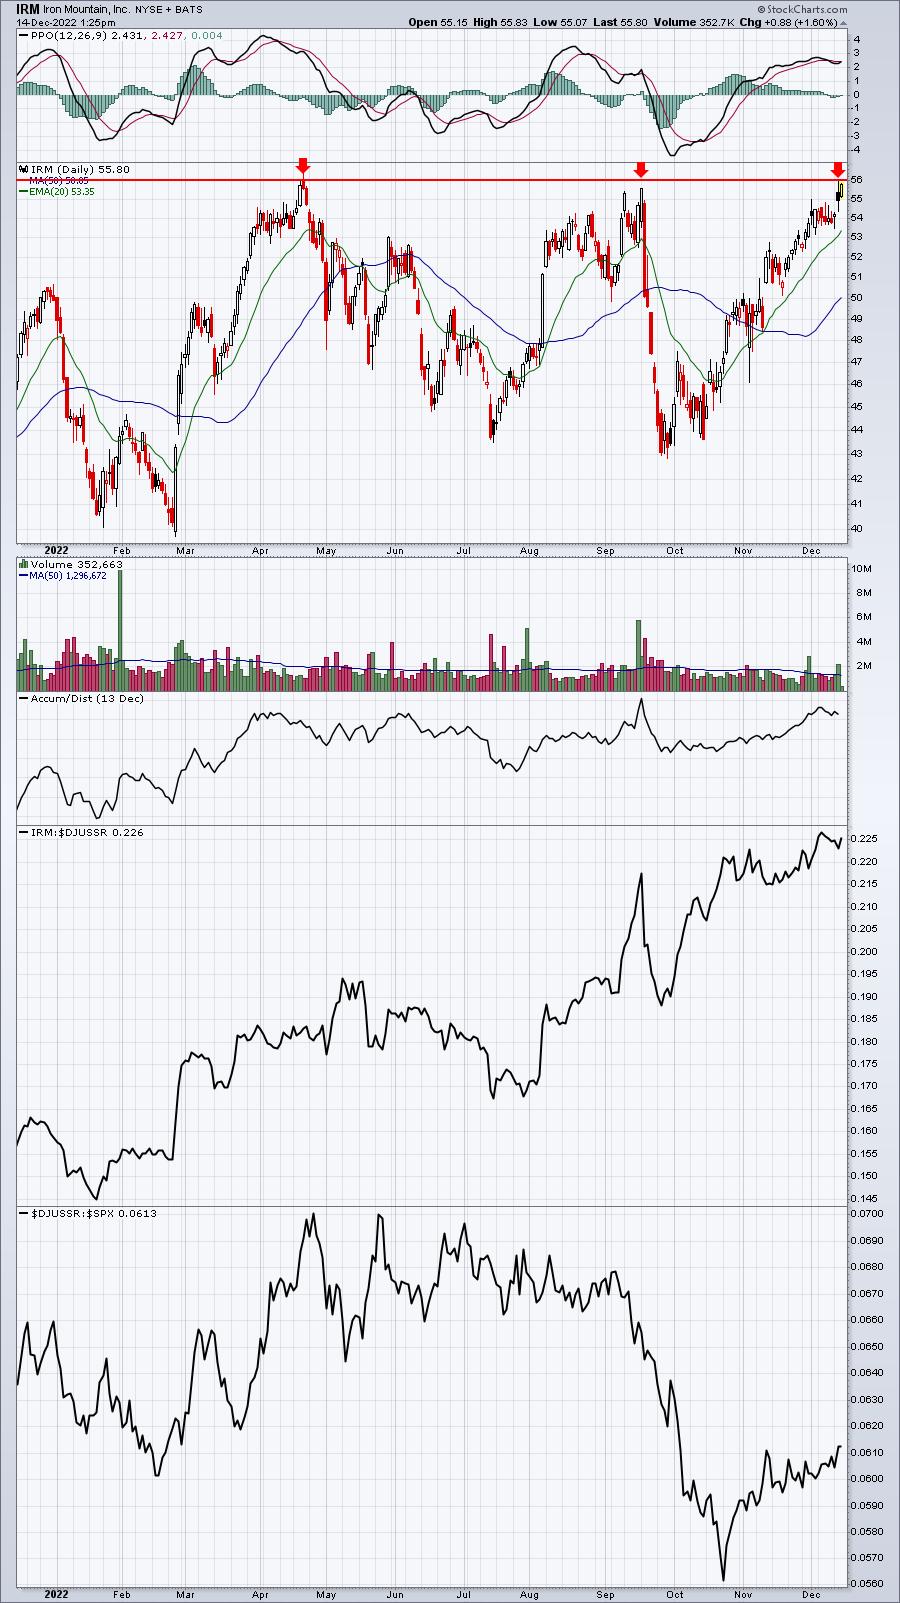
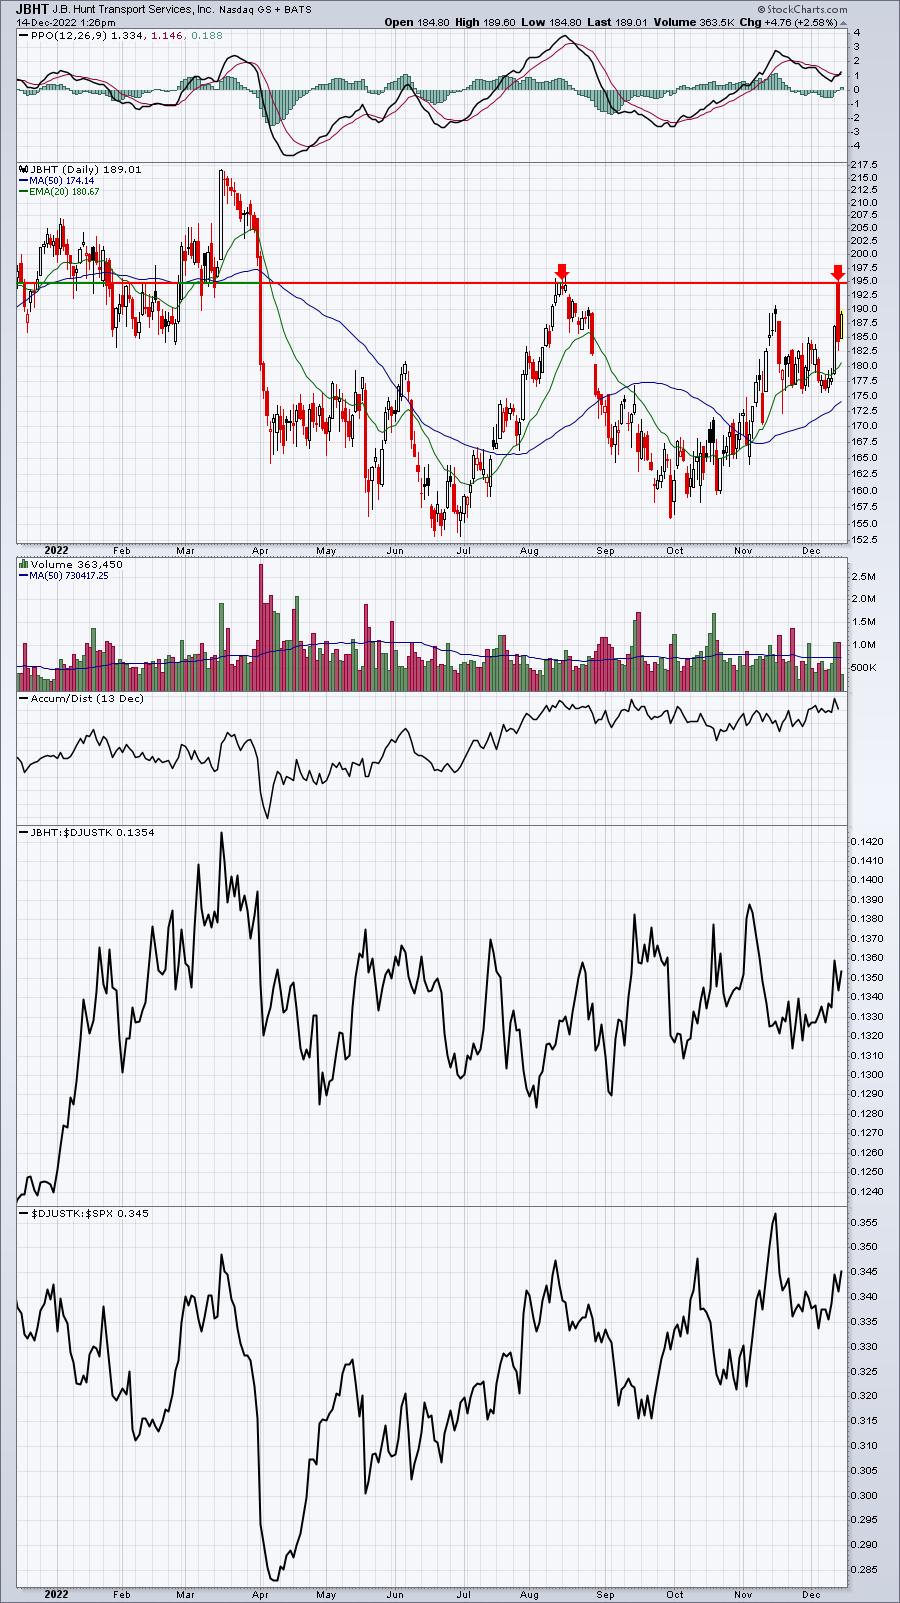
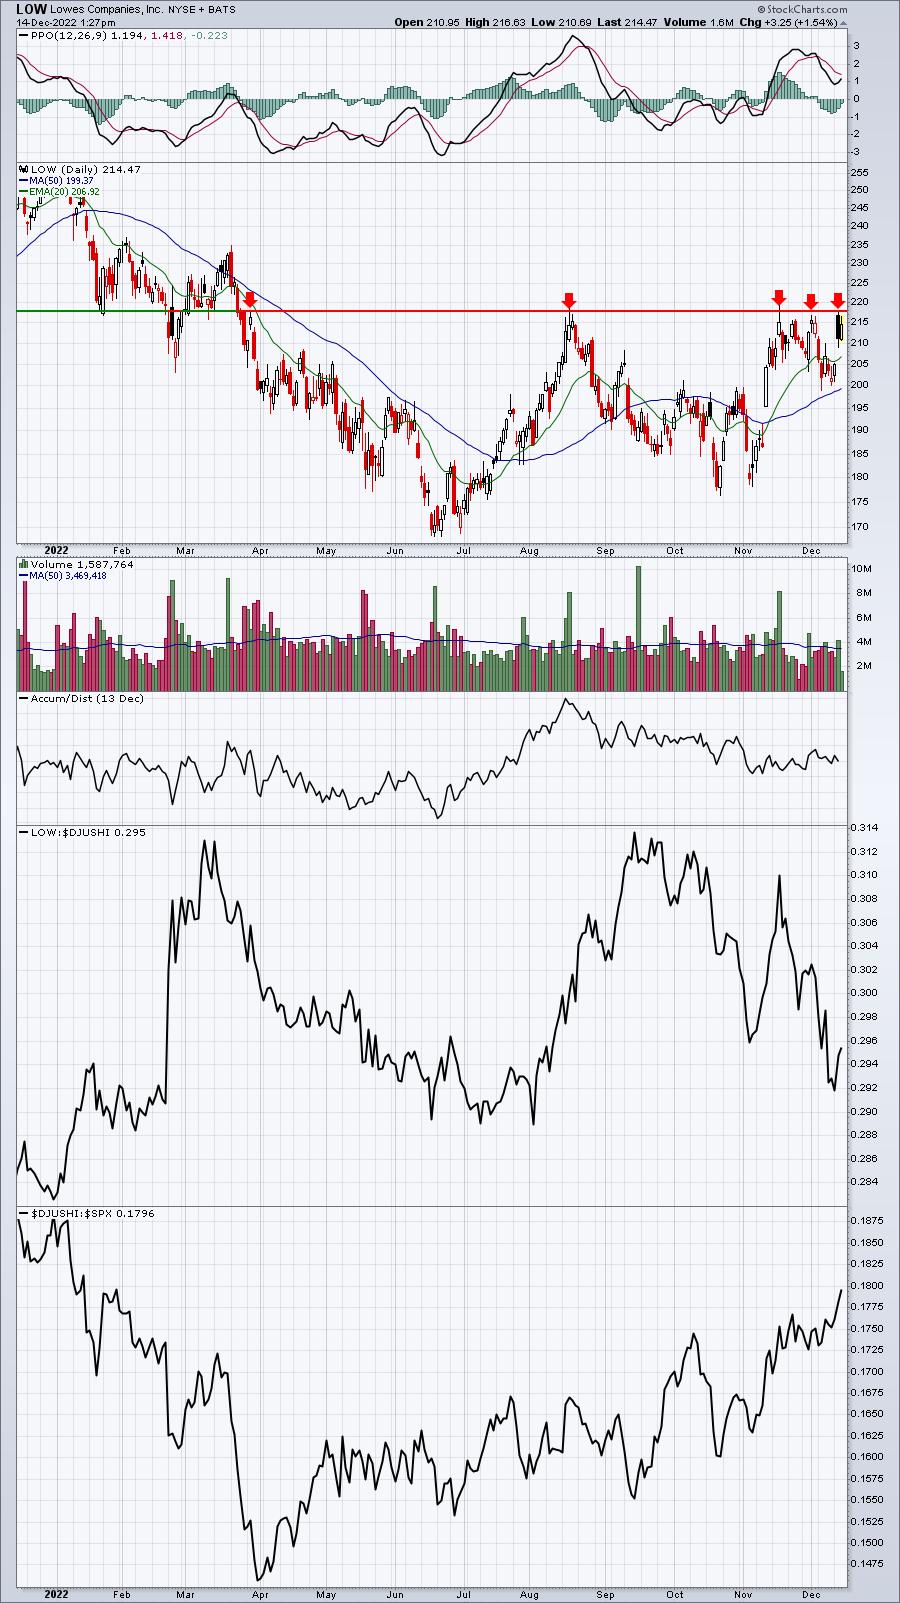
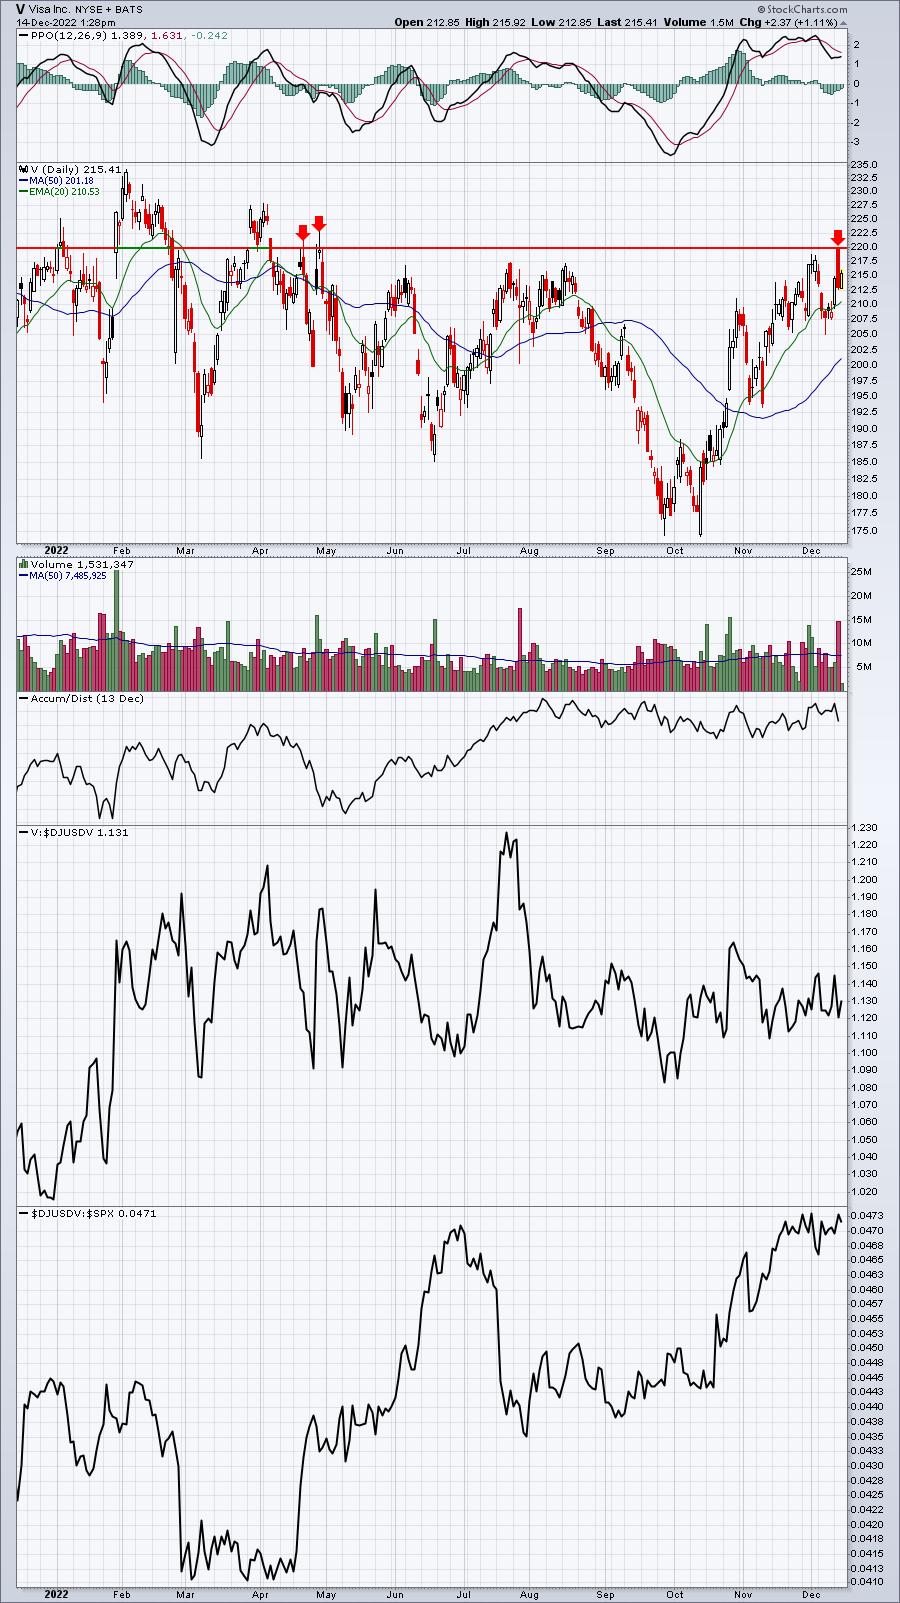
The following are stocks that look interesting to me and are improving, but can they make key breakouts? A picture is supposedly worth a thousand words. I think that holds true here. Price resistance on all 5 is fairly obvious:
FTV:
IRM:
JBHT:
LOW:
V:
Earnings Reports
Here are the key earnings reports for the next two days, featuring stocks with market caps of more than $10 billion. I also include several companies with market caps below $10 billion. Finally, any portfolio stocks that will be reporting results are highlighted in BOLD. If you decide to hold a stock into earnings, please understand the significant short-term risk that you are taking. Please be sure to check for earnings dates for any companies you own or are considering owning.
Wednesday, December 14:
LEN, TCOM, NDSN
Thursday, December 15:
ADBE, JBL
Economic Reports
FOMC meeting ends, policy statement due out at 2pm ET
Happy trading!
Tom