
EB Daily Market Report - Monday, December 19, 2022
Executive Market Summary
- Futures were flat overnight as we kicked off a new week - the last week before the Christmas holiday
- Selling momentum continues with NASDAQ shares taking on slightly more weakness
- Despite more selling today, the Volatility Index ($VIX, -1.15%) is down again, suggesting less volatility ahead
- The 10-year treasury yield ($TNX) is higher by 10 basis points, rising to 3.59%; key yield resistance resides in the 3.61%-3.63% range and the 20-day EMA is at 3.60%
- Weakness today is centered in key aggressive areas as communication services (XLC, -2.32%), consumer discretionary (XLY, -1.66%), and technology (XLK, -1.66%) are hardest hit
- Meanwhile, consumer staples (XLP, -0.41%) is today's best-performing sector, though all 11 sectors are down
- Crude oil ($WTIC, +1.64%) is back above $75 per barrel, but energy shares (XLE, -0.46%) are still weak
- Economic reports will be light early this week and there will be few earnings reports out until January
- Gambling stocks ($DJUSCA, -3.85%) are under pressure, succumbing to a negative divergence - more on this below
- Wynn Resorts (WYNN, -5.31%), a gambling stock, is among the weakest S&P 500 stocks today
Market Outlook
This morning, on my Trading Places LIVE show, I discussed the Volatility Index ($VIX) as it's actually been flat to slightly lower, while the overall market sells off. This makes little sense, because falling prices drive fear higher and typically drives volatility higher as well. The fact that the VIX remains relatively low suggests that market makers are comfortable with current premium on options. Usually that premium soars as market makers earn more money on options trades. As it remains in the 20s, I can't help but think this is a signal that the stock market is heading higher. On the following chart, I placed a 5 day rate of change (ROC) on the S&P 500 chart. As that rate of change drops to panicked levels, check out the corresponding VIX moves:
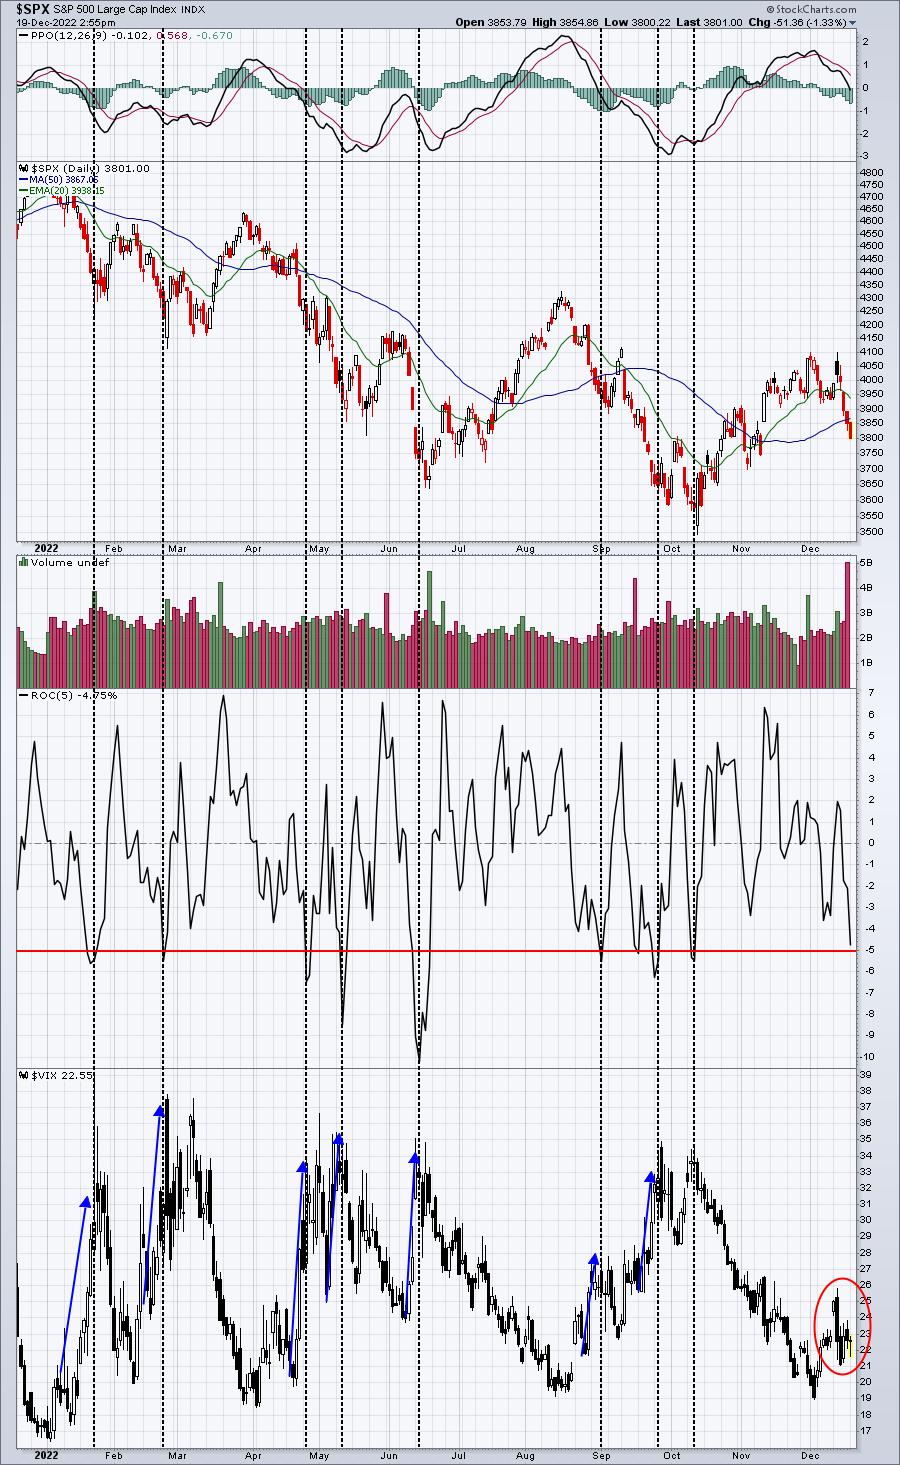
What the heck is happening? On EVERY 5%+ move down in the S&P 500 this year, the VIX has soared. Outside of the gap higher on Monday morning of last week, there's been no upside in the VIX. Given the market's breakdown, the VIX, which is expected volatility, should be moving substantially higher to reflect the growing risk in the market, but it's not.
Perhaps the risk is declining? Think about it.
Sector/Industry Focus
Gambling stocks ($DJUSCA) have quickly reversed after attempting a breakout last week. One problem certainly could have been slowing bullish momentum as a negative divergence was at hand:
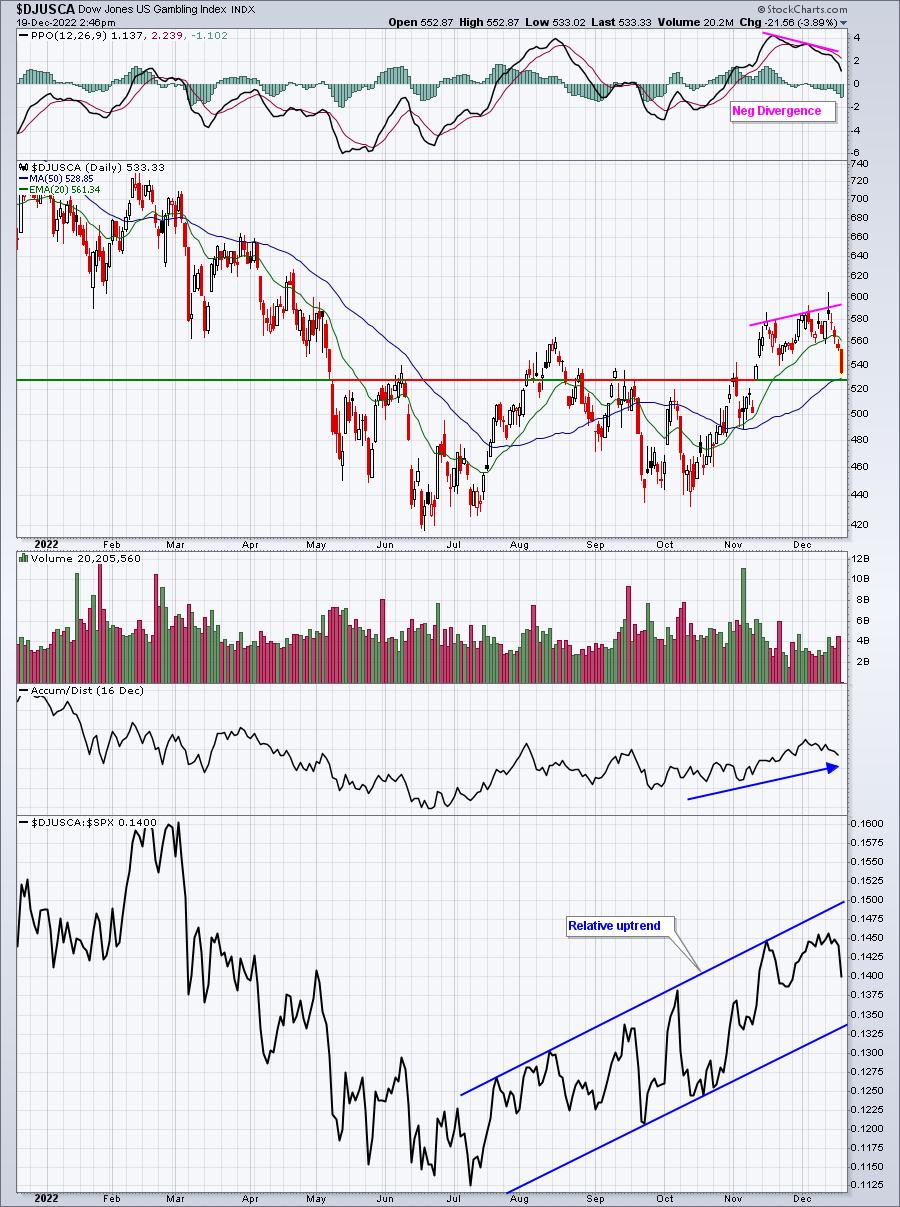
While today's candle looks ominous, the DJUSCA has actually been a relative leader for six months now and remains in a bullish relative uptrend. Also, the AD line has been strengthening as well. Let's see if the gambling stocks attract buyers near 530 as that's where gap support and the 50-day SMA reside.
ChartLists/Strategies
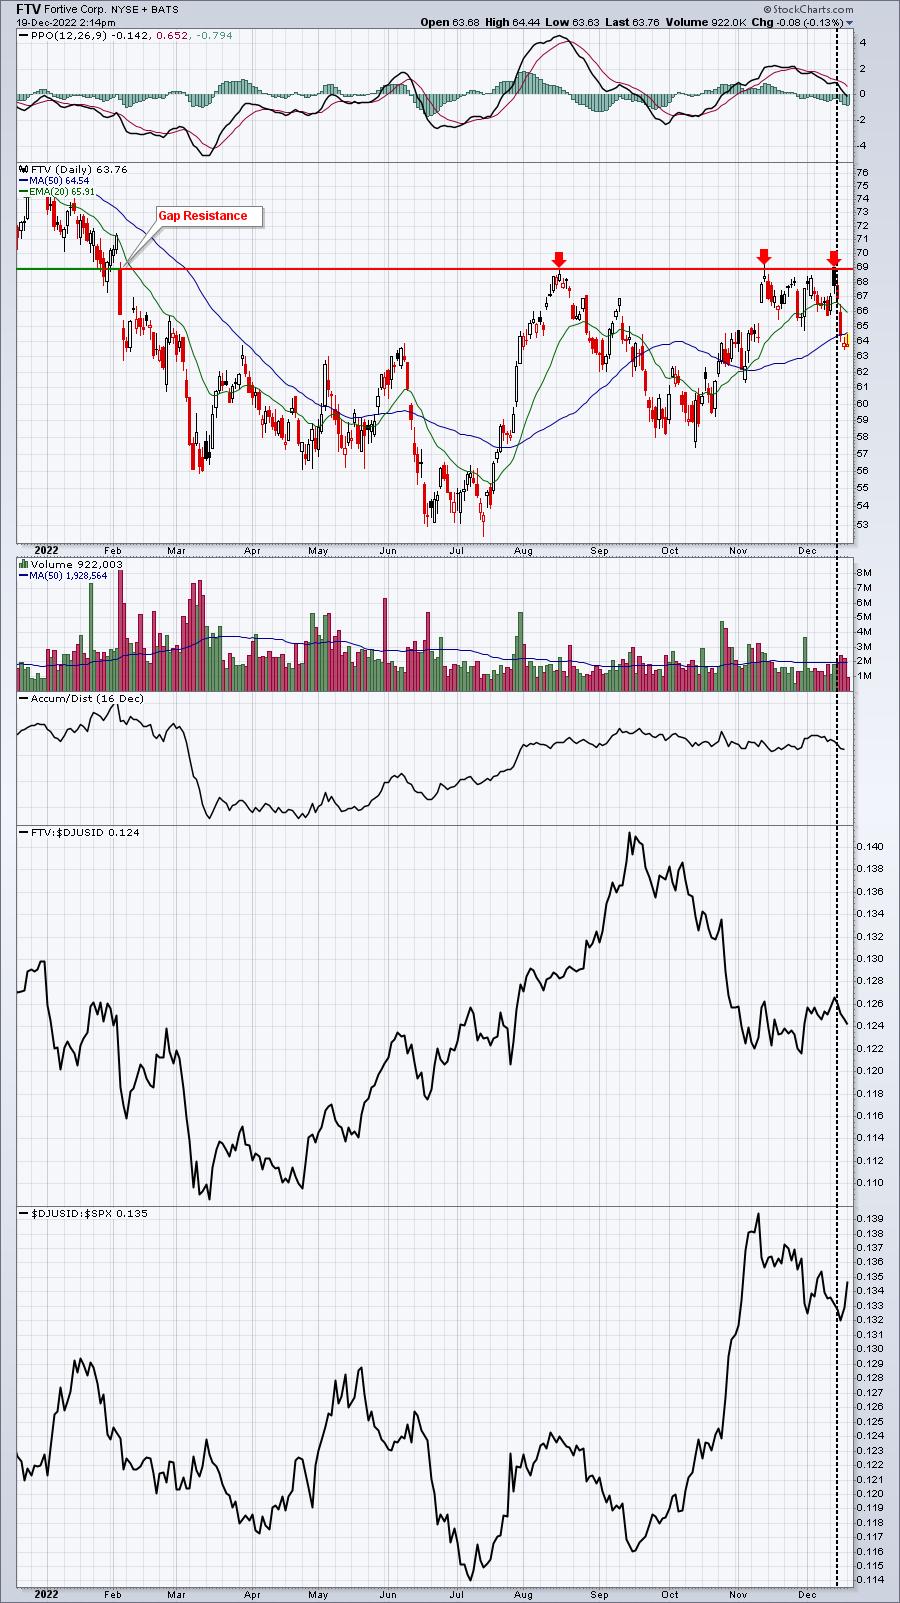
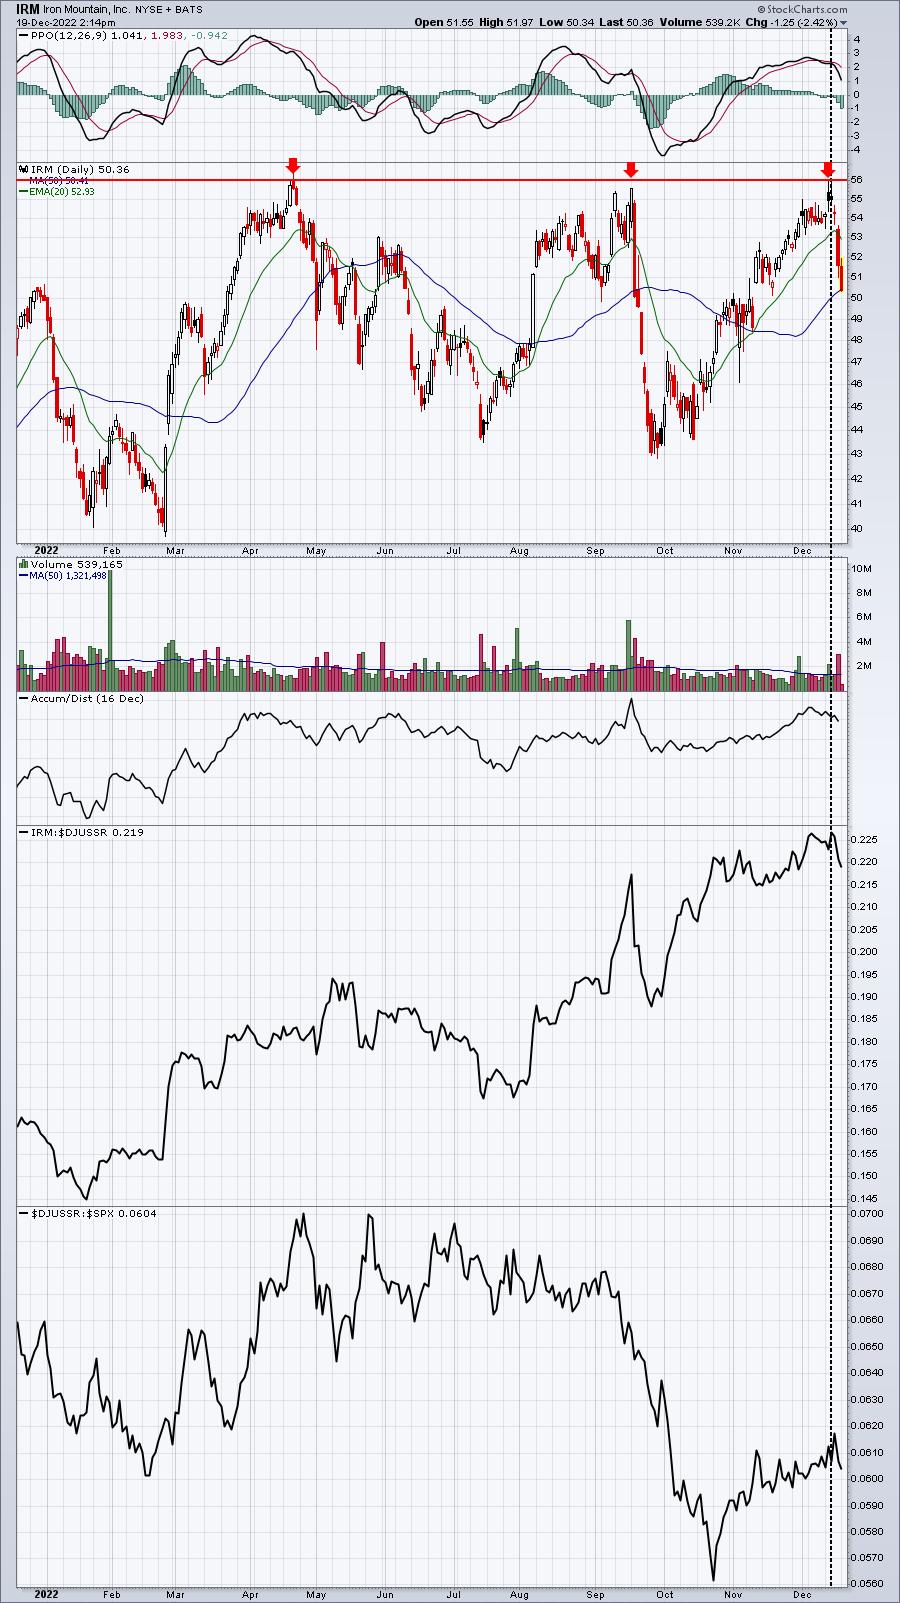
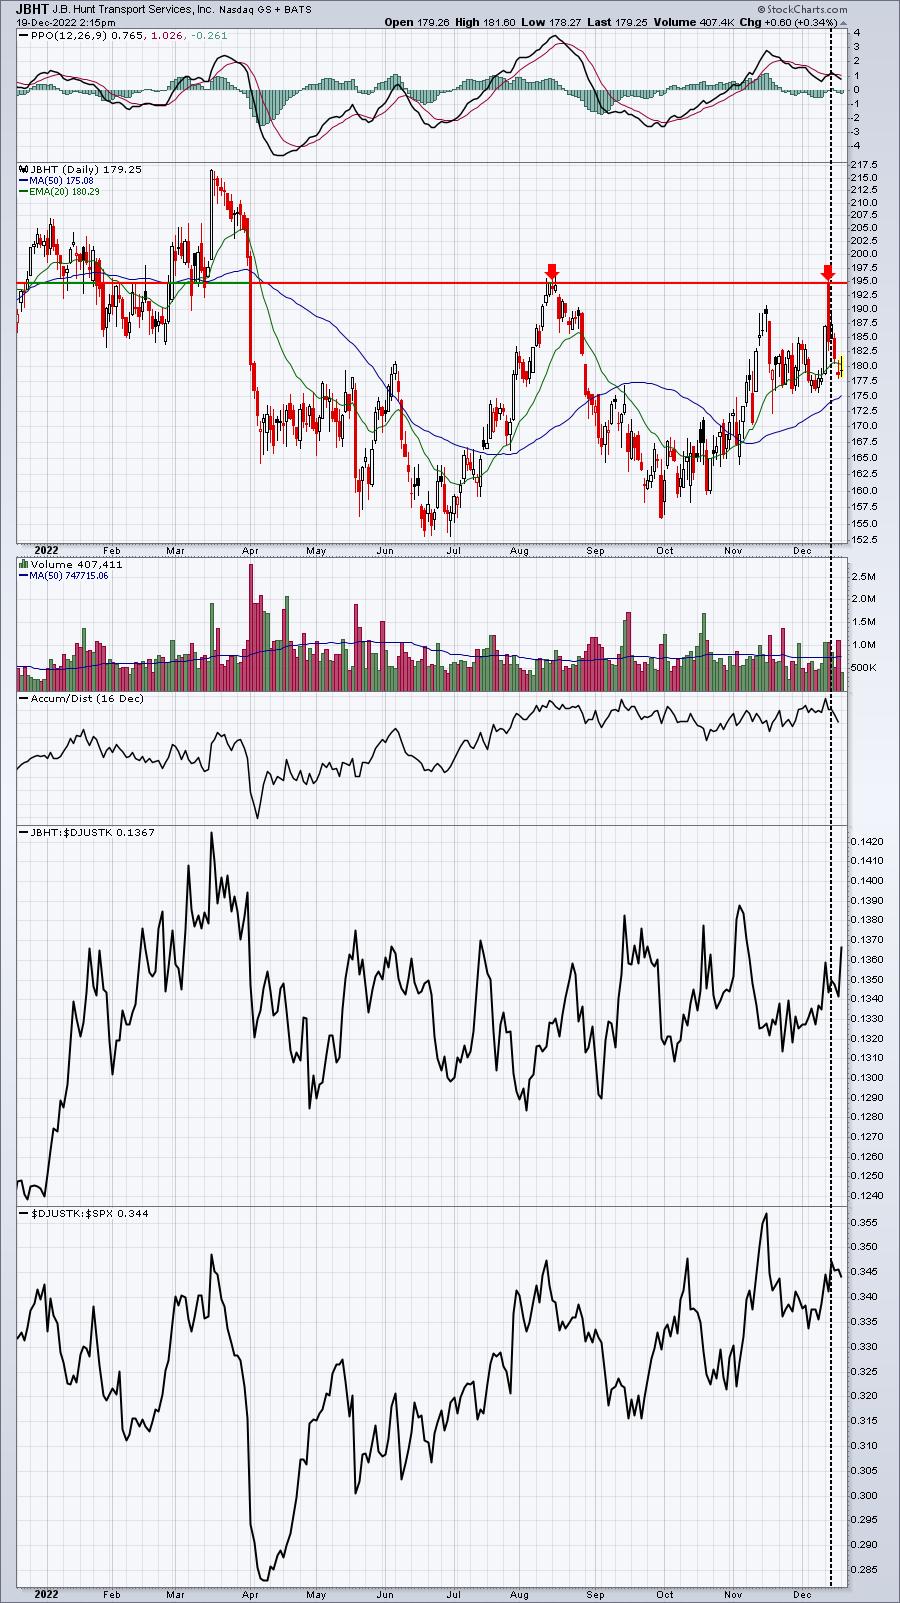
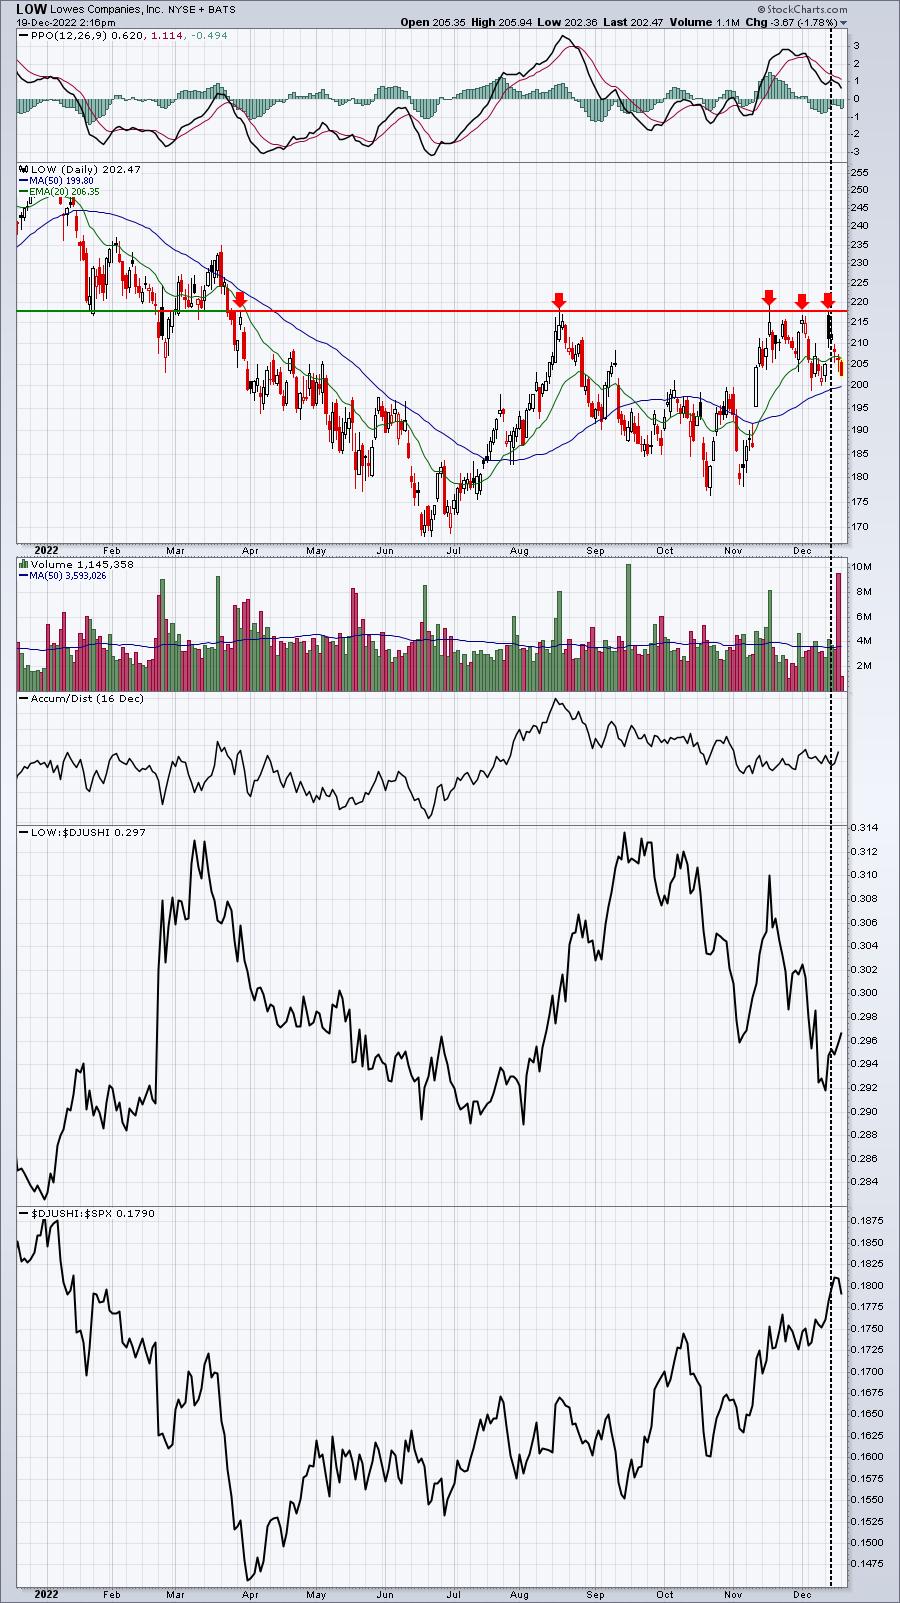
Last Wednesday, I shared 5 charts that showed obvious price resistance and improving charts. However, resistance had not been cleared. I want to show you all 5 charts again, so that you can understand the importance of seeing the breakout instead of buying and hoping the breakout occurs:
FTV:
IRM:
JBHT:
LOW:
V:
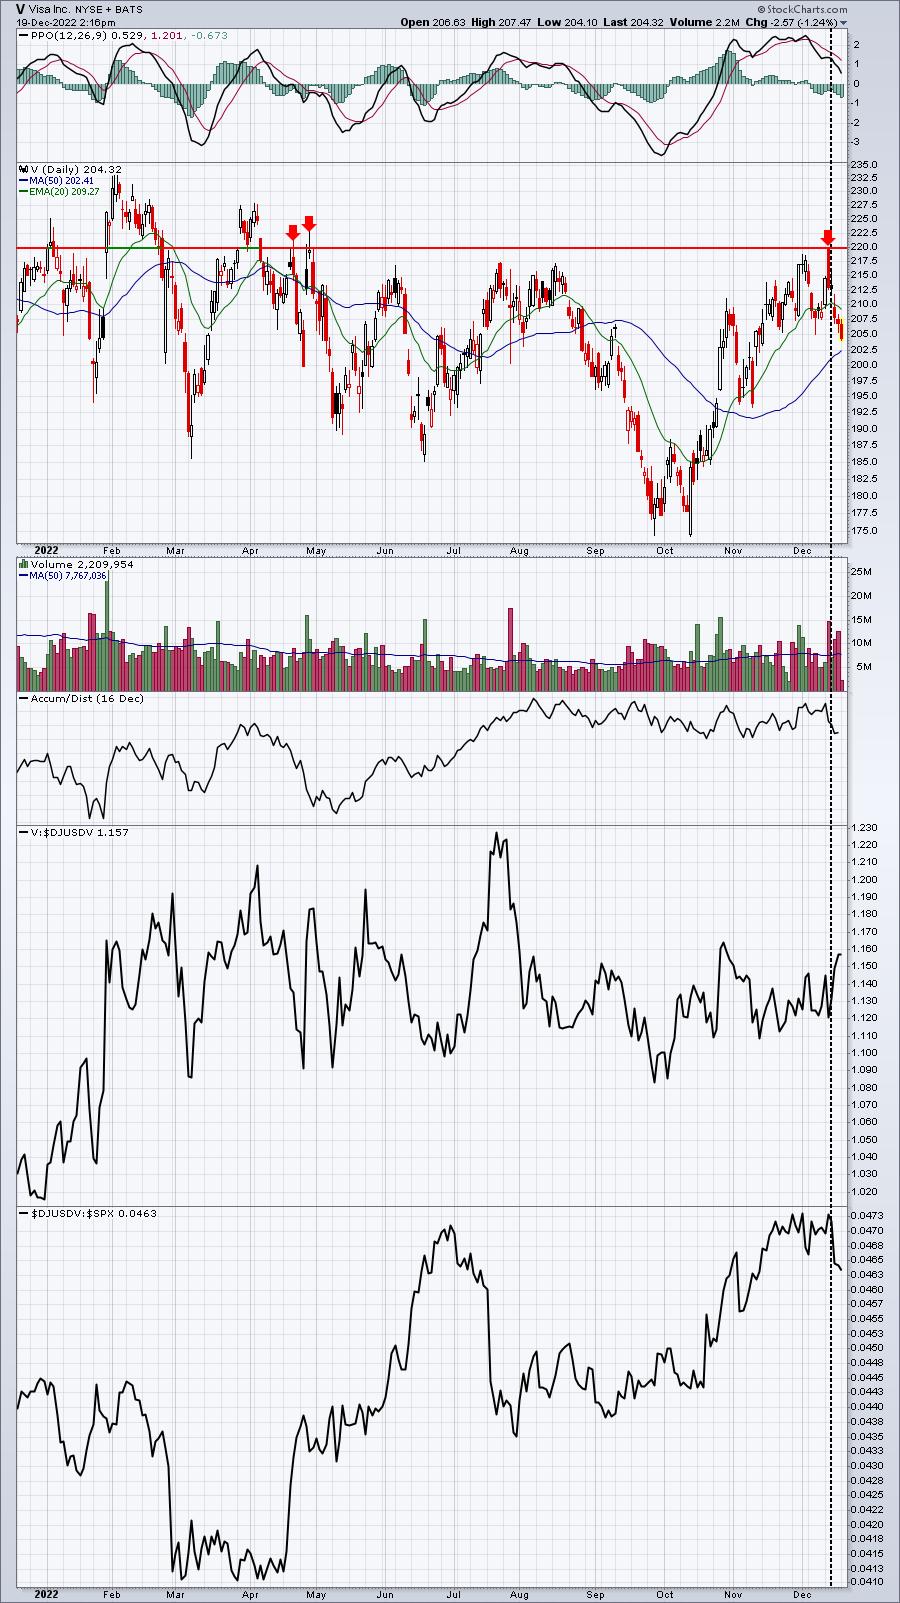
The only annotation I added to these charts was the black-dotted vertical line to highlight the change in stock price that's taken place since last Wednesday. This, in a nutshell, helps to explain why I prefer trading major ETFs like the QQQ, rather than individual stocks. I look to individual stocks to bolster my returns during uptrending markets. But in the current choppy and indecisive market, many times individual stocks simply add to losses.
Earnings Reports
Here are the key earnings reports for the next two days, featuring stocks with market caps of more than $10 billion. I also include several companies with market caps below $10 billion. Finally, any portfolio stocks that will be reporting results are highlighted in BOLD. If you decide to hold a stock into earnings, please understand the significant short-term risk that you are taking. Please be sure to check for earnings dates for any companies you own or are considering owning.
Monday, December 19:
HEI
Tuesday, December 20:
NKE, GIS, FDX, FDS, WOR, BB, AIR, FCEL
Economic Reports
December housing market index: 31 (actual) vs. 34 (estimate)
Happy trading!
Tom