
EB Daily Market Report - Tuesday, December 20, 2022
Executive Market Summary
- Futures were relatively flat this morning, but we did move lower after the opening bell
- The NASDAQ stocks are once again the laggard as key component stocks like Apple, Inc. (AAPL) struggle to hold key price support
- Cryptocurrencies are having a nice day, finally, to hopefully reverse the recent selling; etherium ($ETHUSD, +3.57%) is doubling today's return in bitcoin ($BTCUSD, +1.80%)
- Gold ($GOLD, +1.66%) is quite strong, benefiting from a weak U.S. dollar (UUP, -0.71%); $GOLD is threatening to close at its highest level since June
- Most commodities are higher, including crude oil ($WTIC, +1.10%), which has climbed just above $76 per barrel
- Energy (XLE, +1.84%) is leading the action today as 10 of 11 sectors trade higher
- Consumer discretionary (XLY, -0.79%) remains the weak link as Tesla (TSLA, -6.91%) is the S&P 500's worst-performing stock and is driving automobiles ($DJUSAU, -5.65%) lower
- General Mills (GIS, -4.06%) reported better-than-expected earnings, yet is down more than 4% on the session
Market Outlook
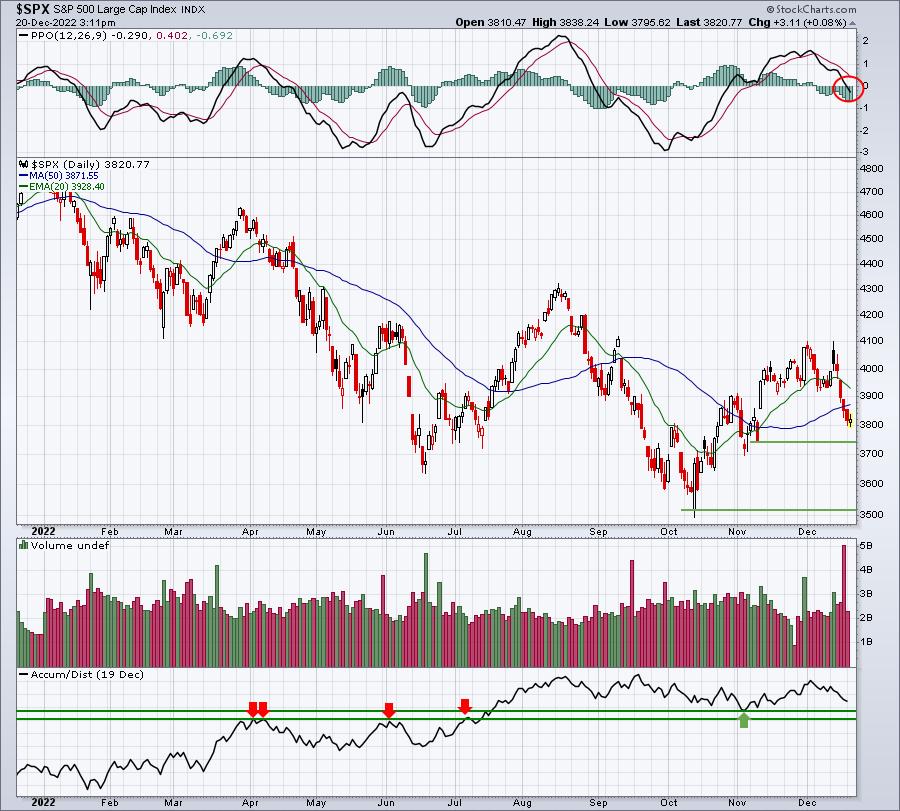
Since losing recent price support, gap support from the October CPI report released on November 10th, and key 20-day EMA and 50-day SMA, our major indices have been under continuing selling pressure. I know we never want to lose money, but the loss of these levels is the primary reason I indicated that leveraged ETFs is not the best strategy as indices trend lower. The compounding nature of leveraged ETFs actually end up costing investors/traders more than 3x the underlying ETF they expect. I see several signals that suggest this selling won't last, and that we'll see higher prices in time, but at the present, that doesn't seem to matter. Here is the current look at the S&P 500 with key support levels highlighted:
The largest component in both the S&P 500 and NASDAQ 100 is Apple, Inc. (AAPL). I'm watching AAPL's key price support near 130. If AAPL loses it, the odds of a continuing drop in our major indices increases:
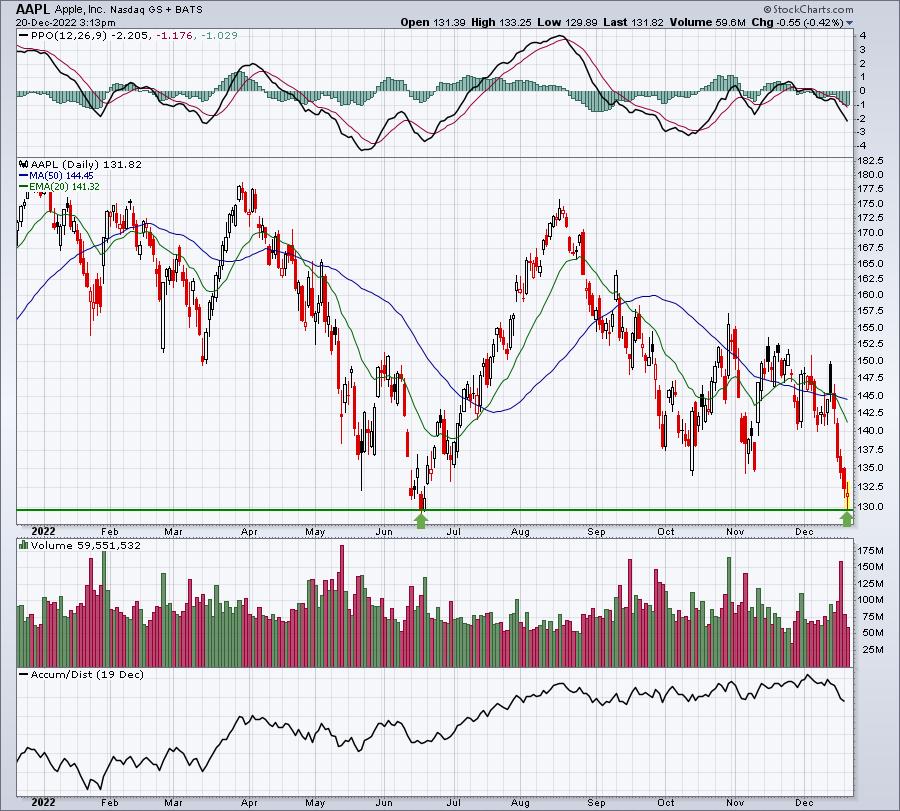
This is a big deal. Double bottoms can present nice trading opportunities on the long side - assuming that support holds. If it doesn't, this would represent a major breakdown that could trigger much more selling. And if the biggest component stock sells off hard, the major indices will likely have no choice but to go with it.
One last point. At the beginning of December, I published our December Seasonality Report and this was the December performance breakdown of the S&P 500 (annualized returns by period) since 1950:
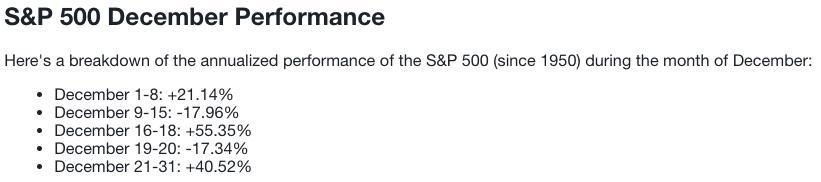
The second half of the month is strong historically, but the 19th and 20th (yesterday and today) have been two primary exceptions. The market is running out of excuses. I'd like to see a rally into year end, but if it happens, it'll have to happen with a slew of current broken charts - Tesla (TSLA) is one that quickly comes to mind.
Sector/Industry Focus
Despite a poor housing market index report on Monday and a not-so-great housing starts and building permits release this morning, the home construction ($DJUSHB) group is handling bad news well - and that's typically a very bullish development. The group recently broke out above 1300 and is now pulling back to test that level. Homebuilding stocks wouldn't be a bad choice here, with tight stops when possible. Check this out:
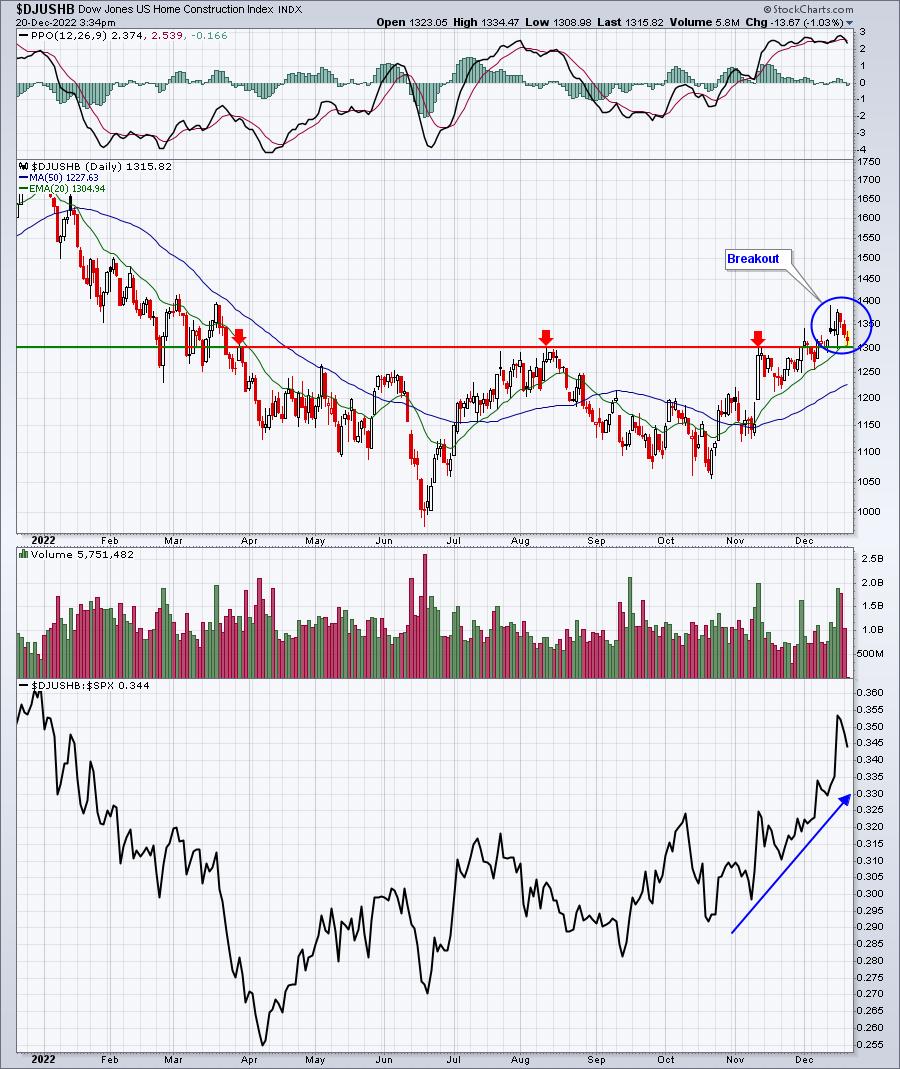
Money is rotating heavily into this group, which I believe bodes very well for the direction of interest rates in the coming months. Higher interest rates ahead would likely send home construction stocks sliding rapidly, but that's not the case. We have to at least consider the story that's being told here.
ChartLists/Strategies
Between this afternoon and tomorrow, there'll be a few key earnings reports due out. Let's look at a couple to see if they're offering any clues as to what we might see:
NKE:
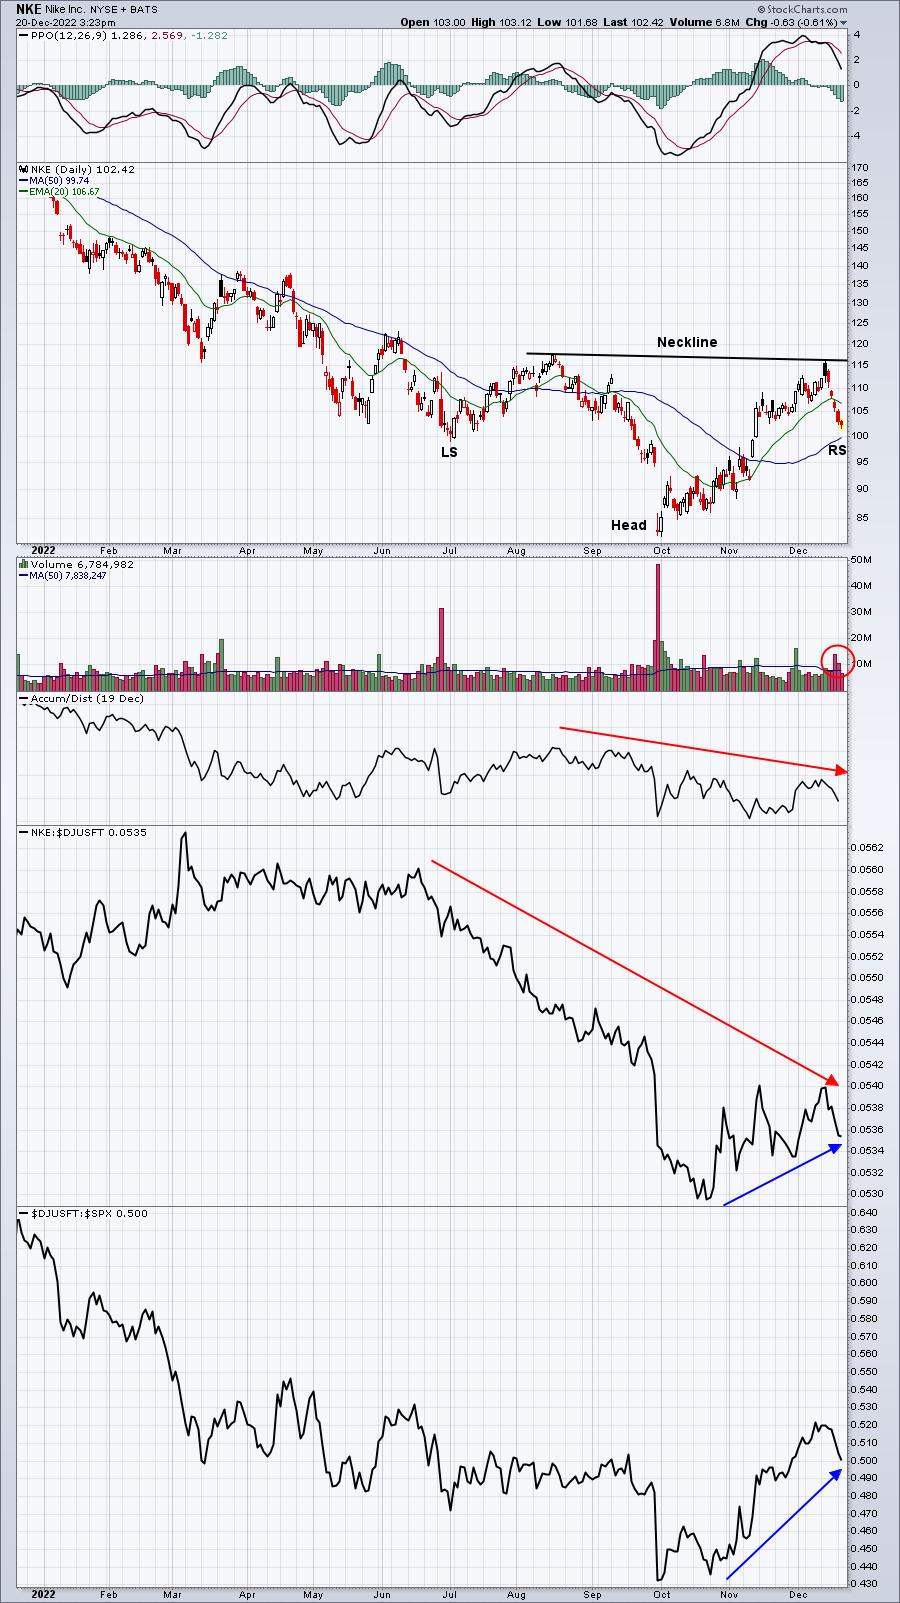
I generally like to see an up sloping neckline as taking out resistance on the left side of the neckline is a bullish development, prior to dropping back into the right shoulder. So the pattern is a possible bullish signal that requires a breakout to confirm, but it's not exactly setting up the way I'd like to see it. Also, the AD line is weak and the recent selling has seen accompanying volume that's higher than average. Relative strength on NKE isn't great either, though the footwear group ($DJUSFT) itself has improved. All in all, I'm not impressed with NKE heading into earnings. Hopefully, they'll surprise in bullish fashion.
CTAS:
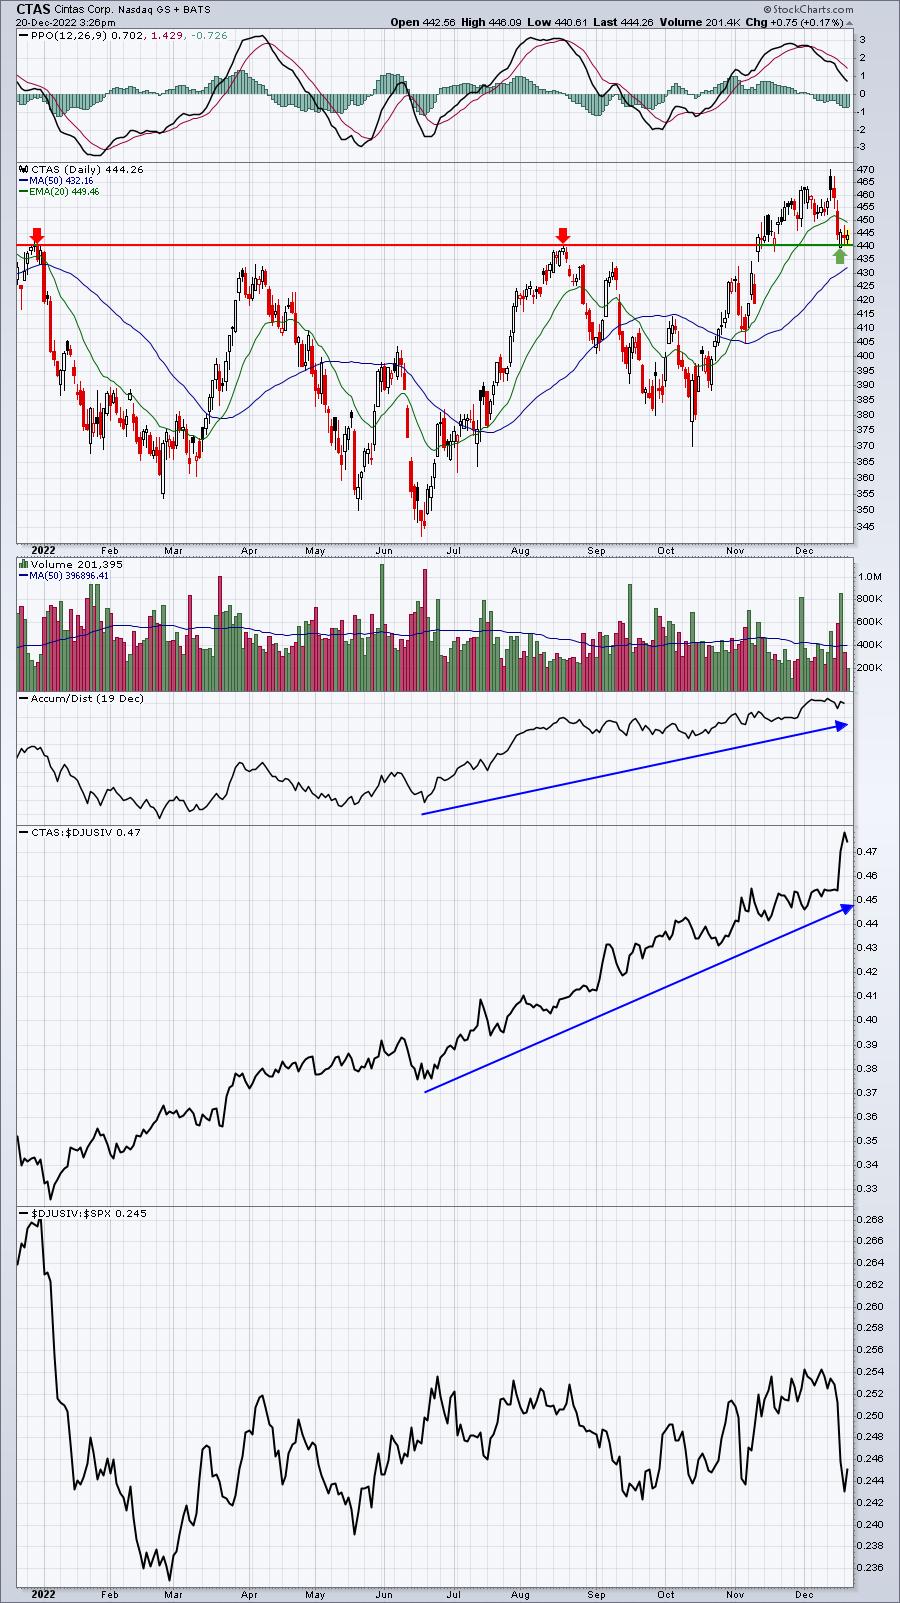
Now this one I like. I love the strong AD and relative strength. Also, it recently broke out to a 2022 high and the recent weakness presents and entry opportunity. I expect the earnings report will be better than expected, but has the good news been built in? I'd like to enter on the 50-day SMA after a possible post-earnings selloff, if it were to occur.
MU:
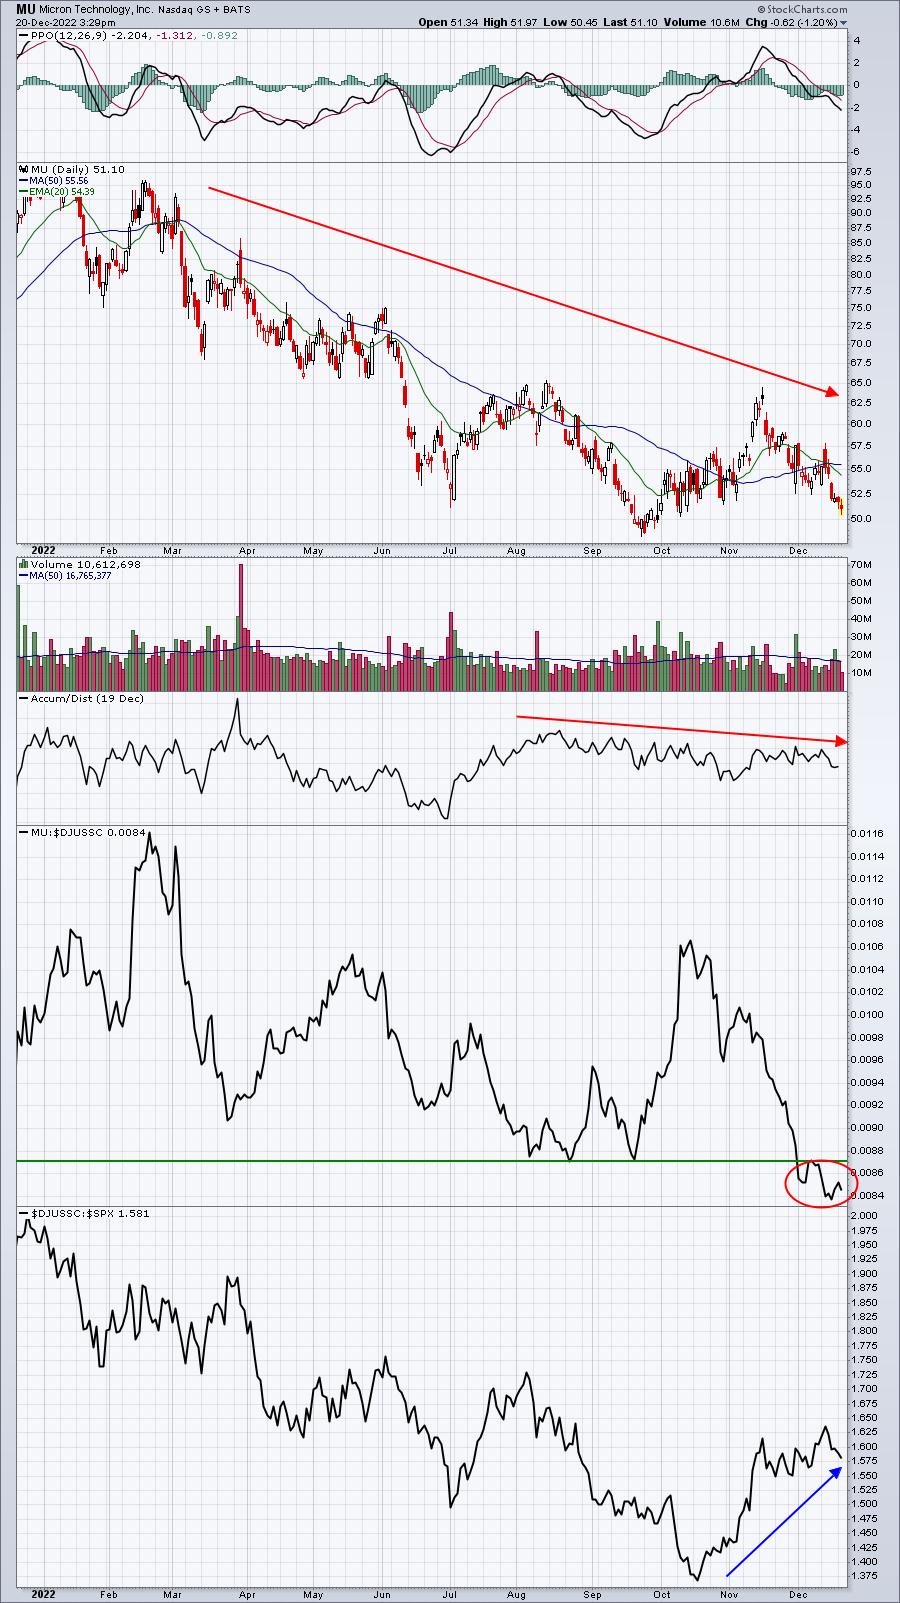
And this is the rotten apple in the bunch. I know semiconductors ($DJUSSC) have shown some relative strength over the past two months, but it's not because of MU. MU has been one of the weakest semiconductors and we're likely to find out why after this earnings report is released. I'd take no chances here.
Earnings Reports
Here are the key earnings reports for the next two days, featuring stocks with market caps of more than $10 billion. I also include several companies with market caps below $10 billion. Finally, any portfolio stocks that will be reporting results are highlighted in BOLD. If you decide to hold a stock into earnings, please understand the significant short-term risk that you are taking. Please be sure to check for earnings dates for any companies you own or are considering owning.
Tuesday, December 20:
NKE, GIS, FDX, FDS, WOR, BB, AIR, FCEL
Wednesday, December 21:
MU, CTAS, TTC, CCL
Economic Reports
November housing starts: 1,427,000 (actual) vs. 1,400,000 (estimate)
November building permits: 1,342,000 (actual) vs. 1,495,000 (estimate)
Happy trading!
Tom