
EB Daily Market Report - Thursday, December 22, 2022
Executive Market Summary
- Futures were very weak and we saw our major indices gap down at the opening bell
- Selling quickly intensified and the NASDAQ saw the brunt of the selling once again; we have seen a recovery this afternoon and a strong finish into the close would obviously be better than the alternative
- Tesla (TSLA, -8.39%) continues to put tremendous pressure on autos ($DJUSAU, -7.61%) and consumer discretionary (XLY, -2.65%), which is again today's worst-performing sector
- All 11 sectors are lower with health care (XLV, -0.19%) the best performer
- Commodities are lower, nearly across the board; volatile natural gas ($NATGAS, -5.50%) has been declining rapidly in recent sessions and is now challenging the October closing low of $4.96
- CarMax (KMX, -3.67%) dropped considerably at the open after reporting quarterly results, but it's rebounded significantly
- The 10-year treasury yield ($TNX) is flat on today's session, so stocks have been showing little positive or negative correlation with treasury yields of late
- FedEx (FDX, +2.65%) is the only stock in the S&P 500 to gain more than 2% today
Market Outlook
Today's action is very disappointing after a solid recovery day on Wednesday. I was certainly expecting follow through, but instead we're seeing the exact opposite - new lows. One of the most notable changes today was the soaring Volatility Index ($VIX) earlier. It's been a wild ride and the VIX is now dropping back, but how the market (and the VIX) finish this afternoon could go a long way in determining whether we're going to see another test of the June/October bottoms. I don't like to see closes at or near lows of the session, with a VIX that breaks out. Here's a chart of the S&P 500 (with the VIX in the panel below):
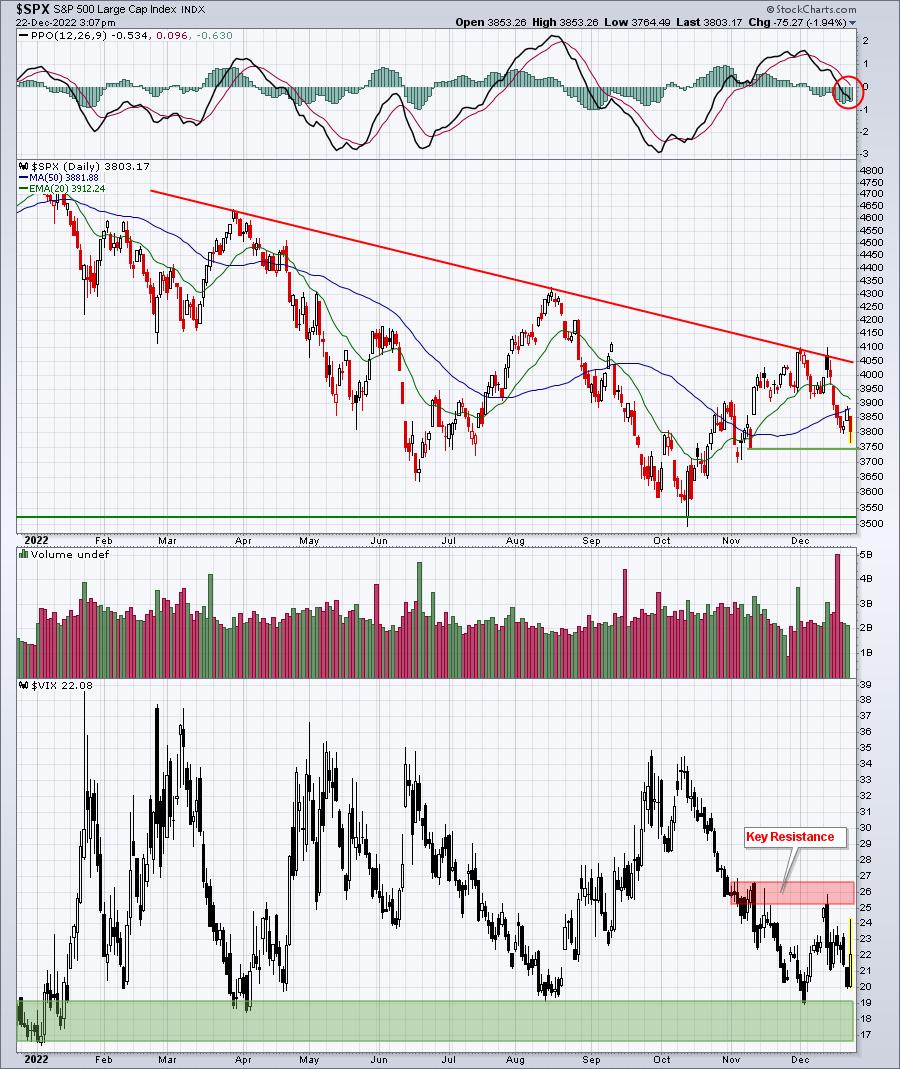
To be clear, I have not changed my opinion about this being a bottoming phase in the stock market and to expect higher prices in 2023. Personally, I believe stock market has lost a lot of faith in this Fed and the lack of that credibility has triggered this latest move lower. The fact that the VIX still remains very low, given the latest market selloff, is a signal that prices are not likely to move significantly lower. Is this a guarantee? Of course not. I simply share my opinion of what I'm seeing in the market and leave it up to our members to decide how to proceed in their own personal situation and circumstance.
I'm keeping an eye on the VIX. History tells us that if the VIX moves below 16-17, the bear market is confirmed to be OVER. The key support range that I've included in that lower panel above (green-shaded area) needs to be watched. If the S&P 500 does rally - either to close out this year or to begin 2023, or both - the VIX moving below 16-17 would be a major signal to me that the bull market is resuming. An S&P 500 price break above 4110 would also be extremely bullish as that would break the 2022 downtrend line. We've still got lots of work to do before the VIX support and S&P 500 resistance is cleared. I suggested we needed a lot of patience at the beginning of 2022 and, due to the Fed, I believe that patience requirement has been extended.
Sector/Industry Focus
Most of you should know by now that I'm a HUGE fan of the equity-only put-call ratio ($CPCE), especially the 5-day moving average, to call significant market tops and bottoms. Unfortunately, I have absolutely ZERO idea what is going on with the CPCE. Yesterday, it printed a 2.0 reading, which is BY FAR the highest reading ever. And it occurred on a day when stocks were rallying. This makes no sense and I won't use a signal that I don't understand. So, for now, the CPCE is off the table for me. We're likely to get another bizarre reading today. Here's the half hourly CUMULATIVE equity-only put-call ratio from the CBOE:
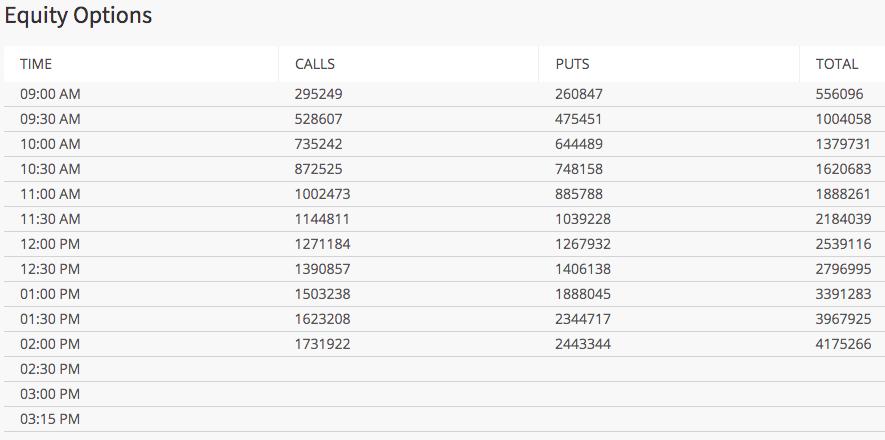 If you take 2,443,344 (cumulative equity puts) and divide it by 1,731,922 (cumulative equity calls), you get a cumulative reading of 1.41. Check this out:
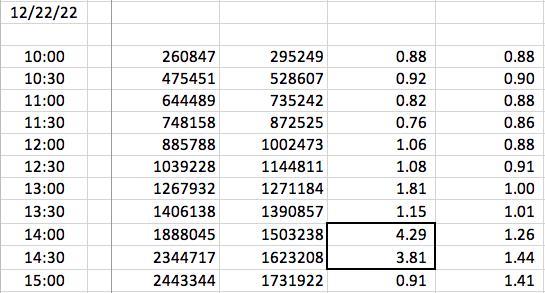
I set this up in Excel so that I can track the intraday put call ratios. I've outlined the culprits for today's overstated reading - it occurred at the 2:00pm and 2:30pm readings - but this is central time. It's actual 1:00pm and 1:30pm ET.
Here were the readings from December 16th, with two similar half-hourly ratios highlighted:
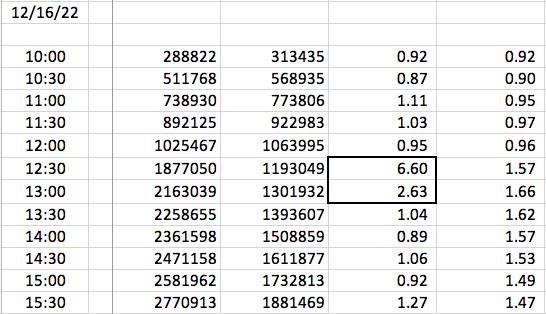
Folks, I've been doing this for a VERY LONG TIME. I've used the equity-only put-call ratio for the past two decades and I've NEVER seen these types of intraday readings. I'm seeing MASSIVE jumps in the number of equity puts and it's happening in the middle of the trading day, when options volume tends to be quite light. Again, it makes no sense and, therefore, I am not using the $CPCE data at StockCharts until I see this remedied - or explained in a manner that makes good common sense.
Some of you have written to me and questioned whether the unexpectedly low VIX readings might somehow be tied to these crazy put call readings. They honestly should have nothing to do with one another, because the VIX is calculated based on option premiums on short-term S&P options - not equity options. So I don't see any way that these two are correlated in any way.
ChartLists/Strategies
Yesterday's reversal certainly didn't last long and underscores the difficulty of trading individual stocks during a wildly choppy market. WING was discussed as a nice reversal after printing an intraday low yesterday beneath prior lows. After a strong finish yesterday, WING dropped significantly earlier today, setting even lower intraday readings. It's trying to hold onto support into today's close, but this failure to extend yesterday's rally points to the difficulty of trading individual stocks in this market. It's scary.
Earnings Reports
Here are the key earnings reports for the next two days, featuring stocks with market caps of more than $10 billion. I also include several companies with market caps below $10 billion. Finally, any portfolio stocks that will be reporting results are highlighted in BOLD. If you decide to hold a stock into earnings, please understand the significant short-term risk that you are taking. Please be sure to check for earnings dates for any companies you own or are considering owning.
Thursday, December 22:
PAYX, KMX
Friday, December 23:
None
Economic Reports
Q3 GDP (final estimate): 3.2% (actual) vs. 2.9% (estimate)
Initial jobless claims: 216,000 (actual) vs. 225,000 (estimate)
November leading indicators: -1.0% (actual) vs. -0.5% (estimate)
Happy trading!
Tom