
EB Daily Market Report - Tuesday, January 3, 2023
Happy New Year!!!!
I hope everyone was able to relax, get away from the stock market for a bit, and enjoy the holidays with family and friends. All of us at EarningsBeats.com wishes all of you a prosperous and healthy 2023!
ChartLists Updated
The following ChartLists have been updated and are now available for download/viewing on our website:
- January Seasonality ChartList (SEASCL)
- Strong Earnings ChartList (SECL)
- Strong Future Earnings ChartList (SFECL)
- Strong AD ChartList (SADCL)
- Raised Guidance ChartList (RGCL)
- Short Squeeze ChartList (SSCL)***
- Bullish Trifecta ChartList (BTFC)
*** I am not providing a January Short Report as little has changed for the Short Squeeze stocks since I published the December Short Report. SWTX (needs more volume) and SRG (needs another breakout) are the only two stocks where I have even moderate interest. Every other stock is in a confirmed downtrend and I NEVER try to call bottoms in stocks that are heavily shorted. As you can see by looking at the charts on the ChartList, this has been and continues to be a losing proposition.
Executive Market Summary
- Futures were refreshingly green as we opened a brand new year
- After early strength, however, the sellers returned in force, sending our major indices to 1%+ losses
- The NASDAQ has again been hit the hardest, led by Apple, Inc. (AAPL, -4.10%); AAPL is the largest market cap company and, thus, has the biggest influence on both the S&P 500 and NASDAQ 100
- Cryptocurrencies are mostly negative to open 2023, though mostly fractionally negative
- There's been mixed action in commodities, though crude oil ($WTIC, -3.91%) is off to a rough start, sending energy shares (XLE, -4.06%) significantly lower
- Internet stocks ($DJUSNS, +1.39%) have outperformed the S&P 500 in 9 of the last 10 year during January and it's avoiding the sellers today so far
- Communication services (XLC, +1.21%) is the beneficiary of the internet strength and is the only sector in positive territory today
- Tesla (TSLA, -13.14%) has seen the 2022 selloff continue right into 2023 as it's easily the worst-performing stock in the S&P 500
- Meta Platforms (META, +3.58%) is helping to lead the internet push higher today and traded at more than a 2-month high
Market Outlook
The S&P 500 ($SPX) performed much better than the NASDAQ 100 ($NDX) in Q4, but January tends to favor NASDAQ stocks as the NASDAQ, on average, has gained more than TWICE the S&P 500 in January over the past 50 years. If you're looking for a bearish signal - one to perhaps batten down the hatches, I'd look to the Volatility Index ($VIX). Prior 2022 selloffs have accelerated when the VIX makes a key breakout. Check this out:
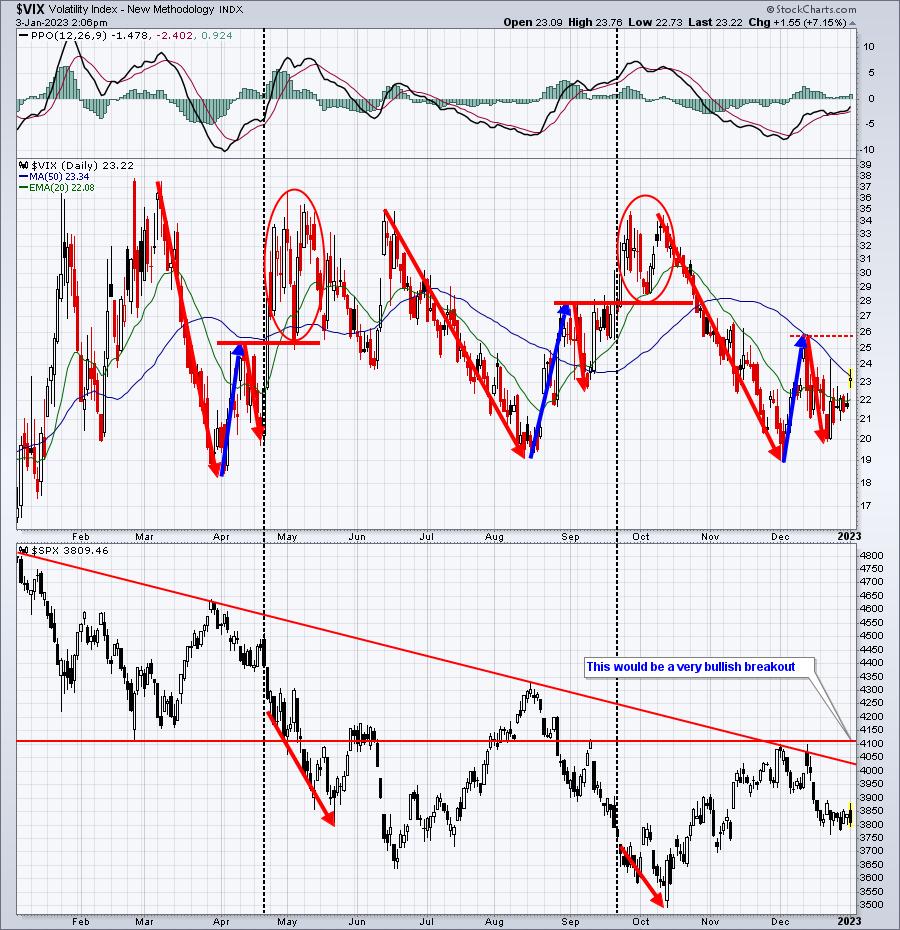
Keep in mind that I use technical analysis to manage risk. In my opinion, if the VIX were to break out above the 26 levels, the ODDS of a further decline would increase significantly. That's when I'd be most concerned to protect capital. It wouldn't necessarily suggest that we're going to break below the October low, but it would increase the odds of a further short-term decline.
On the flip side, I believe a breakout above 4110 on the S&P 500 would be extremely bullish, perhaps even confirming the October low is THE low of this cyclical bear market.
January 2023 is going to be very interesting.
Sector/Industry Focus
Is the glass half full or half empty? When I look at the performance of several key stocks in the S&P 500 and NASDAQ 100 like AAPL, AMZN, TSLA, NVDA, etc., it's VERY difficult to be bullish as these are some of the most-heavily weighted stocks in these two major indices. If they are performing poorly, it's a HUGE advantage for the bears to be able to force another critical breakdown in our major indices. So why might we consider this as our glass being half full? Well, think about it. If we're seeing awful action in the most influential stocks in our major indices and they continue to hold their October lows, what is that saying about the rest of the market? Without looking any further at stocks, I could make the bullish assumption that proceeds from sales of stocks like those mentioned above are NOT LEAVING THE STOCK MARKET. Instead, the money is simply rotating to other stocks, helping them flourish. Until this rotation changes, we need to be prepared to trade (on the long side) what is working, not what we "hope will work". Trust me, we'll have plenty of opportunities to trade AAPL, TSLA, and the others, on the long side. For now, it makes the most sense to stick with what's working until leadership changes.
ChartLists/Strategies
We've opened 2023 in a manner similar to what we experienced in the second half of 2022. There's been lots of morning weakness, but we still have the afternoon to go. Throughout much of 2022, any strength the bulls could muster generally occurred after lunch time. We'll see if that holds true today. If it does, looking for strong relative strength stocks on the Strong AD ChartList (SADCL) that could move higher into the close makes good sense. The reason that stocks have strong AD lines is due to the fact that they tend to finish the day in the upper half of their daily candle bodies. Here are two stocks from the SADCL (also on Bullish Trifecta ChartList (BTCL), which means that these two stocks have also beaten Wall Street estimates as to its latest quarterly revenues and EPS, AND are on our Raised Guidance ChartList (RGCL) having raised guidance in the past quarter):
CHX:
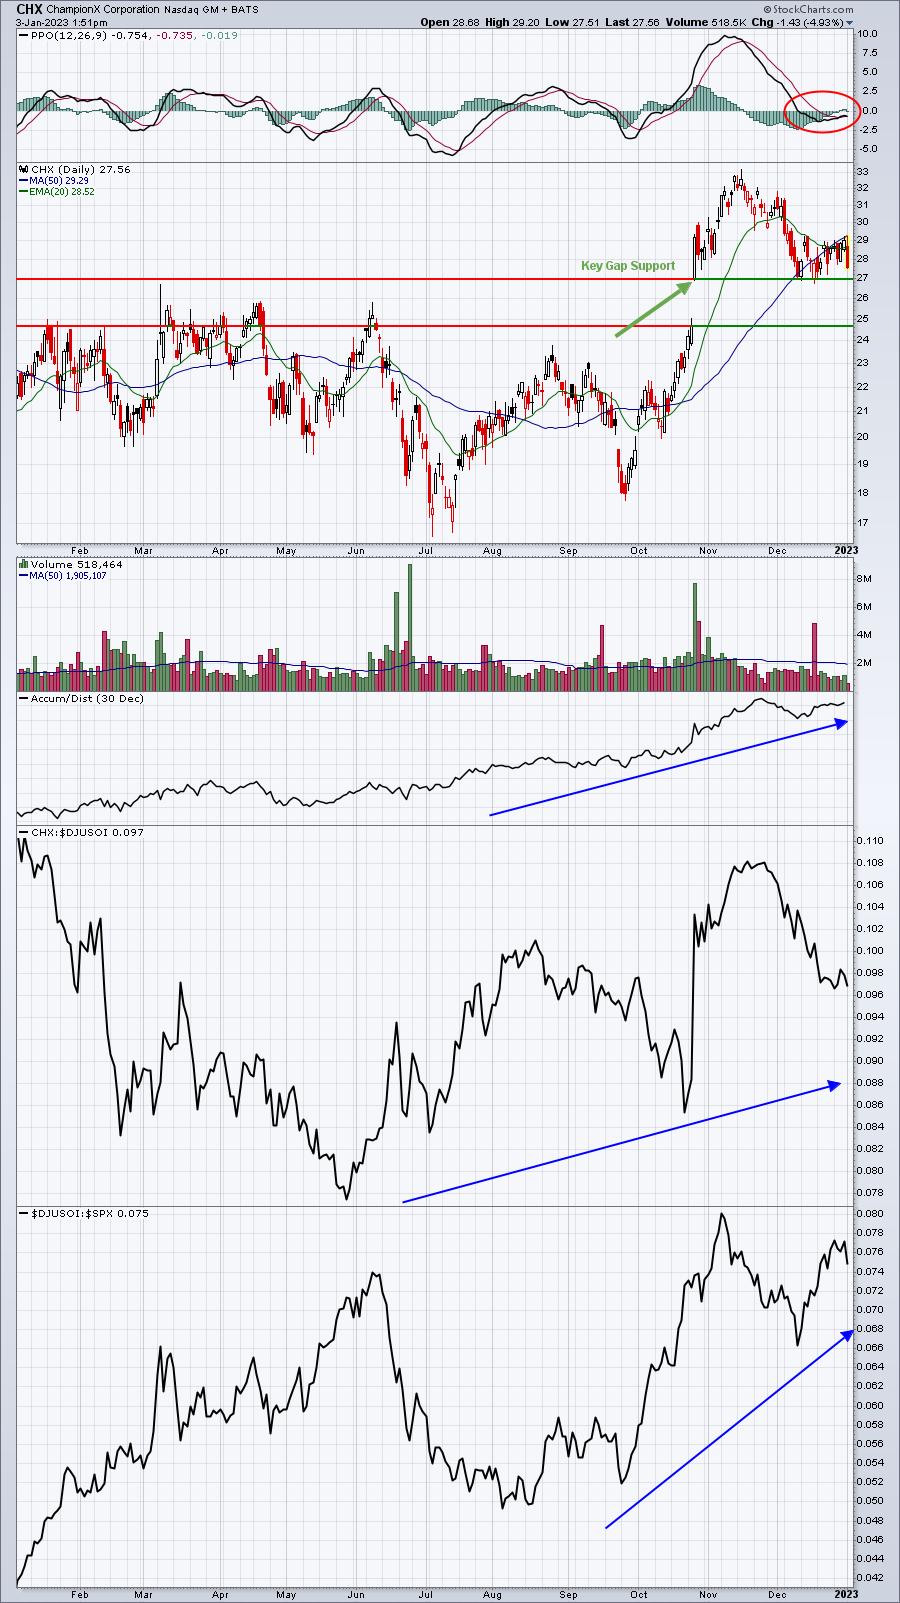
CHX is a leader in the bullish oil equipment & services group ($DJUSOI) and has a strong AD line. Energy stocks can be extremely volatile, depending on the direction of crude oil prices ($WTIC) to some extent. However, solid gap support resides at 27.00 and CHX tends to rally off of intraday lows. We'll see if that happens into today's close.
SILK:
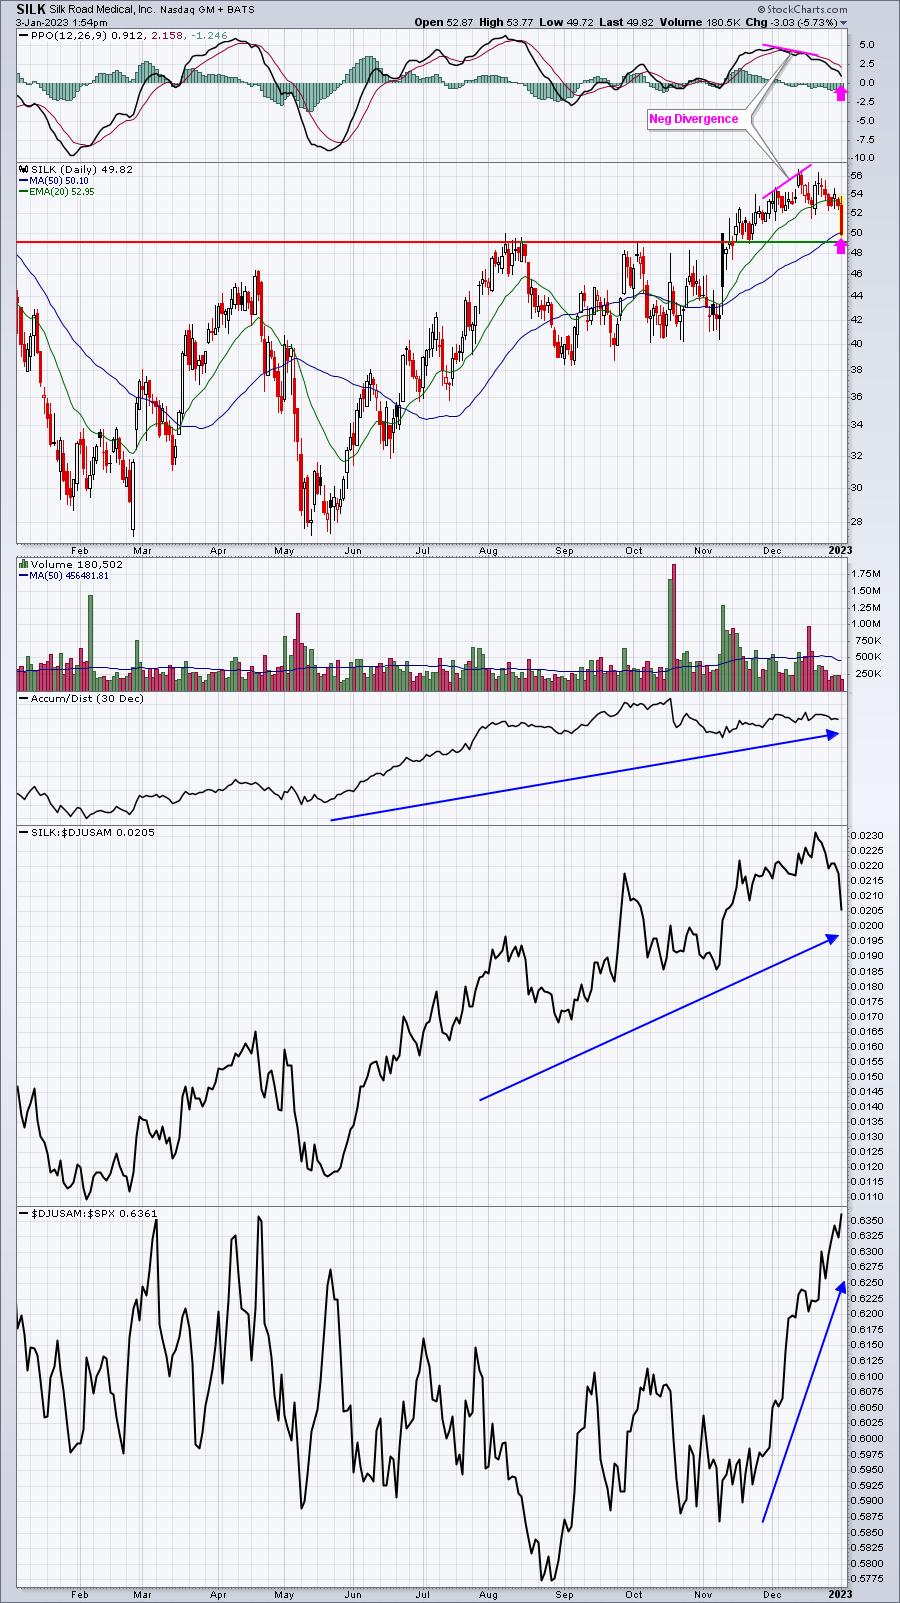
The negative divergence is a signal that bullish momentum is slowing. I typically look for a 50-day SMA test and a PPO centerline test after such a divergence prints. From there, the stock is free to go anywhere. What I really like here on SILK is that it's part of a rapidly-accelerating industry group - medical equipment ($DJUSAM) - and it's a leader in the group. Throw in the strong AD line over the past year and it gives me more confidence to trade a stock like SILK.
(Disclosure: I own SILK)
Earnings Reports
Here are the key earnings reports for the next two days, featuring stocks with market caps of more than $10 billion. I also include several companies with market caps below $10 billion. Finally, any portfolio stocks that will be reporting results are highlighted in BOLD. If you decide to hold a stock into earnings, please understand the significant short-term risk that you are taking. Please be sure to check for earnings dates for any companies you own or are considering owning.
Tuesday, January 3:
SGH
Wednesday, January 4:
UNF, SLP
Economic Reports
December PMI manufacturing: 46.2 (actual) vs. 46.2 (estimate)
November construction spending: +0.2% (actual) vs. -0.4% (estimate)
Happy trading!
Tom